Docker has become a popular framework for application deployment since its development due to its benefits. For example, it makes it easier for organizations to enhance the portability of their applications and operational resilience. Docker is an open source technology used to package applications into containers. Docker containers are lightweight, standalone, and runnable instances of a Docker image that isolate software running in the container from the operating system environment. With these benefits, many organizations have adopted the technology to quickly package their software in standard units for development, shipment, and deployment.
The increased usage of containerized software has increased the attack surface for organizations. This provides an additional asset for cyber threat actors to target in their attacks. Therefore, it is crucial to continuously monitor containers to gain complete visibility of their environment and events during execution.
In this blog post, we demonstrate how to do the following:
- Monitor Docker events such as
pull,create,start,mount,connect,exec_start,detach,die,exec_create,exec_detach, etc. - Monitor Docker container resources such as CPU, memory, and network traffic utilization.
- Detect when container CPU and memory usage exceed predefined thresholds.
- Monitor the health status and uptime of Docker containers.
Docker Container: Infrastructure setup
The following setup is used to illustrate the capability of Wazuh to monitor Docker container events and their metrics:
- A Centos 7 endpoint running the Wazuh 4.3.10. The Wazuh central components can be installed using this Quickstart installation guide.
- An Ubuntu 22.04 endpoint running the Wazuh agent 4.3.10. This endpoint also hosts the Docker container infrastructure. This Wazuh guide is used to install the Wazuh agent.
Monitoring with Wazuh
Wazuh has the Docker listener and command monitoring modules that can be used to collect security and runtime events from Docker containers. The Docker listener module communicates with the Docker API to collect events related to Docker containers. The command monitoring module is used to monitor the output of specific commands and trigger alerts if they match a rule.
Ubuntu endpoint configuration
Follow these steps on the monitored endpoint:
Note
You need root user privileges to execute all the commands described below.
1. Install Python and pip:
# apt install python3 python3-pip
2. Install Docker and the Python Docker Library to run the containers:
# curl -sSL https://get.docker.com/ | sh
# pip3 install docker==4.2.0
3. Enable the Wazuh agent to receive remote commands from the Wazuh server. By default, remote commands are disabled in agents for security reasons.
# echo "logcollector.remote_commands=1" >> /var/ossec/etc/local_internal_options.conf
4. Restart the Wazuh agent to apply the above changes:
# systemctl restart wazuh-agent
Wazuh server configuration
Follow these steps on the Wazuh server:
Note
You need root user privileges to execute all the commands described below.
1. Create a Wazuh agent group called container:
# /var/ossec/bin/agent_groups -a -g container -q
2. Obtain the ID of all Wazuh agents using the following command:
# /var/ossec/bin/manage_agents -l
3. Assign the Wazuh agent hosting the Docker containers to the container group. Multiple agents can be assigned to the group. This ensures all agents running Docker containers in your environment receive the same configuration.
Replace <AGENT_ID> with the agent’s ID of the endpoint hosting the Docker container.
# /var/ossec/bin/agent_groups -a -i <AGENT_ID> -g container -q
4. Add the following settings to the /var/ossec/etc/shared/container/agent.conf configuration file. This enables the Docker listener module and sets the commands to execute on the monitored endpoint for Docker container information gathering.
<agent_config>
  <!-- Configuration to enable Docker listener module. -->
  <wodle name="docker-listener">
    <interval>10m</interval>
    <attempts>5</attempts>
    <run_on_start>yes</run_on_start>
    <disabled>no</disabled>
  </wodle>

  <!-- Command to extract container resources information. -->
  <localfile>
    <log_format>command</log_format>
    <command>docker stats --format "{{.Container}} {{.Name}} {{.CPUPerc}} {{.MemUsage}} {{.MemPerc}} {{.NetIO}}" --no-stream</command>
    <alias>docker container stats</alias>
    <frequency>120</frequency>
    <out_format>$(timestamp) $(hostname) docker-container-resource: $(log)</out_format>
  </localfile>

  <!-- Command to extract container health information. -->
  <localfile>
    <log_format>command</log_format>
    <command>docker ps --format "{{.Image}} {{.Names}} {{.Status}}"</command>
    <alias>docker container ps</alias>
    <frequency>120</frequency>
    <out_format>$(timestamp) $(hostname) docker-container-health: $(log)</out_format>
  </localfile>
</agent_config>
Note
The <frequency> tag defines how often the command will be run in seconds. You can configure a value that suits your environment.
The commands to extract information configured above can get logs like in the following samples:
- Log for container resources:
Nov 2 14:11:38 ubuntu-2204 docker-container-resource: ossec: output: 'docker container stats': bbc95edda452 nginx-container 21.32% 3MiB / 1.931GiB 0.15% 1.44kB / 0B
- Log for container health:
Nov 1 13:47:12 ubuntu-2204 docker-container-health: ossec: output: 'docker container ps': nginx nginx-container Up 48 minutes (healthy)
5. Create a decoders file docker_decoders.xml in the /var/ossec/etc/decoders/ directory and add the following decoders to decode the logs received from the Wazuh agent:
<!-- Decoder for container resources information. -->
<decoder name="docker-container-resource">
  <program_name>^docker-container-resource</program_name>
</decoder>

<decoder name="docker-container-resource-child">
  <parent>docker-container-resource</parent>
  <prematch>ossec: output: 'docker container stats':</prematch>
  <regex>(\S+) (\S+) (\S+) (\S+) / (\S+) (\S+) (\S+) / (\S+)</regex>
  <order>container_id, container_name, container_cpu_usage, container_memory_usage, container_memory_limit, container_memory_perc, container_network_rx, container_network_tx</order>
</decoder>

<!-- Decoder for container health information. -->
<decoder name="docker-container-health">
  <program_name>^docker-container-health</program_name>
</decoder>

<decoder name="docker-container-health-child">
  <parent>docker-container-health</parent>
  <prematch>ossec: output: 'docker container ps':</prematch>
  <regex offset="after_prematch" type="pcre2">(\S+) (\S+) (.*?) \((.*?)\)</regex>
  <order>container_image, container_name, container_uptime, container_health_status</order>
</decoder>
Note
The custom decoder file docker_decoders.xml might be removed during an upgrade. Ensure to back up the file before you perform upgrades.
6. Create a rules file docker_rules.xml in the /var/ossec/etc/rules/ directory and add the following rules to alert the container information:
<group name="container,">
  <!-- Rule for container resources information. -->
  <rule id="100100" level="5">
    <decoded_as>docker-container-resource</decoded_as>
    <description>Docker: Container $(container_name) Resources</description>
    <group>container_resource,</group>
  </rule>

  <!-- Rule to trigger when container CPU and memory usage are above 80%. -->
  <rule id="100101" level="12">
    <if_sid>100100</if_sid>
    <field name="container_cpu_usage" type="pcre2">^(0*[8-9]\d|0*[1-9]\d{2,})</field>
    <field name="container_memory_perc" type="pcre2">^(0*[8-9]\d|0*[1-9]\d{2,})</field>
    <description>Docker: Container $(container_name) CPU usage ($(container_cpu_usage)) and memory usage ($(container_memory_perc)) is over 80%</description>
    <group>container_resource,</group>
  </rule>

  <!-- Rule to trigger when container CPU usage is above 80%. -->
  <rule id="100102" level="12">
    <if_sid>100100</if_sid>
    <field name="container_cpu_usage" type="pcre2">^(0*[8-9]\d|0*[1-9]\d{2,})</field>
    <description>Docker: Container $(container_name) CPU usage ($(container_cpu_usage)) is over 80%</description>
    <group>container_resource,</group>
  </rule>

  <!-- Rule to trigger when container memory usage is above 80%. -->
  <rule id="100103" level="12">
    <if_sid>100100</if_sid>
    <field name="container_memory_perc" type="pcre2">^(0*[8-9]\d|0*[1-9]\d{2,})</field>
    <description>Docker: Container $(container_name) memory usage ($(container_memory_perc)) is over 80%</description>
    <group>container_resource,</group>
  </rule>

  <!-- Rule for container health information. -->
  <rule id="100105" level="5">
    <decoded_as>docker-container-health</decoded_as>
    <description>Docker: Container $(container_name) is $(container_health_status)</description>
    <group>container_health,</group>
  </rule>

  <!-- Rule to trigger when a container is unhealthy. -->
  <rule id="100106" level="12">
    <if_sid>100105</if_sid>
    <field name="container_health_status">^unhealthy$</field>
    <description>Docker: Container $(container_name) is $(container_health_status)</description>
    <group>container_health,</group>
  </rule>
</group>
Note
The custom rules file docker_rules.xml might be removed during an upgrade. Ensure to back up the file before you perform upgrades.
7. Restart the Wazuh manager to apply the above changes:
# systemctl restart wazuh-manager
Testing the configuration
To showcase the use cases mentioned above, Nginx, Redis, and Postgres images are used to create a containerized environment on the monitored endpoint.
1. Create and switch into a project directory /container_env for the container environment using the following command:
$ mkdir container_env && cd $_
2. Create a Docker compose file docker-compose.yml and add the following configurations to it. The Docker compose file helps to manage multiple containers at once. The configuration performs the following Docker actions:
- Pulls Nginx, Redis, and Postgres container images from Docker Hub.
- Creates and starts
nginx-container,redis-container, andpostgres-containercontainers from the respective Docker images. - Creates and connects to a network called
container_env_network. - Creates and mounts volumes
container_env_dbandcontainer_env_cache. - Performs health checks on the created containers every three minutes.
version: '3.8'

services:
  db:
    image: postgres
    container_name: postgres-container
    restart: always
    environment:
      - POSTGRES_USER=postgres
      - POSTGRES_PASSWORD=postgres
    healthcheck:
      test: ["CMD-SHELL", "pg_isready"]
      interval: 3m
      timeout: 5s
      retries: 1
    ports:
      - '8001:5432'
    dns:
      - 8.8.8.8
      - 9.9.9.9
    volumes:
      - db:/var/lib/postgresql/data
    networks:
      - network
    mem_limit: "512M"

  cache:
    image: redis
    container_name: redis-container
    restart: always
    healthcheck:
      test: ["CMD", "redis-cli", "--raw", "incr", "ping"]
      interval: 3m
      timeout: 5s
      retries: 1
    ports:
      - '8002:6379'
    dns:
      - 8.8.8.8
      - 9.9.9.9
    volumes:
      - cache:/data
    networks:
      - network
    mem_limit: "512M"

  nginx:
    image: nginx
    container_name: nginx-container
    restart: always
    healthcheck:
      test: ["CMD-SHELL", "stat /etc/nginx/nginx.conf || exit 1"]
      interval: 3m
      timeout: 5s
      retries: 1
    ports:
      - '8003:80'
      - '4443:443'
    dns:
      - 8.8.8.8
      - 9.9.9.9
    networks:
      - network
    mem_limit: "512M"

volumes:
  db: {}
  cache: {}
networks:
  network:
3. Execute the following command in the path containing the docker-compose.yml file to create and start the containers:
$ sudo docker compose up -d
4. we use the stress-ng utility program to test for high CPU and memory utilization. Perform this test on one of the containers, for instance, the nginx-container.
- Execute the following commands to enter the container shell and install the stress-ng utility:
# docker exec -it nginx-container /bin/bash
# apt update && apt install stress-ng -y
- Execute the following command to trigger a high-level alert when both CPU and memory utilization exceeds 80%. The command runs for 3 minutes.
# stress-ng -c 1 -l 80 -vm 1 --vm-bytes 500m -t 3m
- Execute the following command to trigger a high-level alert when memory usage exceeds 80%. The command runs for 3 minutes.
# stress-ng -vm 1 --vm-bytes 500m -t 3m
- Execute the following command to trigger a high-level alert when CPU usage exceeds 80%. The command runs for 3 minutes.
# stress-ng -c 1 -l 80 -t 3m
5. The health check for the nginx-container verifies whether the configuration file /etc/nginx/nginx.conf exists. While inside the container shell, delete the configuration file to trigger a high-level alert when the container becomes unhealthy:
# rm /etc/nginx/nginx.conf
Alert visualization
Visualize the triggered alerts by visiting the Wazuh dashboard.
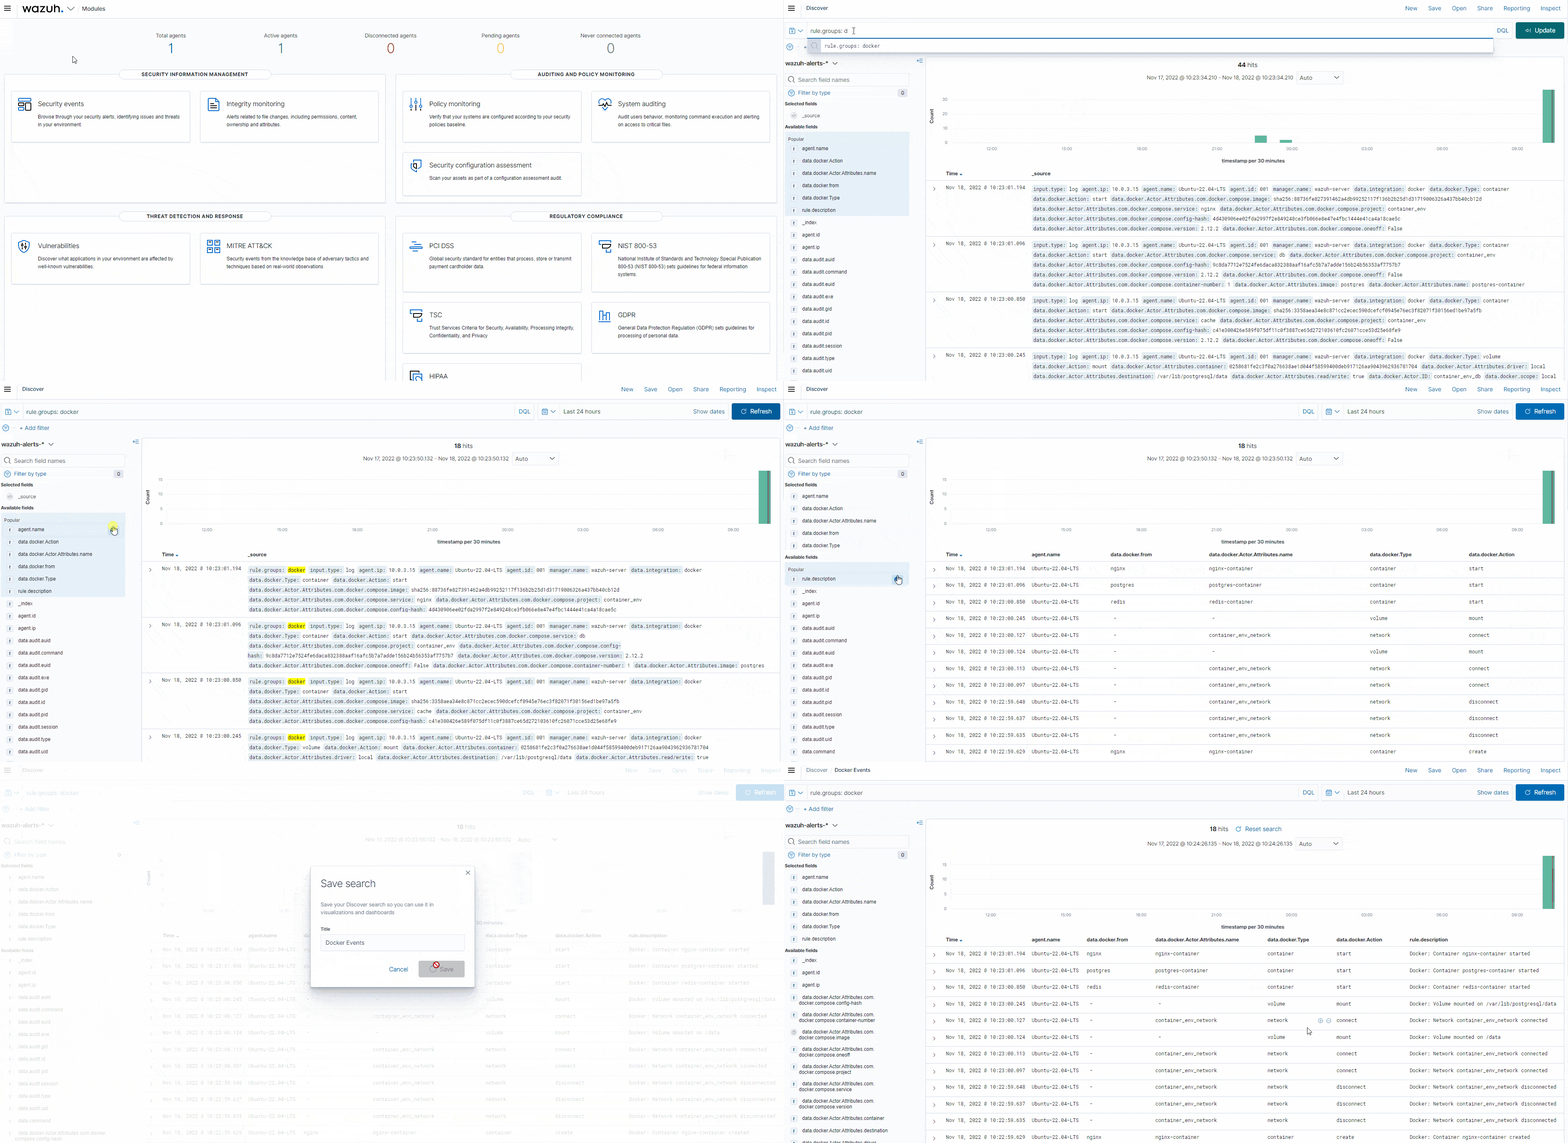
- Container actions alerts: Navigate to the Discover section and add the
rule.groups: dockerfilter in the search bar to query the alerts. Also, use the Filter by type search field and apply theagent.name,data.docker.from,data.docker.Actor.Attributes.name,data.docker.Type,data.docker.Action, andrule.description, filters. Save the query as Docker Events.

- Container resources alerts: Navigate to the Discover section and add the
rule.id: (100100 OR 100101 OR 100102 OR 100103)filter in the search bar to query the alerts. Also, use the Filter by type search field and apply theagent.name,data.container_name,data.container_cpu_usage,data.container_memory_usage,data.container_memory_limit,data.container_network_rx, anddata.container_network_txfilters. Save the query as Container Resources.

- Container health alerts: Navigate to the Discover section and add the
rule.id: (100105 OR 100106)filter in the search bar to query the alerts. Also, use the Filter by type search field and apply theagent.name,data.container_image,data.container_name,data.container_health_status, anddata.container_uptimefilters to show the status information. Save the query as Container Health.

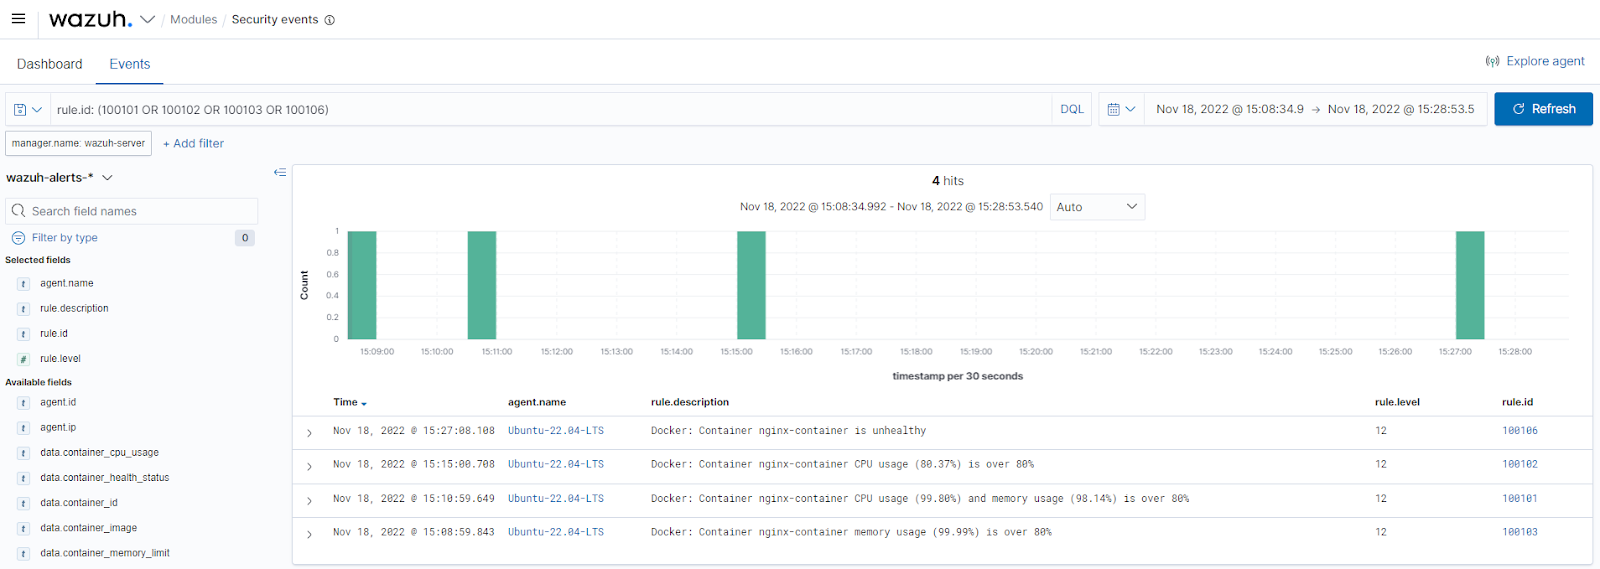
- Container threshold events: Navigate to the Wazuh > Security events section and add the
rule.id: (100101 OR 100102 OR 100103 OR 100106)filter in the search bar to query the alerts.

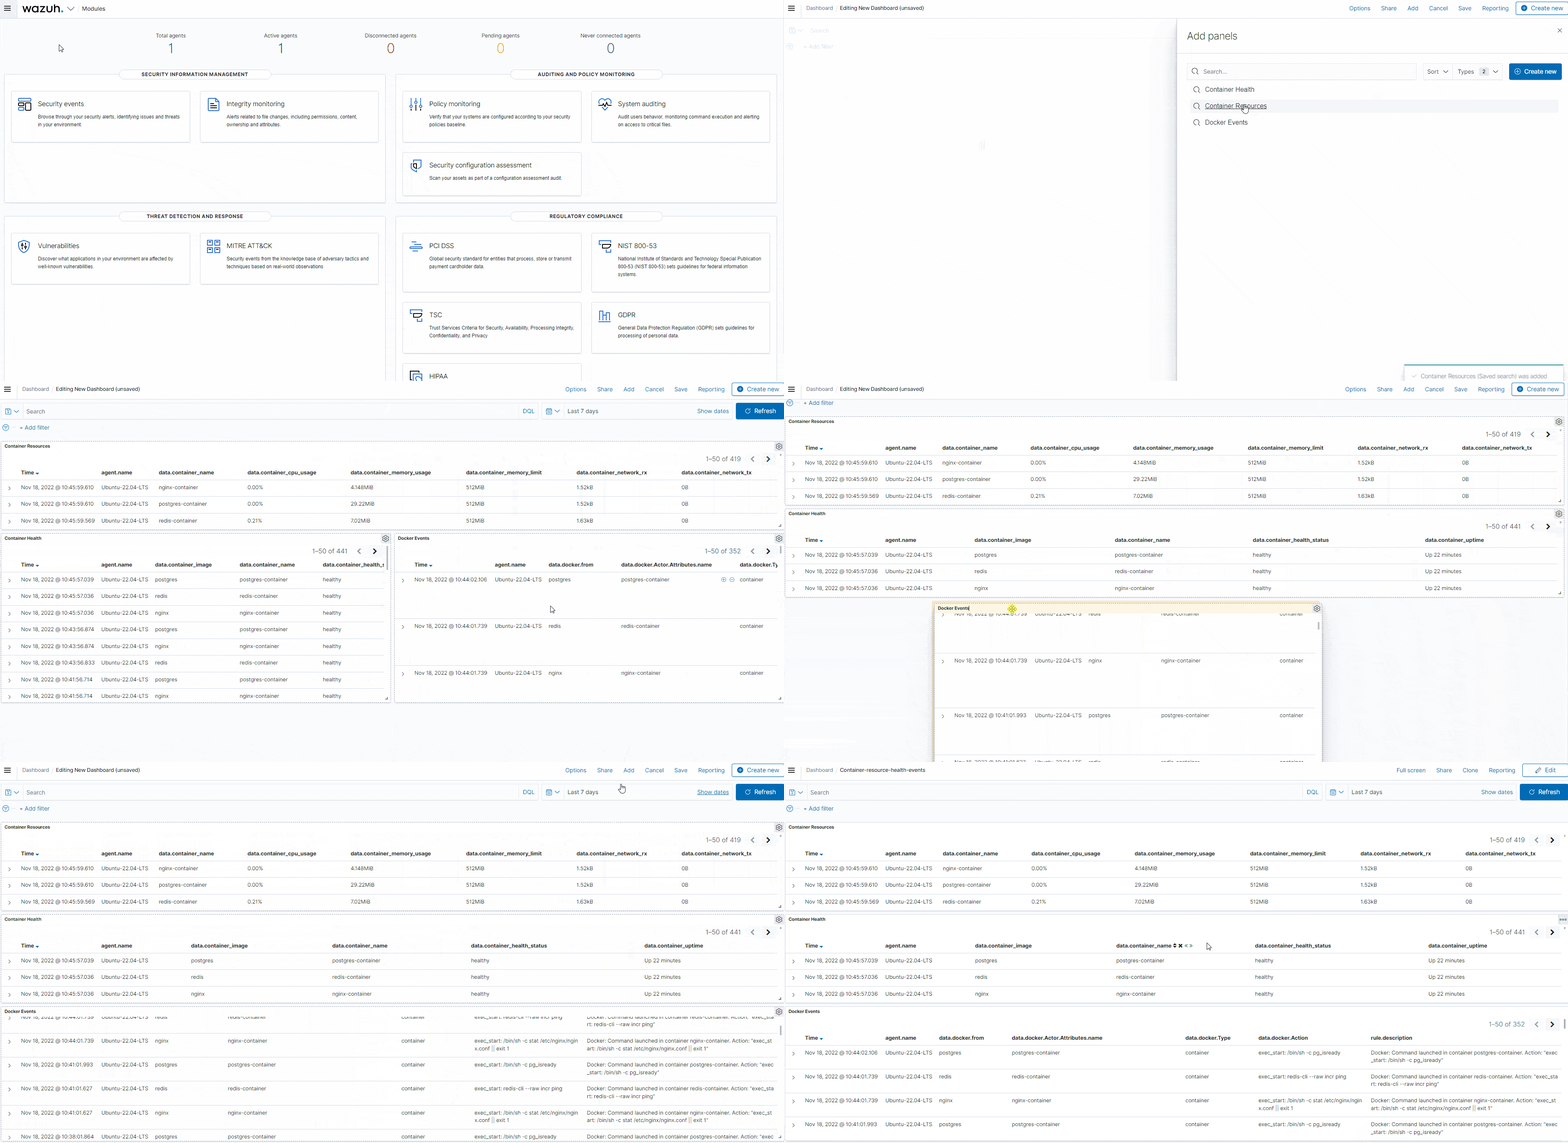
To have a single display of the visualizations, create a custom dashboard with the above templates. Navigate to OpenSearch Dashboards > Dashboard > Create New Dashboard, then select Add an existing link and click the saved visualizations (Docker Events, Container Resources, and Container Health). This will add the visualizations to the new dashboard. Save the dashboard as Container-resource-health-events.

Conclusion
High visibility of containers in Dockerized environments allows you to maintain a secure and efficient environment. This way, organizations can quickly identify and respond to issues and minimize disruptions. With Wazuh, we can spot abnormalities in containers, get an overview of their resource utilization, and easily analyze their health.
In this blog post, we ensured complete coverage of our Dockerized environment by monitoring Docker container events, resource utilization, and health to improve overall security.
