Integrating security solutions with your current infrastructure can extend security monitoring capabilities. Wazuh is an open source unified XDR and SIEM platform that offers compatibility and integration options with other indexing and visualization platforms, such as Elastic Stack. Integrating Wazuh and Elastic Stack enriches your security monitoring approach by providing the flexibility to manage and visualize data collected and analyzed by Wazuh in Elastic Stack.
For users who want to extend their security monitoring capabilities, integrating Wazuh and Elastic Stack can be a valuable addition. However, users can manage and visualize data independently with the Wazuh central components.
In this blog post, we configure the Wazuh server integration using Logstash. We also demonstrate a use case for integrating Wazuh and Elastic Stack and visualize the data in Kibana.
Infrastructure
- An Ubuntu 22.04 endpoint with the Wazuh server and indexer deployed (version 4.5.2). Refer to the Wazuh installation guide.
- An Ubuntu 22.04 endpoint with Elasticsearch and Kibana installed and configured. Refer to the following documentation to install and configure Elasticsearch and Kibana. Ensure both Elasticsearch and Kibana are the same version to avoid compatibility issues. We installed version 8.9 for this blog post.
Configure Wazuh server integration with Logstash
Perform the following steps on your Wazuh server.
Install Logstash
Install Logstash and the required plugin on the Wazuh server to forward security data in the /var/ossec/logs/alerts/alerts.json file to Elasticsearch.
1. Follow the Elastic documentation to install Logstash.
2. Run the following command to install the logstash-output-elasticsearch plugin. This plugin allows Logstash to write data into Elasticsearch.
$ sudo /usr/share/logstash/bin/logstash-plugin install logstash-output-elasticsearch
Note: In this blog post, we did not enable SSL verification. However, if you are using TLS with your Elasticsearch deployment, perform steps 3 and 4. Skip the steps if you are not using TLS.
3. Copy the Elasticsearch root certificate to the Wazuh server. In this blog post, we add it to the /etc/logstash/elasticsearch-certs directory.
4. Give the logstash user the necessary permissions to read the Elasticsearch root certificates:
$ sudo chmod -R 755 </PATH/TO/LOCAL/ELASTICSEARCH/CERTIFICATE>/root-ca.pem
Replace </PATH/TO/LOCAL/ELASTICSEARCH/CERTIFICATE>/root-ca.pem with your Elasticsearch certificate’s local path on the Wazuh server.
Configure new indices
Set up new indices, and define the mappings in Elasticsearch to ensure the data is stored and indexed correctly. Properly configuring mappings helps Elasticsearch understand your data and enables efficient searching and retrieval operations.
Use the logstash/es_template.json template to configure this index initialization for Elasticsearch.
Create a /etc/logstash/templates/ directory and download the template as wazuh.json using the following commands:
$ sudo mkdir /etc/logstash/templates
$ sudo curl -o /etc/logstash/templates/wazuh.json https://packages.wazuh.com/integrations/elastic/4.x-8.x/dashboards/wz-es-4.x-8.x-template.json
Configure a pipeline
Configure a Logstash pipeline that allows Logstash to use plugins to read data in the Wazuh /var/ossec/logs/alerts/alerts.json file and send it to Elasticsearch. The Logstash pipeline requires access to your Elasticsearch credentials.
We use the Logstash keystore to store these values securely.
1. Run the following commands on your Logstash server to set a keystore password:
Note: You need to create the /etc/sysconfig folder as root if it does not exist on your server.
$ set +o history
$ echo 'LOGSTASH_KEYSTORE_PASS="<MY_KEYSTORE_PASSWORD>"'| sudo tee /etc/sysconfig/logstash LOGSTASH_KEYSTORE_PASS="<MY_KEYSTORE_PASSWORD>"
$ export LOGSTASH_KEYSTORE_PASS=<MY_KEYSTORE_PASSWORD>
$ set -o history
$ sudo chown root /etc/sysconfig/logstash
$ sudo chmod 600 /etc/sysconfig/logstash
$ sudo systemctl start logstash
Replace <MY_KEYSTORE_PASSWORD> with your keystore password.
2. Run the following commands to store the Elasticsearch credentials securely.
a. Create a new Logstash keystore:
$ sudo -E /usr/share/logstash/bin/logstash-keystore --path.settings /etc/logstash create
b. Store your Elasticsearch username and password:
$ sudo -E /usr/share/logstash/bin/logstash-keystore --path.settings /etc/logstash add ELASTICSEARCH_USERNAME
$ sudo -E /usr/share/logstash/bin/logstash-keystore --path.settings /etc/logstash add ELASTICSEARCH_PASSWORD
Where ELASTICSEARCH_USERNAME and ELASTICSEARCH_PASSWORD are keys representing your Elasticsearch username and password, respectively.
Note: ELASTICSEARCH_USERNAME and ELASTICSEARCH_PASSWORD in the commands above are not placeholders but keys representing the secret values you are adding to the Logstash keystore. These keys will be used in the Logstash pipeline.
When you run each of the commands, you will be prompted to enter your credentials, and the credentials will not be visible as you enter them.
3. Perform the following steps to configure the Logstash pipeline.
a. Create the configuration file wazuh-elasticsearch.conf in /etc/logstash/conf.d/ folder:
$ sudo touch /etc/logstash/conf.d/wazuh-elasticsearch.conf
b. Add the following configuration to the wazuh-elasticsearch.conf file. This sets the parameters required to run Logstash.
input {
  file {
    id => "wazuh_alerts"
    codec => "json"
    start_position => "beginning"
    stat_interval => "1 second"
    path => "/var/ossec/logs/alerts/alerts.json"
    mode => "tail"
    ecs_compatibility => "disabled"
  }
}

output {
    elasticsearch {
         hosts => "<ELASTICSEARCH_ADDRESS>"
         index  => "wazuh-alerts-4.x-%{+YYYY.MM.dd}"
         user => '${ELASTICSEARCH_USERNAME}'
         password => '${ELASTICSEARCH_PASSWORD}'
         ssl => true
         ssl_certificate_verification => false
         template => "/etc/logstash/templates/wazuh.json"
         template_name => "wazuh"
         template_overwrite => true
	}
}
Where <ELASTICSEARCH_ADDRESS> is your Elasticsearch IP address.
Note: In this blog post, we did not enable SSL verification. If you have enabled SSL verification, replace ssl_certificate_verification => false with cacert => "/PATH/TO/LOCAL/ELASTICSEARCH/root-ca.pem".
4. By default, the /var/ossec/logs/alerts/alerts.json file is owned by the wazuh user with restrictive permissions. You must add the logstash user to the wazuh group so it can read the file when running Logstash as a service:
$ sudo usermod -a -G wazuh logstash
Verify the Logstash configuration
Next, perform the following steps to confirm that the configurations load correctly.
1. Run Logstash from the CLI with your configuration:
$ sudo systemctl stop logstash
$ sudo -E /usr/share/logstash/bin/logstash -f /etc/logstash/conf.d/wazuh-elasticsearch.conf --path.settings /etc/logstash/
Note: Use your own paths for the executable, the pipeline, and the configuration files. Ensure that the Wazuh server RESTful API port (55000) is open on your Wazuh server.
2. After confirming that the configuration loads correctly without errors, cancel the command and run Logstash as a service. This way, Logstash is not dependent on the lifecycle of the terminal it’s running on. Enable and run Logstash as a service using the following commands:
$ sudo systemctl enable logstash.service
$ sudo systemctl start logstash.service
Note: Any data indexed before the configuration is complete will not be forwarded to Elasticsearch.
The /var/log/logstash/logstash-plain.log file in the Logstash instance stores events generated when Logstash runs. View this file in case you need to troubleshoot.
Configure the Wazuh alerts index patterns in Elastic Stack
Perform the following steps in Kibana to create the index pattern name for the Wazuh alerts.
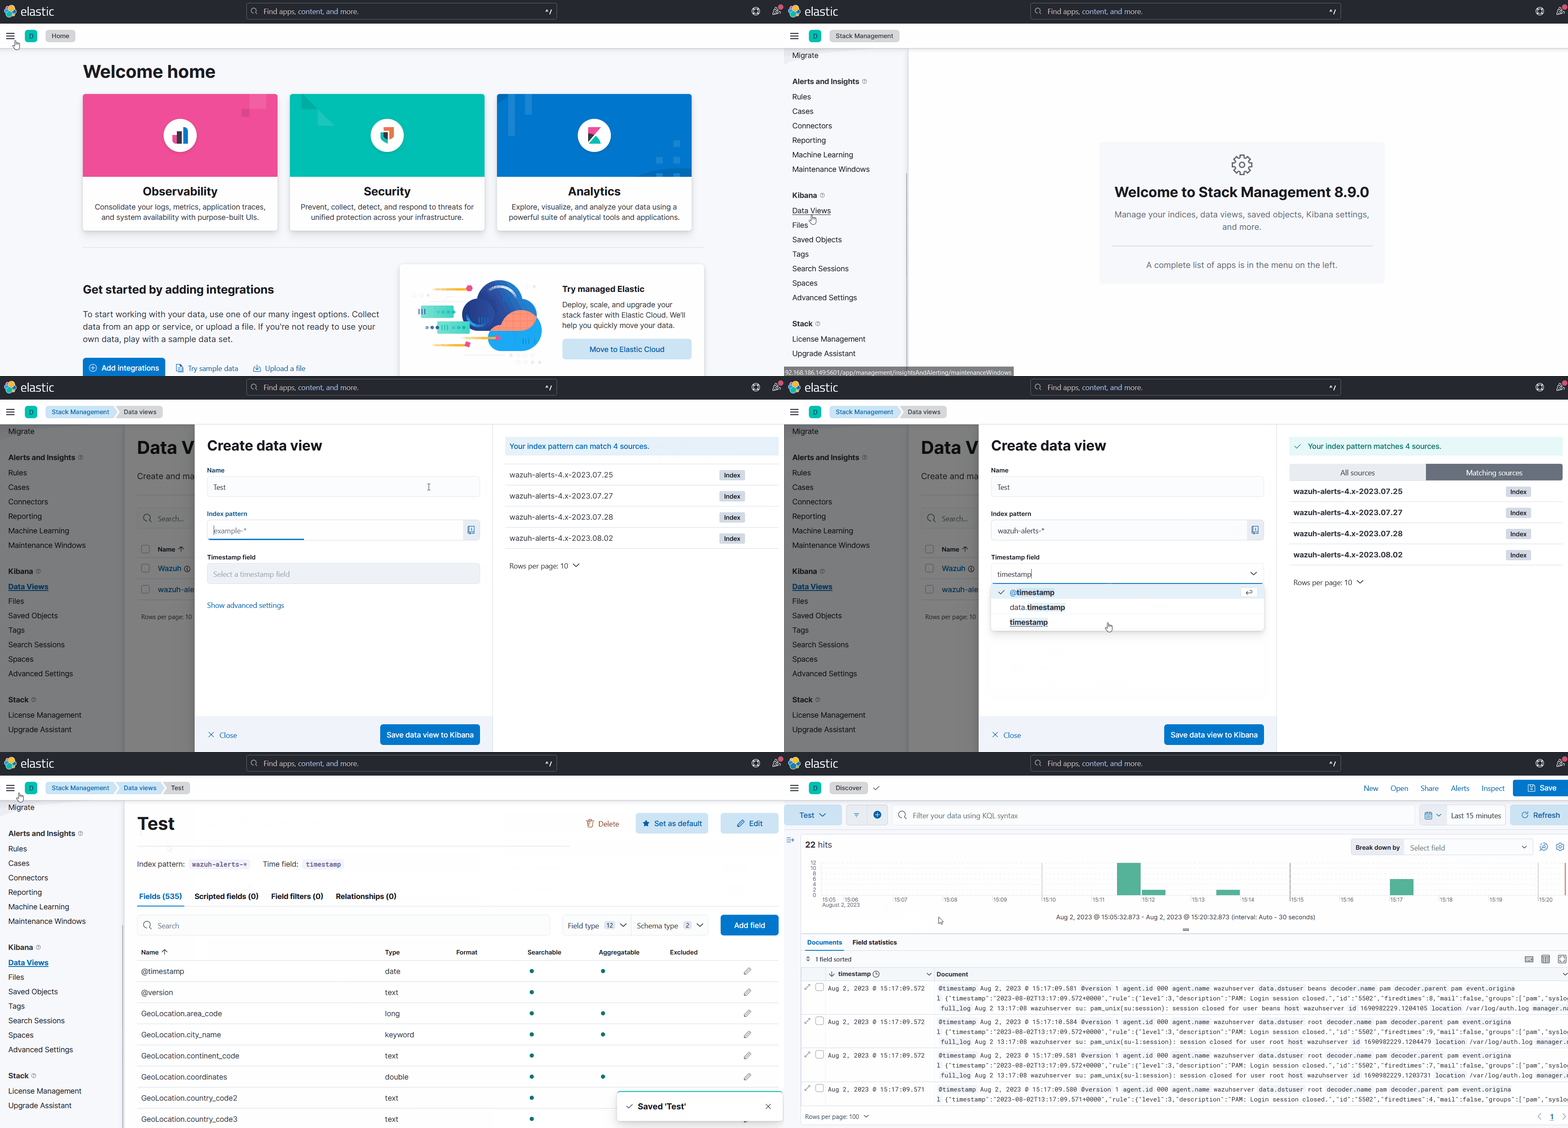
1. Select ☰ > Management > Stack Management.
2. Choose Kibana > Data Views and select Create data view.
3. Enter a name for the data view and define wazuh-alerts-* as the index pattern name.
4. Select timestamp in the Timestamp fields dropdown menu. Then Save data view to Kibana.
5. Open the menu and select Discover under Analytics.6. Select ☰ > Analytics > Discover.
Verify the integration
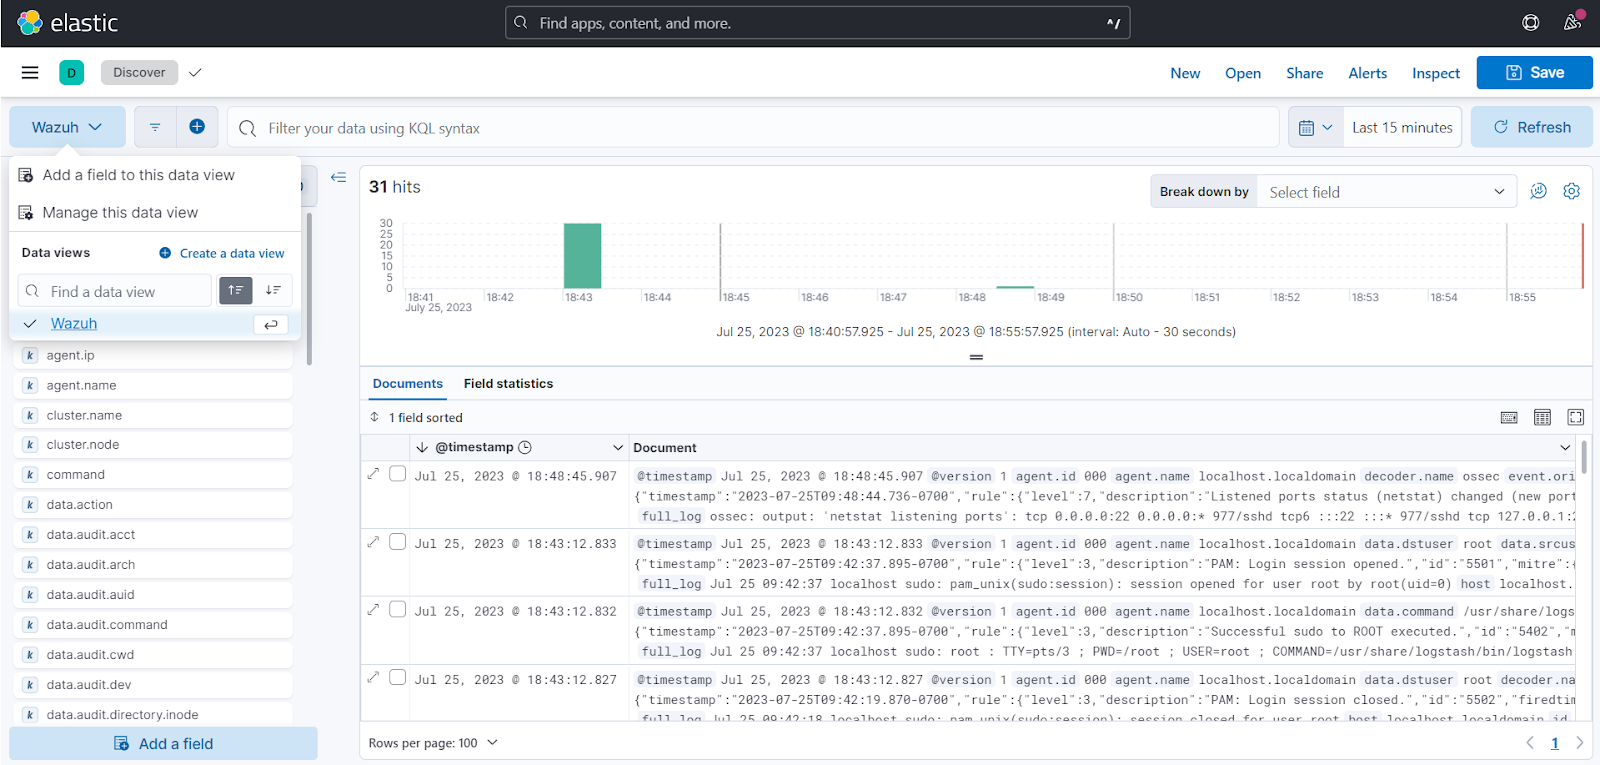
To check the integration with Elasticsearch, navigate to Discover in Kibana. Verify that you can find the Wazuh security data with the data view name you entered.
Elastic Stack dashboards
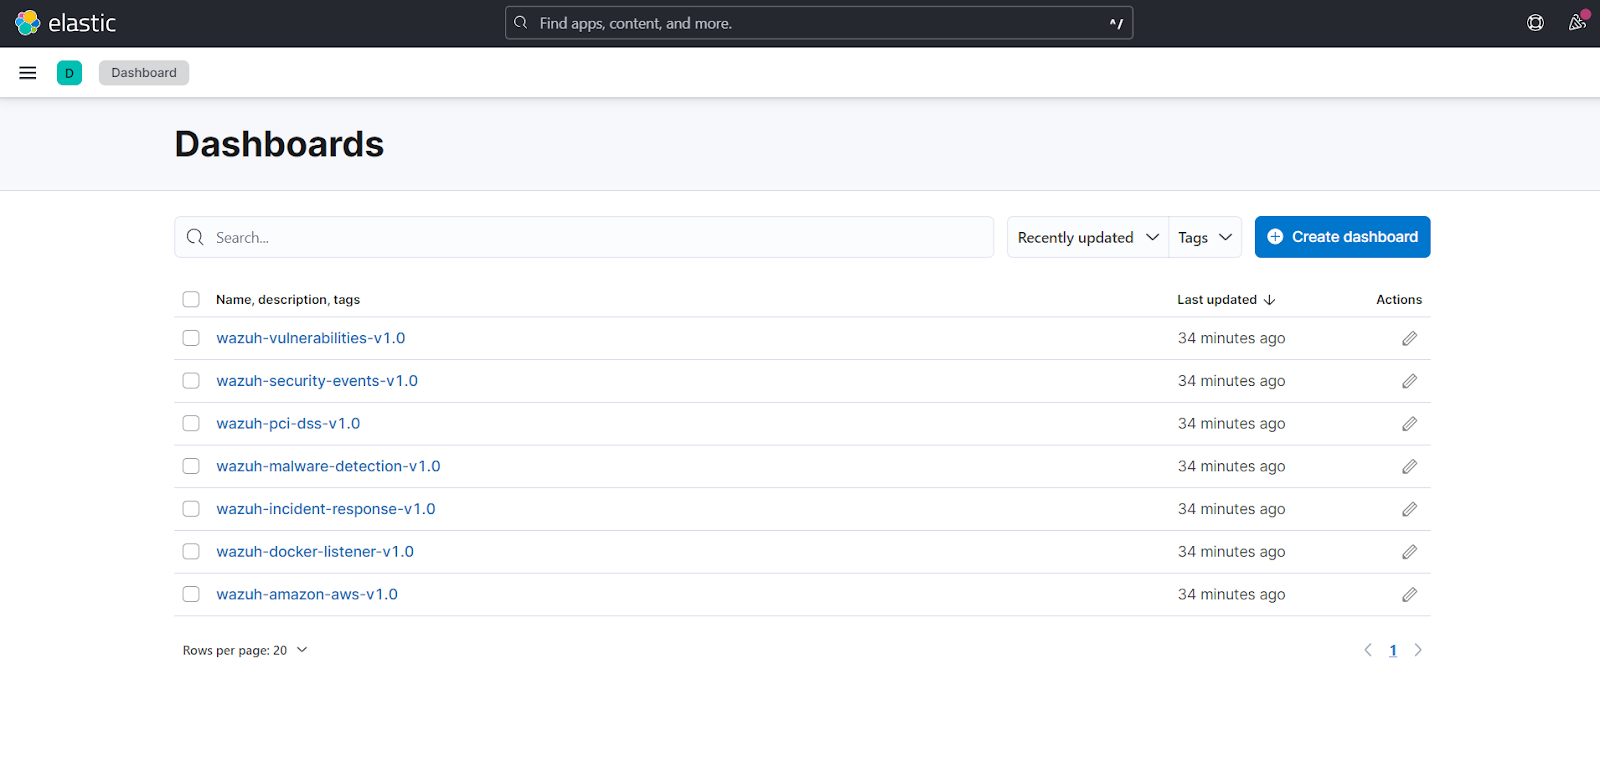
Wazuh provides several dashboards for Elastic Stack. These dashboards display Wazuh alerts in Kibana after you have performed the Elasticsearch integration. You can learn more about how to import the provided Elastic Stack dashboards.
Use case: Regulatory compliance (PCI DSS)
We can perform further analysis on Kibana when Wazuh data is ingested into Elasticsearch. We can create filters to retrieve useful information and visualize the data.
PCI DSS (Payment Card Industry Data Security Standard) outlines the security criteria that businesses that process, store, and transmit card data must adhere to. One of the critical mandates of PCI DSS is to perform regular scans to detect the storage of plaintext Primary Account Number (PAN) information.
We use the Wazuh command monitoring capability to search for plaintext credit card PANs and generate logs which the Wazuh agent sends to the Wazuh server. We then use a custom rule on the Wazuh server to analyze the logs and generate alerts.
When alerts are generated, Logstash sends the analyzed data to Elasticsearch and we visualize the alerts in Kibana.
Requirements
- A Windows 10 endpoint with Wazuh agent 4.5.2 installed and enrolled to the Wazuh server. To install the Wazuh agent, refer to the Wazuh agent installation guide.
On the Windows endpoint
1. Append the configuration below to the Wazuh agent C:\Program Files (x86)\ossec-agent\ossec.conf configuration file on the Windows 10 endpoint. This configuration checks files on the monitored endpoint to detect MasterCard PANs stored in plaintext:
<ossec_config>
  <!-- Check for MasterCard PAN -->
  <localfile>
    <log_format>full_command</log_format>
    <command>powershell -c "Get-ChildItem -Path 'C:\Users\*' -Recurse -Exclude *.dll,*.exe,*.jpg,*.png,*jpeg,*.sys,*.msi,*.dat | Select-String '(\D|^)5[1-5][0-9]{2}(\ |\-|)[0-9]{4}(\ |\-|)[0-9]{4}(\ |\-|)[0-9]{4}(\D|$)' | Select-Object -Unique path -EV Err -EA SilentlyContinue"</command>
    <alias>PAN scan</alias>
    <frequency>86400</frequency>
  </localfile>
</ossec_config>
2. Launch PowerShell with administrative privileges and restart the Wazuh agent for the changes to take effect:
> Restart-Service -Name wazuh
On the Wazuh server
1. Add the following rule to the Wazuh server /var/ossec/etc/rules/local_rules.xml file to generate an alert when a file contains plaintext PAN:
<group name="PCIDSS">
  <!-- This rule generates an alert when a file is found to contain unmasked card PAN data. -->
  <rule id="100010" level="6">
    <if_sid>530</if_sid>
    <match>^ossec: output: 'PAN scan'</match>
    <description>Unmasked Card PAN discovered.</description>
    <group>pci_dss_3.5.1</group>
  </rule>
</group>
2. Restart the Wazuh manager to apply the changes:
$ sudo systemctl restart wazuh-manager
Refer to the blog post on Conducting primary account number scan with Wazuh for more information.
Testing the configuration to detect plaintext PAN
We test the configuration by creating files containing sample plaintext PAN data on the Windows endpoint. An alert is triggered when unmasked PANs are detected.
1. Create a file sensitivePAN.txt in the Documents folder and add the following sample plaintext PANs:
5377845985135687
4877596126894321
2. Create a file carddata.txt in the Documents folder and add the following sample plaintext PANs:
5411111111111115
5344147874125367
3. The scan runs once every 86400 seconds (24 hours). To get an instantaneous result, trigger the scan by restarting the Wazuh agent service:
> Restart-Service -Name wazuh
Visualizing the alerts in Kibana
Perform the following steps in Kibana to visualize the alerts:
1. Navigate to ☰ > Analytics > Discover in Kibana.
2. Change the data view you created earlier. We use ‘Wazuh’.
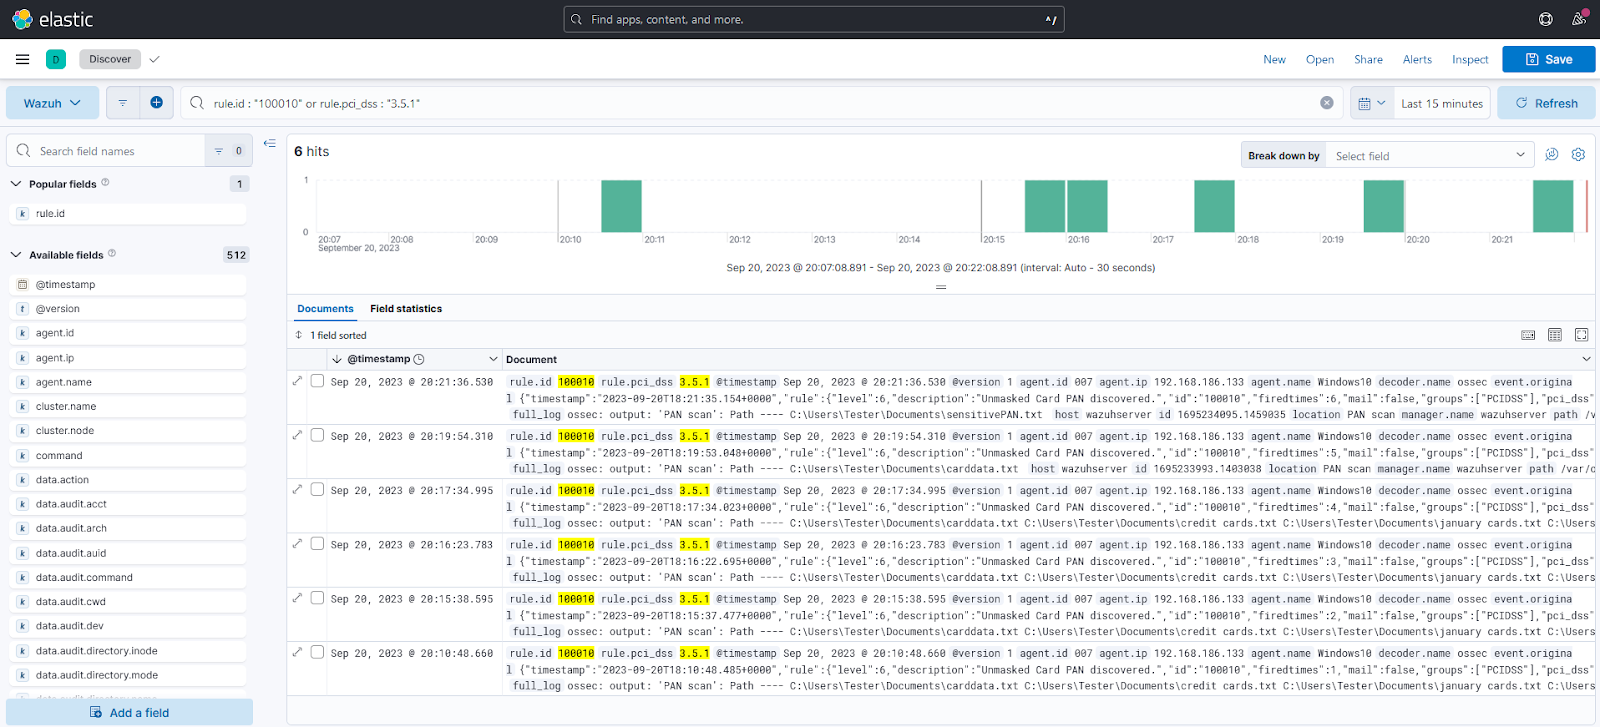
3. Apply a filter for rule.id : "100010" or rule.pci_dss : "3.5.1".
The alerts triggered are displayed as shown below:
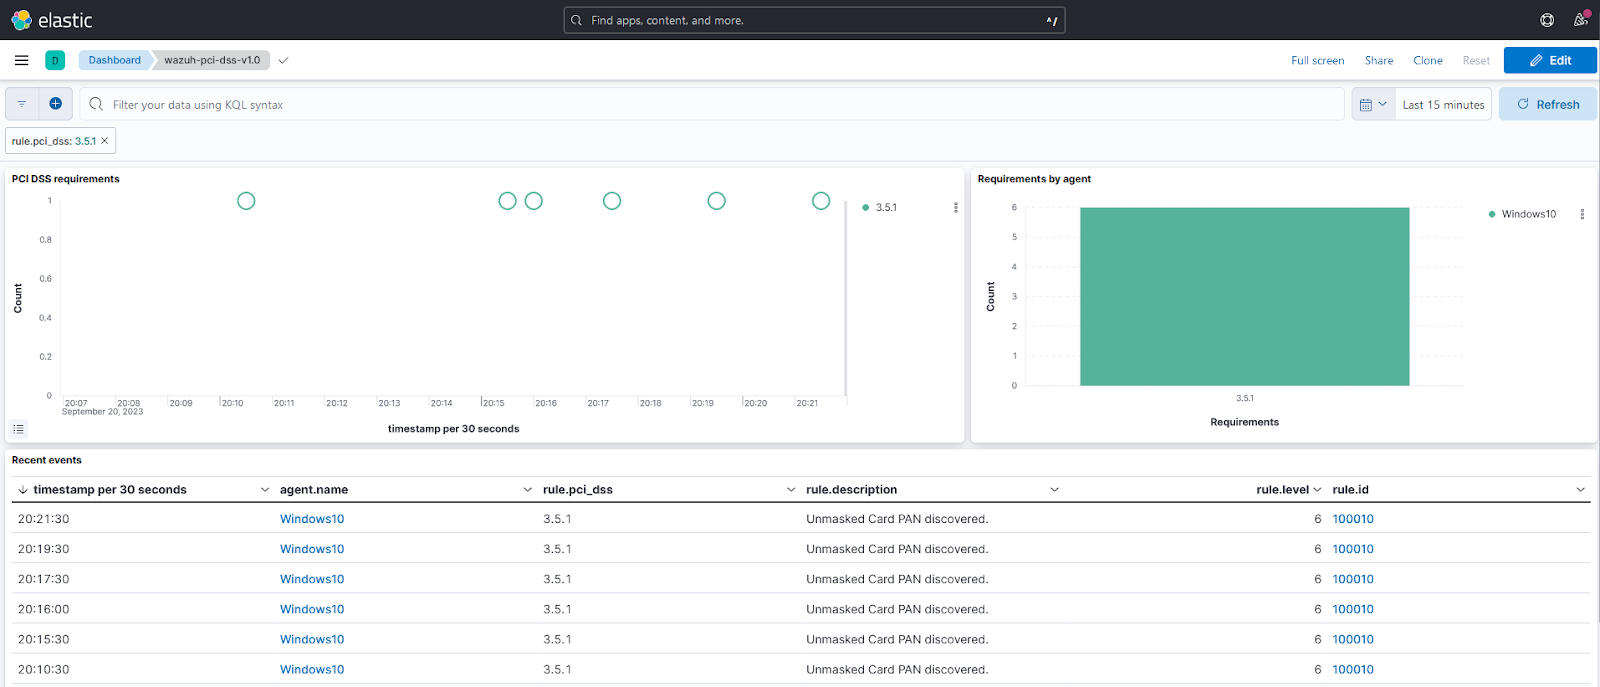
Wazuh PCI DSS dashboard
The image below shows PCI DSS alerts displayed on the Wazuh PCI DSS dashboard for Elastic Stack in Kibana:
Conclusion
In this blog post, we configure the Wazuh server integration with Logstash for Elastic Stack. We demonstrate a use case for integrating Wazuh and Elastic Stack by carrying out scans for PANs to meet PCI DSS requirements and visualize the data analyzed by Wazuh in Kibana.
We also provide the Wazuh indexer integration using Logstash to integrate the Wazuh indexer with Elastic Stack. Refer to the documentation for each method to determine which suits your particular requirements and infrastructure.
References
