ESET PROTECT Hub allows administrators to manage identities, licenses, and users across various ESET services from a single location. These services, including ESET PROTECT, ESET Inspect, and ESET Cloud Office Security, are designed to provide threat detection and endpoint protection solutions for businesses and individuals.
Wazuh is an open source security platform designed for threat detection, compliance monitoring, and incident response across diverse environments, including on-premises, cloud, and hybrid infrastructures. Its open source nature allows users to build and extend integrations that meet their specific security needs.
Integrating ESET PROTECT Hub with Wazuh enables users to directly ingest detection data from the ESET services into their Wazuh instance, enabling centralized monitoring, and threat correlation. Wazuh collects detection data from ESET at custom intervals, improving visibility across endpoints, servers, and cloud environments. Custom rules in Wazuh allow teams to trigger alerts, notifications, or automated actions based on incoming ESET events, supporting efficient incident response workflows.
This blog post shows how to integrate ESET PROTECT Hub with Wazuh.
Requirements
We use the following infrastructure to demonstrate the integration of ESET PROTECT Hub with Wazuh:
- A pre-built, ready-to-use Wazuh OVA 4.12.0 that hosts the Wazuh central components (Wazuh server, Wazuh indexer, and Wazuh dashboard). Follow this guide to download the virtual machine.
- An ESET Connect API user account.
- A Windows 11 endpoint with the ESET endpoint protection tool downloaded from the ESET Connect API user account. This is the monitored endpoint against threats.
- An Ubuntu 24 endpoint to simulate attacks against the monitored endpoint.
Configuring the integration
Perform the steps below on the Wazuh server with root privileges.
- Download the ESET PROTECT Hub and Wazuh integration detection rules:
# curl -o /var/ossec/etc/rules/eset_local_rules.xml https://raw.githubusercontent.com/eset/ESET-Integration-Wazuh/69ec85343541f1f8d435028a0120ab49066f0826/eset_local_rules.xml
- Create an
eset_integration.logfile in the/var/log/directory to store the ESET events pulled by the integration:
# touch /var/log/eset_integration.log
- Edit the
/var/ossec/etc/ossec.conffile and append the settings below to configure Wazuh to monitor the ESET log file/var/log/eset_integration.log:
<ossec_config>

<!--Configuration of other local files -->

  <localfile>
    <log_format>json</log_format>
    <location>/var/log/eset_integration.log</location>
  </localfile>

</ossec_config>
- Restart the Wazuh manager service to apply the changes:
# systemctl restart wazuh-manager
- Create a new directory
eset_integrationin the/optdirectory:
# mkdir /opt/eset_integration
- Create an empty
/opt/eset_integration/last_detection_time.ymlfile to store and track the time of occurrence of the last events. This is to ensure the script always pulls the most recent events since the last pull.
# touch /opt/eset_integration/last_detection_time.yml
- Create an
eset_integration.pyscript in the/opt/eset_integrationdirectory:
import json
import logging
import os
import time
import tzlocal  # pip install tzlocal
import requests
import yaml
from datetime import datetime, timedelta, timezone
from pathlib import Path
from dateutil.parser import isoparse
from dateutil import parser
from dotenv import load_dotenv

# === Configuration ===

load_dotenv()
USERNAME = os.getenv("USERNAME_INTEGRATION")
PASSWORD = os.getenv("PASSWORD_INTEGRATION")
INSTANCE_REGION = os.getenv("INSTANCE_REGION").lower()
IAM_URL = f"https://{INSTANCE_REGION}.business-account.iam.eset.systems/oauth/token"
API_BASE = f"https://{INSTANCE_REGION}.incident-management.eset.systems"
OUTPUT_FILE = "/var/log/eset_integration.log"
INTERVAL = int(os.getenv("INTERVAL", "3"))  # in minutes
LAST_TIME_FILE = "/opt/eset_integration/last_detection_time.yml"
DATA_SOURCE = "EP"  # Event type key

# === Last Time Handling ===

def load_last_detection_time() -> str:
    try:
        with open(LAST_TIME_FILE, "rb") as f:
            ldt = yaml.safe_load(f)
            if ldt is None:
                ldt = {}
    except FileNotFoundError:
        ldt = {}

    last_time = ldt.get(DATA_SOURCE)
    if not last_time:
        return (
            datetime.now(timezone.utc) - timedelta(minutes=30)
        ).isoformat(timespec='milliseconds').replace("+00:00", "Z")
    return last_time

def save_last_detection_time(new_time: str) -> None:
    try:
        with open(LAST_TIME_FILE, "rb") as f:
            ldt = yaml.safe_load(f)
            if ldt is None:
                ldt = {}
    except FileNotFoundError:
        ldt = {}

    # Parse the UTC time string
    utc_dt = parser.isoparse(new_time)

    # Convert to local system time zone
    local_tz = tzlocal.get_localzone()
    local_dt = utc_dt.astimezone(local_tz)

    # Format back to ISO 8601 with 'Z' removed, because it's no longer UTC
    formatted_local_time = local_dt.isoformat(timespec='milliseconds')

    ldt[DATA_SOURCE] = formatted_local_time
    with open(LAST_TIME_FILE, "w") as f:
        yaml.safe_dump(ldt, f)
# === Main Logic ===

def fetch_and_save_detections():
    try:
        # 1. Get Access Token
        token_data = {
            "grant_type": "password",
            "username": USERNAME,
            "password": PASSWORD,
            "refresh_token": ""
        }
        headers = {
            "Accept": "application/json",
            "Content-Type": "application/x-www-form-urlencoded"
        }
        logging.info("Requesting access token...")
        response = requests.post(IAM_URL, data=token_data, headers=headers)
        response.raise_for_status()
        access_token = response.json().get("access_token")
        if not access_token:
            raise Exception("Failed to obtain access token")

        # 2. Fetch Detections
        start_time = load_last_detection_time()
        api_headers = {"Authorization": f"Bearer {access_token}"}
        detections_url = f"{API_BASE}/v1/detections"
        params = {"startTime": start_time}
        logging.info(f"Fetching detections from {start_time}...")

        detections_resp = requests.get(detections_url, headers=api_headers, params=params)

        if detections_resp.status_code != 200:
            logging.error(f"API response: {detections_resp.status_code} - {detections_resp.text}")
        detections_resp.raise_for_status()

        detections = detections_resp.json().get("detections", [])
        if not detections:
            logging.info("No new detections found.")
            return

        # 3. Save each detection to the log file
        with open(OUTPUT_FILE, "a") as f:
            for detection in detections:
                detection["providerName"] = "ESET"
                wrapped = {"eset": detection}
                f.write(json.dumps(wrapped) + "\n")

        logging.info(f"{len(detections)} detections saved.")

        # 4. Update last detection time
        detect_times = [isoparse(d["occurTime"]) for d in detections if d.get("occurTime")]
        if detect_times:
            newest_time = (max(detect_times) + timedelta(seconds=1)).isoformat().replace("+00:00", "Z")
            save_last_detection_time(newest_time)
            logging.info(f"Updated last detection time to {newest_time}.")
        else:
            logging.warning("No valid occurTime found in detections.")

    except Exception as e:
        logging.error(f"Error: {e}", exc_info=True)


# === Runner ===

def main_loop():
    logging.basicConfig(
        format="%(asctime)s - %(levelname)s - %(message)s",
        level=logging.INFO,
        datefmt="%Y-%m-%d %H:%M:%S"
    )

    logging.info("Starting ESET event fetcher.")
    while True:
        fetch_and_save_detections()
        time.sleep(INTERVAL * 60)

if __name__ == "__main__":
    main_loop()
The original script was obtained from bayuski labs and customized to suit our implementation. This script periodically retrieves threat detection events, wraps each in a standardized JSON format, and appends them to the /var/log/eset_integration.log file.
Note
The INTERVAL is set to 300 seconds. You can set it to any value suitable for your requirements.
- Install the Python modules required to run the script:
# pip install requests pyyaml python-dotenv python-dateutil tzlocal
- Create a
.envfile in the/opt/eset_integrationdirectory to store the integration variables:
USERNAME_INTEGRATION=<USERNAME_INTEGRATION>
PASSWORD_INTEGRATION=<PASSWORD_INTEGRATION>
INSTANCE_REGION=<INSTANCE_REGION>
Replace:
<USERNAME_INTEGRATION>with the ESET Connect API user login username or email address.<PASSWORD_INTEGRATION>with the ESET Connect API user password.<INSTANCE_REGION>with the location of your ESET PROTECT, ESET Inspect, or ESET Cloud Office Security instance. The allowed options areca, de, eu, jpn, us.
- Run the following command to make the
/opt/eset_integration/eset_integration.pyscript executable:
# chmod +x /opt/eset_integration/eset_integration.py
- Create the
/etc/systemd/system/eset_integration.serviceSystemD service file to run the integration script as a daemon:
[Unit]
Description=ESET Detection Fetcher Daemon
After=network.target

[Service]
Restart=always
RestartSec=10
ExecStart=/usr/bin/python3 /opt/eset_integration/eset_integration.py
WorkingDirectory=/opt/eset_integration/
User=root
Group=root
StandardOutput=append:/var/log/eset_integration.out.log
StandardError=append:/var/log/eset_integration.err.log

[Install]
WantedBy=multi-user.target
Note
The file /var/log/eset_integration.err.log stores the service logs and can be used for troubleshooting purposes.
- Start and enable the service to execute the script on startup:
# systemctl daemon-reload
# systemctl enable eset_integration.service
# systemctl start eset_integration.service
Testing the integration
To ensure the integration works as expected, we perform the following tests:
Brute-force attempt
We simulate a brute-force attack against the monitored Windows endpoint using Hydra.
Attack emulation
Perform the steps below on the attacking endpoint to simulate authentication failure attempts on the monitored system.
- Install Hydra and use it to execute the brute-force attack:
# apt update
# apt install -y hydra
- Create a text file
passwords.txtwith 10 random passwords:
# for i in {1..10}; do openssl rand -base64 12 >> passwords.txt; done
- Run the following command to execute brute-force attacks against the Windows endpoint, replacing
<WINDOWS_IP>with the IP address of the Windows endpoint:
# hydra -l trudy -P password.txt rdp://<WINDOWS_IP>
- Check the
/var/log/eset_integration.logfile on the Wazuh server for any new entries related to the simulated brute-force attack to confirm the integration:
{
  "eset": {
    "uuid": "6182ead6-bb16-9742-1bb8-f1f9651077bc",
    "typeName": "",
    "category": "DETECTION_CATEGORY_FIREWALL_RULE",
    "displayName": "RDP.Attack.Bruteforce",
    "objectName": "192.168.0.115->192.168.0.115:3389",
    "objectTypeName": "",
    "objectHashSha1": "55EFB424933087D755B18468BC574DB4463D9CE6",
    "objectUrl": "",
    "context": {
      "userName": "NT AUTHORITY\\NETWORK SERVICE",
      "process": {
        "path": "C:\\Windows\\System32\\svchost.exe"
      },
      "deviceUuid": "97e08510-deef-48b9-8e8f-bd011863d6f6",
      "circumstances": ""
    },
    "severityLevel": "SEVERITY_LEVEL_MEDIUM",
    "occurTime": "2025-06-03T01:41:58Z",
    "networkCommunication": {
      "localIpAddress": "192.168.0.115",
      "remoteIpAddress": "192.168.0.115",
      "localPort": 3389,
      "remotePort": 0,
      "direction": "NETWORK_COMMUNICATION_DIRECTION_INBOUND",
      "protocolName": "TCP"
    },
    "responses": [],
    "providerName": "ESET"
  }
}
Detection results
Follow the steps below to view the alerts generated on the Wazuh dashboard once the attack attempt is completed.
- Navigate to Threat intelligence > Threat Hunting, and click the Events tab.
- Click + Add filter. Then filter by
rule.groups. - In the Operator field, select
is. - Search and select
esetin the Values field. - Click Save.
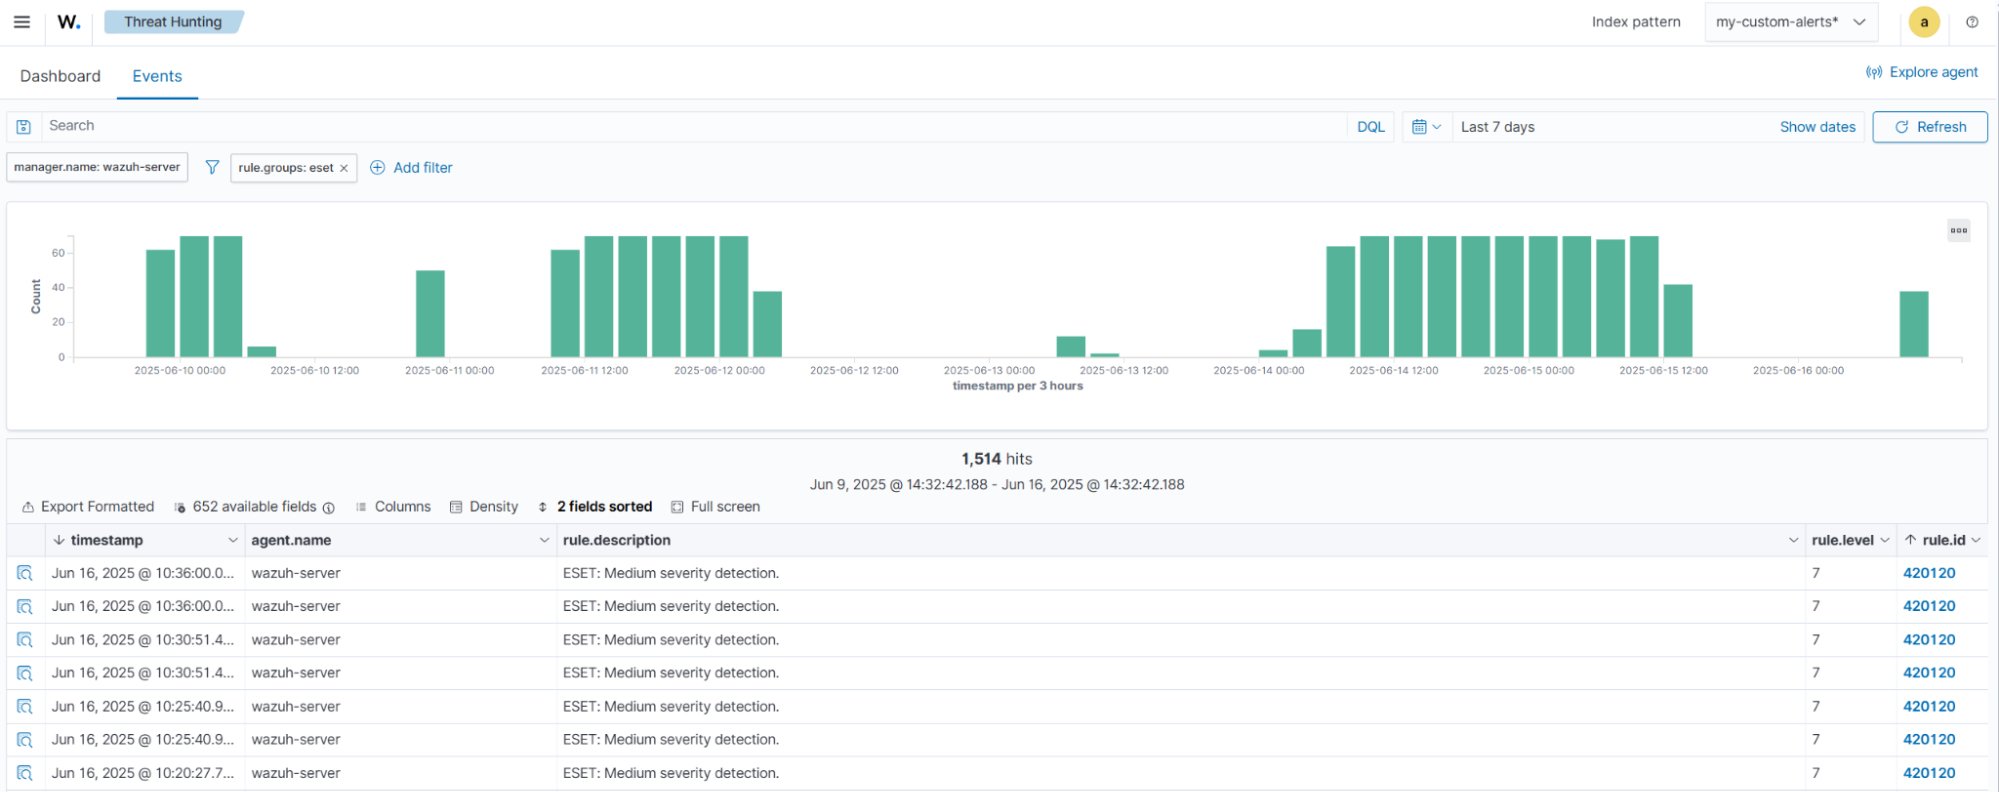
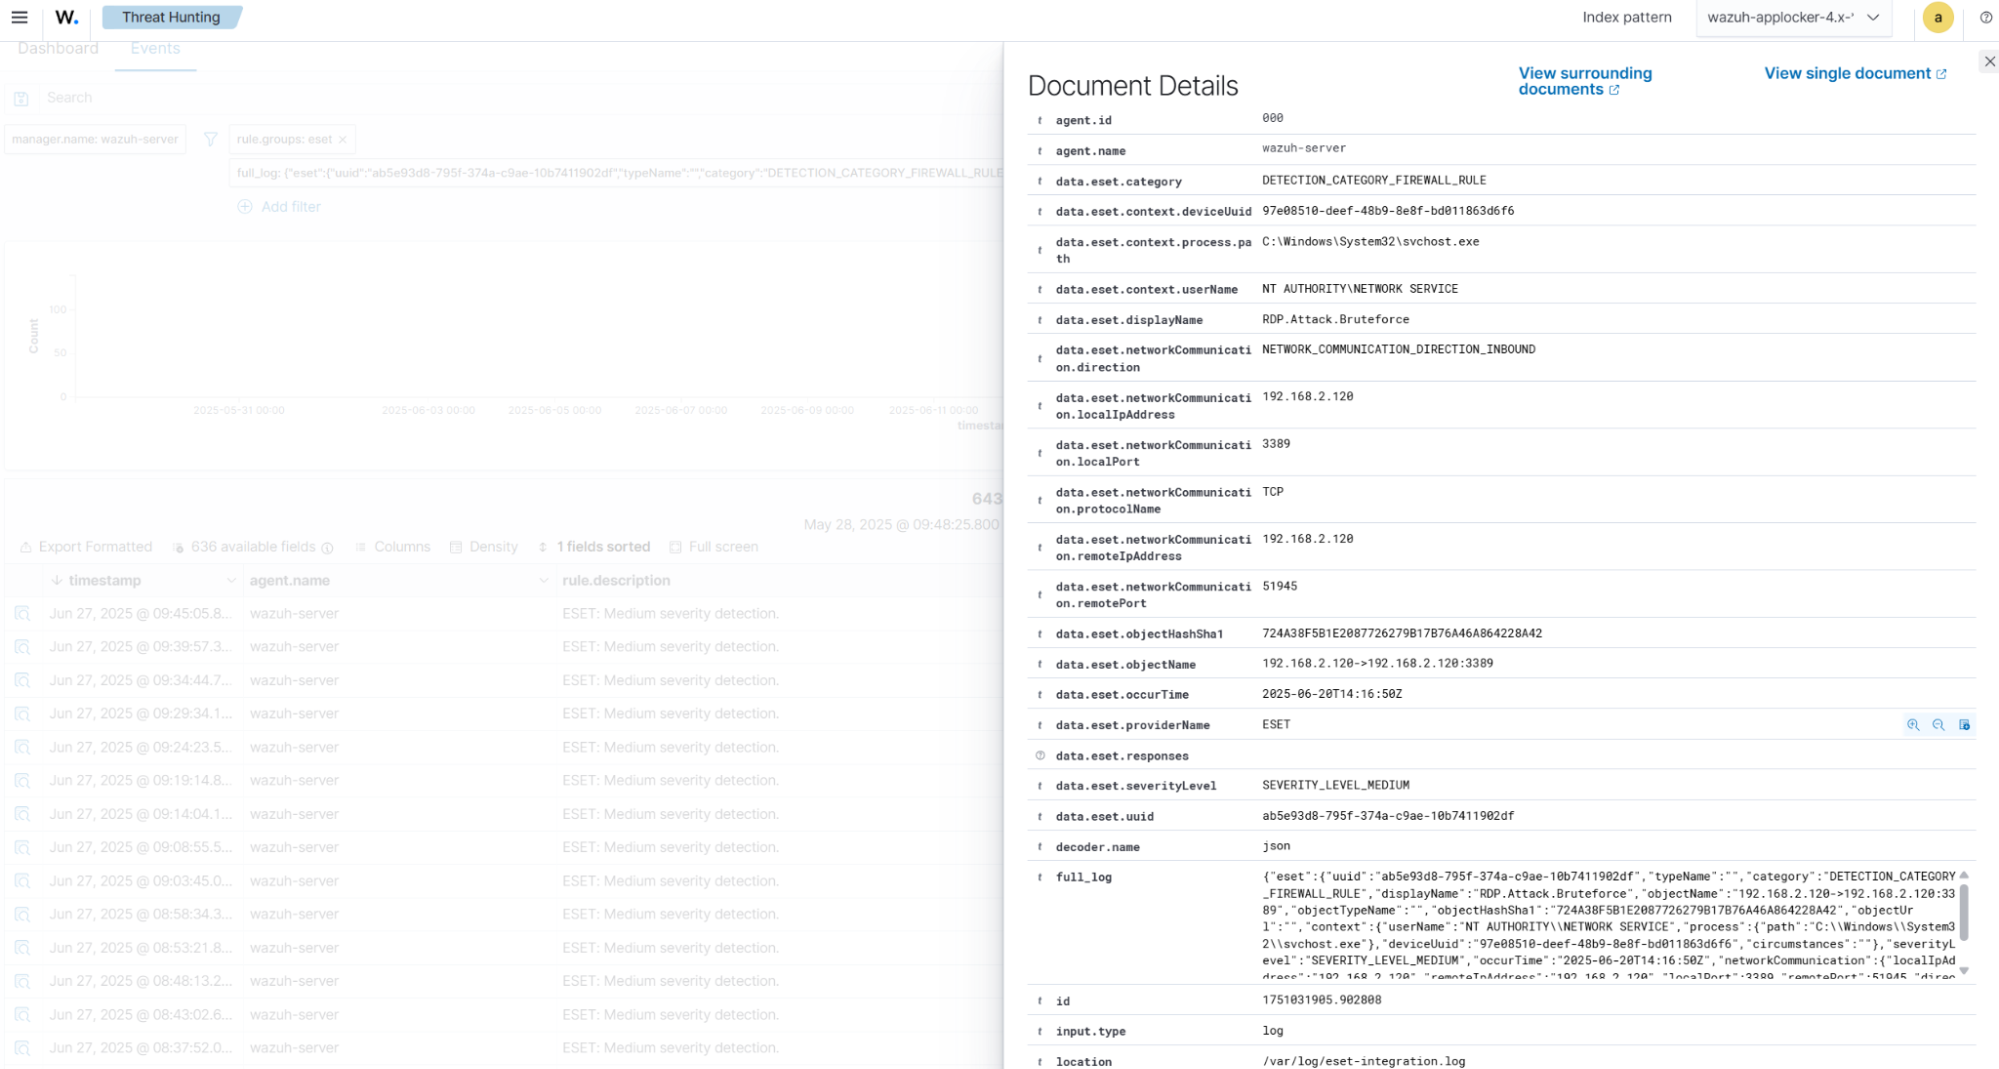
To have a more detailed description of each event, click on the Inspect document details button at the far left of the event to open the detailed view.
Malware detection
In this section, we conduct a controlled test by downloading a known malware sample on the Windows endpoint protected by ESET security software. Upon detection, ESET generates a security event, which is successfully forwarded and ingested by the Wazuh manager through the custom integration script.
To confirm the integration, we check the /var/log/eset_integration.log file on the Wazuh server for any new entries related to the malware detection:
{
  "eset": {
    "providerName": "ESET",
    "responses": [],
    "category": "DETECTION_CATEGORY_ANTIVIRUS",
    "displayName": "Python/Spy.Agent.AAF",
    "objectHashSha1": "E579E8C286E4D7F15D1F2B35F41D25BCC7BDE559",
    "objectName": "file:///C:/Users/rolly/Downloads/8c4daf5e4ced10c3b7fd7c17c7c75a158f08867aeb6bccab6da116affa424a89",
    "objectTypeName": "File",
    "objectUrl": "",
    "occurTime": "2025-06-30T18:28:51Z",
    "TimeGenerated": "2025-06-30T18:32:58Z",
    "severityLevel": "SEVERITY_LEVEL_MEDIUM",
    "typeName": "",
    "groupSize": 1,
    "severityScore": null,
    "userName": "",
    "objectSizeBytes": null,
    "edrRuleUuid": null,
    "note": null,
    "resolved": null,
    "cloudOfficeTenantUuid": null,
    "scanUuid": null,
    "detectionUuid": "edb25397-8bf8-8242-8bbb-d10670c727ef",
    "deviceDisplayName": null,
    "deviceUuid": "442926a2-3eb7-422e-beba-9acd3d44faaf",
    "userNameBase": "WINBOX\\rolly",
    "processPath": "C:\\Program Files\\WinRAR\\WinRAR.exe",
    "processUuid": null,
    "processCommandline": null
  }
}
Detection results
Follow the steps below to view the alerts generated on the Wazuh dashboard when the malware intrusion is detected.
- Navigate to Threat intelligence > Threat Hunting, and click the Events tab.
- Click + Add filter. Then filter by
rule.groups. - In the Operator field, select
is. - Search and select
esetin the Values field. - Click Save.
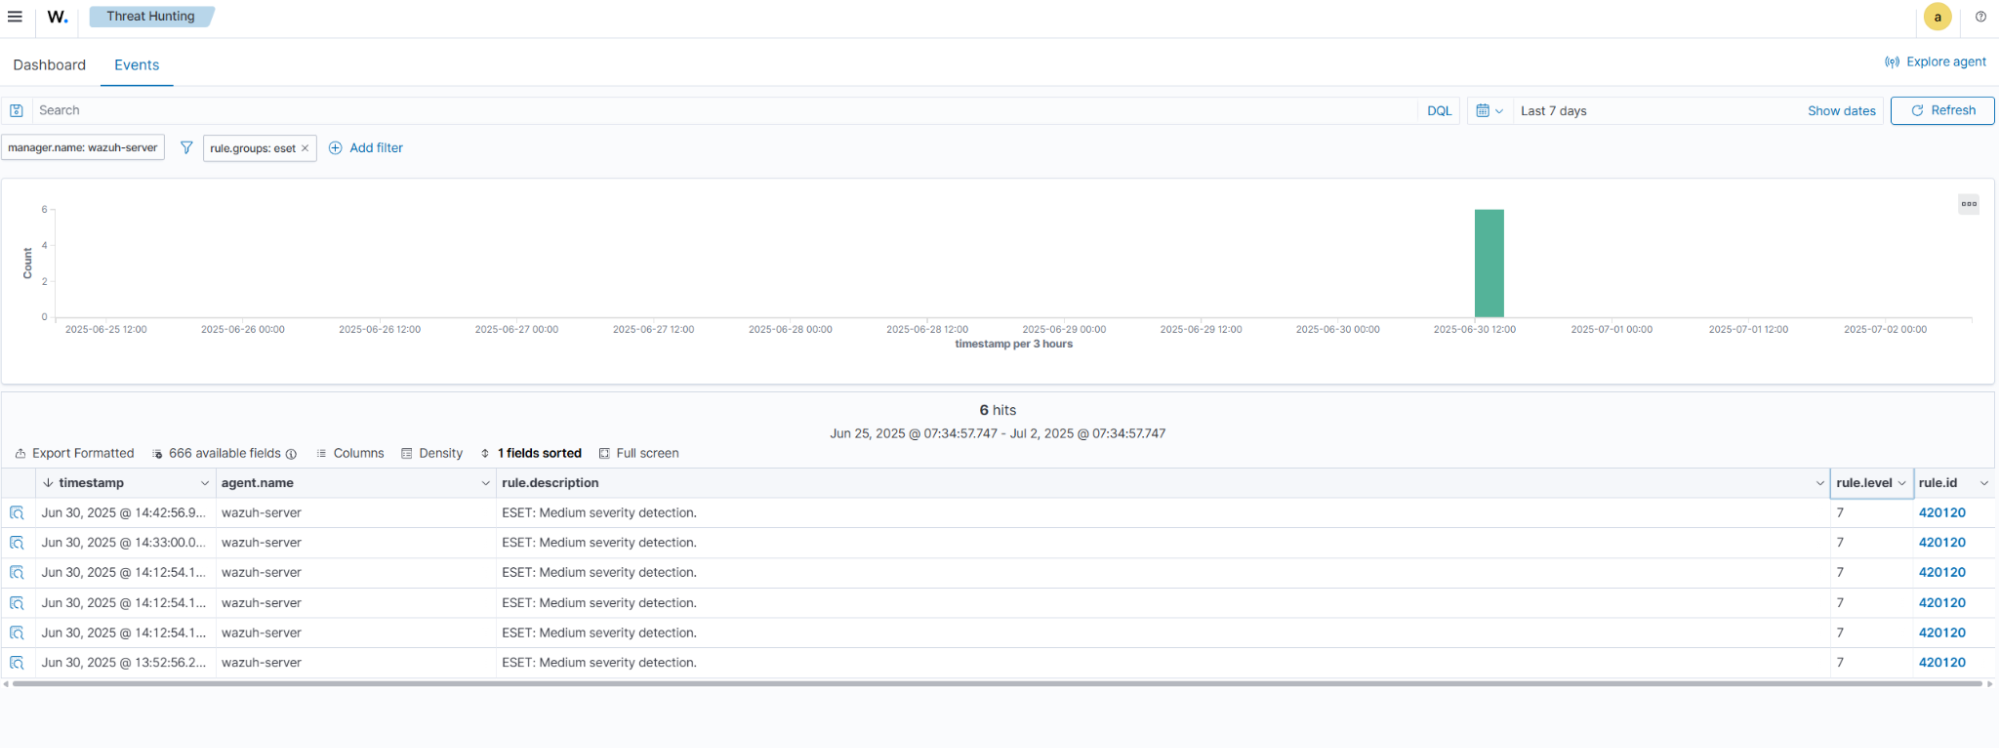
To have a more detailed description of each event, click on the Inspect document details button at the far left of the event to open the detailed view.

Conclusion
Integrating the ESET PROTECT Hub with Wazuh helps centralize monitoring of security events. By forwarding ESET detections to Wazuh, organizations gain real-time visibility, customizable alerting, and correlation across multiple data sources within a single security operations platform. This integration streamlines incident response and enhances threat hunting capabilities. It also supports compliance initiatives by centralizing and retaining security logs.
You can refer to the Wazuh documentation for more information on other use cases. If you have any questions about this blog post or Wazuh, we invite you to join our community, where our team can assist you.