Network security focuses on ensuring the integrity, confidentiality, and availability of computer networks and data by preventing unauthorized access, misuse, or disruption. Continuous network monitoring provides visibility into network activity, enabling organizations to detect issues, optimize performance, and identify potential threats before they escalate into serious incidents.
Wazuh is an open source SIEM/XDR platform that monitors, detects, and responds to security threats across endpoints, networks, and cloud environments in real time. Zeek, on the other hand, is a Linux-based open source framework for network visibility that analyzes traffic and produces structured logs and artifacts describing observed activity.
By ingesting Zeek logs, Wazuh enriches them with security context and applies correlation, alerting, and automated response actions. Integrating Zeek with Wazuh delivers unified, actionable visibility into network events and strengthens an organization’s ability to detect, investigate, and respond to security threats.
In this blog post, we demonstrate how to integrate Zeek with Wazuh for unified network security monitoring.
Infrastructure
We use the following infrastructure to demonstrate this integration:
- A pre-built, ready-to-use Wazuh OVA 4.12.0, which includes the Wazuh server, Wazuh indexer, and Wazuh dashboard. Follow this guide to download and set up the Wazuh virtual machine.
- An Ubuntu 24.04 endpoint with the Wazuh agent 4.12.0 installed and enrolled to the Wazuh server. We will install Zeek on this endpoint. This endpoint will also have a network interface available for packet capture, such as
eth0. - An attacker Ubuntu 24.04 endpoint to simulate attacks against the monitored endpoint.
Zeek log analysis
By default, Zeek outputs logs in a tab-separated values (TSV) format, where each type of log (such as conn.log, dns.log, etc.) has its own unique set of fields. These fields are not standardized across all log types. We perform the following to make Zeek logs easier to analyze and integrate with Wazuh:
- Parse and normalize: Convert Zeek native log files into JSON.
- Map fields: Translate Zeek-specific field names and values into standard names and values that match your organization’s schema or requirements.
- Enrich as needed: Add timestamps, event types, or other metadata to add context to Zeek events.
Use cases
Wazuh can parse Zeek logs and generate alerts using custom or built-in rules. Sample detection capabilities include:
| Threat type | Zeek log | Description |
| Brute-force attack | conn.log | Detects repeated failed login attempts based on connection patterns. |
| Denial-of-service (DoS) attack | conn.log | Identifies flooding traffic from a single source. |
| Reconnaissance scan | conn.log | Tracks port scans and network probes using unusual traffic patterns. |
| DNS query | dns.log | Flag queries to known malicious or suspicious domains. |
| SSL/TLS certificate threats | ssl.log | Flag connections to servers with self-signed or expired certificates. |
You can configure Wazuh to generate alerts based on thresholds, frequency, and known indicators of compromise (IoCs) by leveraging rules and CDB lists.
Configuration
Perform the steps below to configure this integration.
Ubuntu endpoint
Perform the following steps on the Ubuntu endpoint:
- Install Zeek
- Configure Zeek
- Configure log monitoring in the Wazuh agent
Install Zeek
Follow the steps below to install Zeek on the Ubuntu endpoint.
Note
You need administrative privileges to execute all the commands described below
1. Run the command below to add the Zeek repository:
# echo 'deb http://download.opensuse.org/repositories/security:/zeek/xUbuntu_24.04/ /' | sudo tee /etc/apt/sources.list.d/security:zeek.list
2. Download and add the GPG key for the Zeek repository:
# curl -fsSL https://download.opensuse.org/repositories/security:zeek/xUbuntu_24.04/Release.key | \
gpg --dearmor | sudo tee /etc/apt/trusted.gpg.d/security_zeek.gpg > /dev/null
3. Update the repository index and install Zeek using the following command:
# apt update -y
# apt install zeek -y
4. Add the /opt/zeek/bin directory to the system path through the ~/.bashrc file, then reload the ~/.bashrc file to apply the changes:
# echo "export PATH=$PATH:/opt/zeek/bin" >> ~/.bashrc
# source ~/.bashrc
5. Verify the installed Zeek version:
# zeek --version
zeek version 7.2.2
Configure Zeek
Follow the steps below to configure Zeek.
1. Edit the /opt/zeek/etc/node.cfg file and set the packet capture interface. In this blog post, we use eth0:
[zeek] type=standalone host=localhost interface=eth0
2. Edit the /opt/zeek/etc/networks.cfg file and add your network subnet. Replace <NETWORK_SUBNET> with your network subnet. The content of the file will look similar to this:
# List of local networks in CIDR notation, optionally followed by a descriptive
# tag. Private address space defined by Zeek's Site::private_address_space set
# (see scripts/base/utils/site.zeek) is automatically considered local. You can
# disable this auto-inclusion by setting zeekctl's PrivateAddressSpaceIsLocal
# option to 0.
#
# Examples of valid prefixes:
#
# 1.2.3.0/24        Admin network
# 2607:f140::/32    Student network
<NETWORK_SUBNET>
3. Run the following command to verify your Zeek syntax:
# zeekctl check
Hint: Run the zeekctl "deploy" command to get started.
zeek scripts are ok.
4. Start Zeek:
# zeekctl deploy
checking configurations ...
installing ...
creating policy directories ...
installing site policies ...
generating standalone-layout.zeek ...
generating local-networks.zeek ...
generating zeekctl-config.zeek ...
generating zeekctl-config.sh ...
stopping ...
stopping zeek ...
starting ...
starting zeek ...
5. Enable JSON log output. Zeek logs are stored in TSV format by default. Add the following line to the /opt/zeek/share/zeek/site/local.zeek file to generate logs in JSON:
@load policy/tuning/json-logs.zeek
6. Restart Zeek to apply the changes:
# zeekctl deploy
Zeek logs such as conn.log and dns.log will now be generated in JSON format in the /opt/zeek/logs/current directory.
Configure log monitoring in the Wazuh agent
1. Modify the /var/ossec/etc/ossec.conf file and append a localfile entry for all Zeek JSON logs at the end of the file:
<ossec_config>
<localfile>
<log_format>json</log_format>
<location>/opt/zeek/logs/current/*.log</location>
</localfile>
</ossec_config>
2. Restart the Wazuh agent to apply the configuration changes:
# systemctl restart wazuh-agent
Wazuh dashboard
Perform the following steps on the Wazuh dashboard.
Create custom decoders and rules
Perform the steps below to create and configure custom decoders and rules for processing and monitoring logs generated from Zeek.
1. Navigate to Server management > Decoders.
2. Click + Add new decoders file.
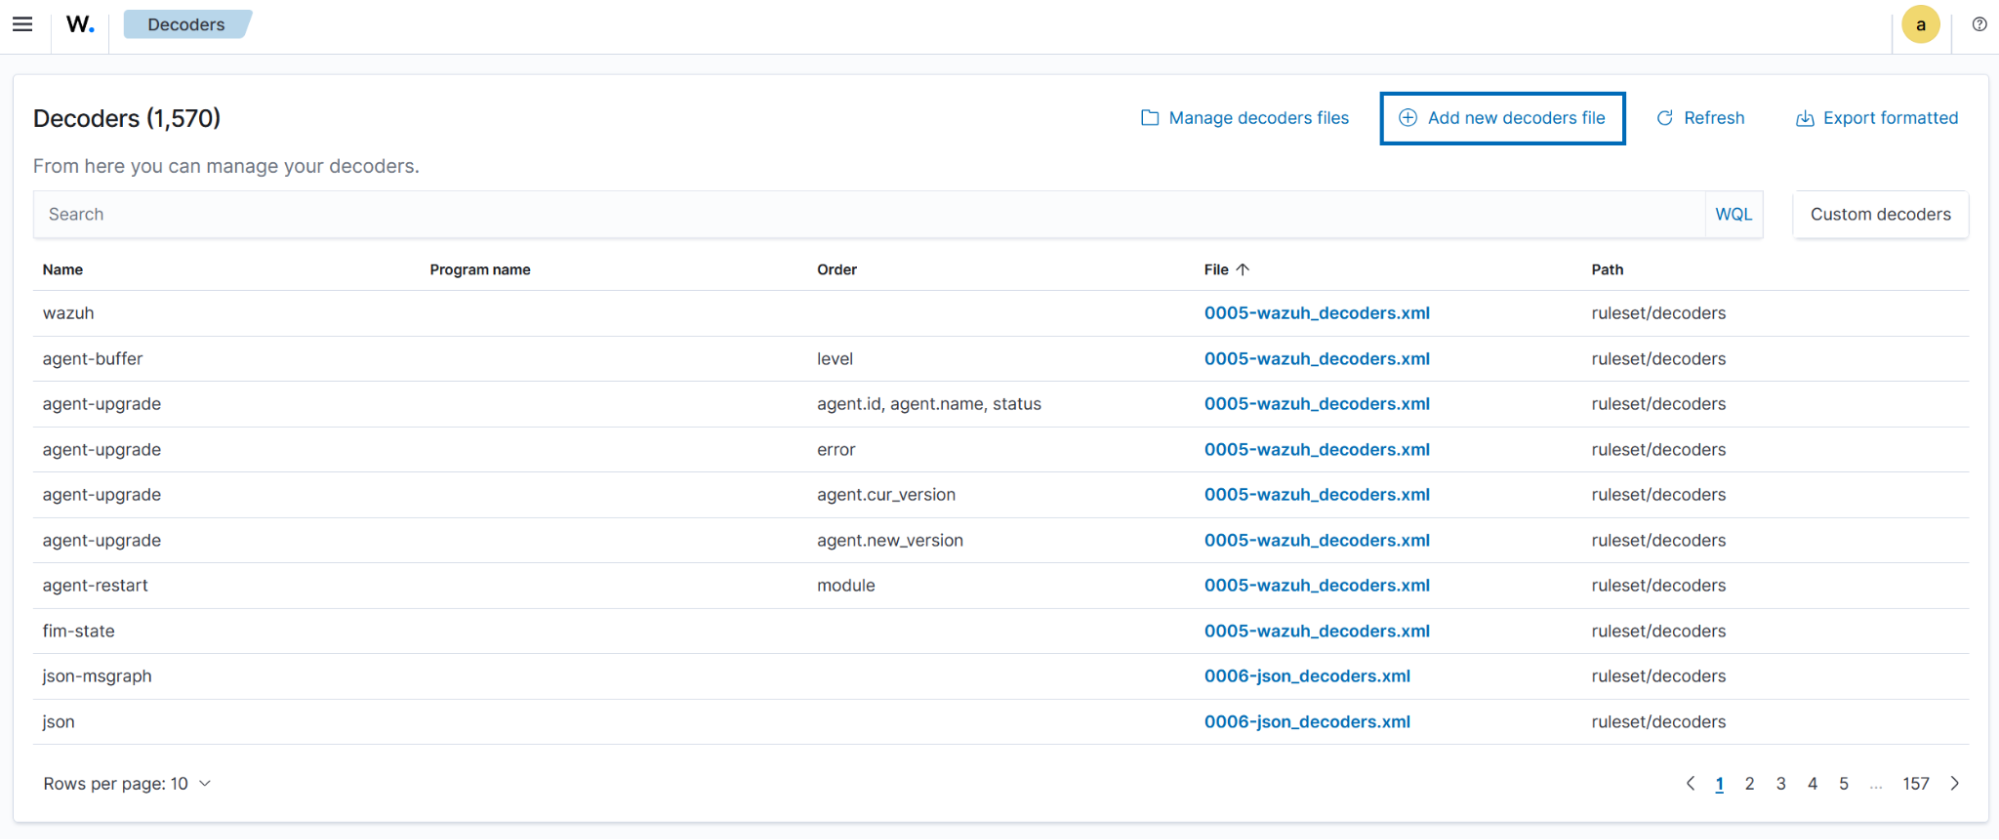
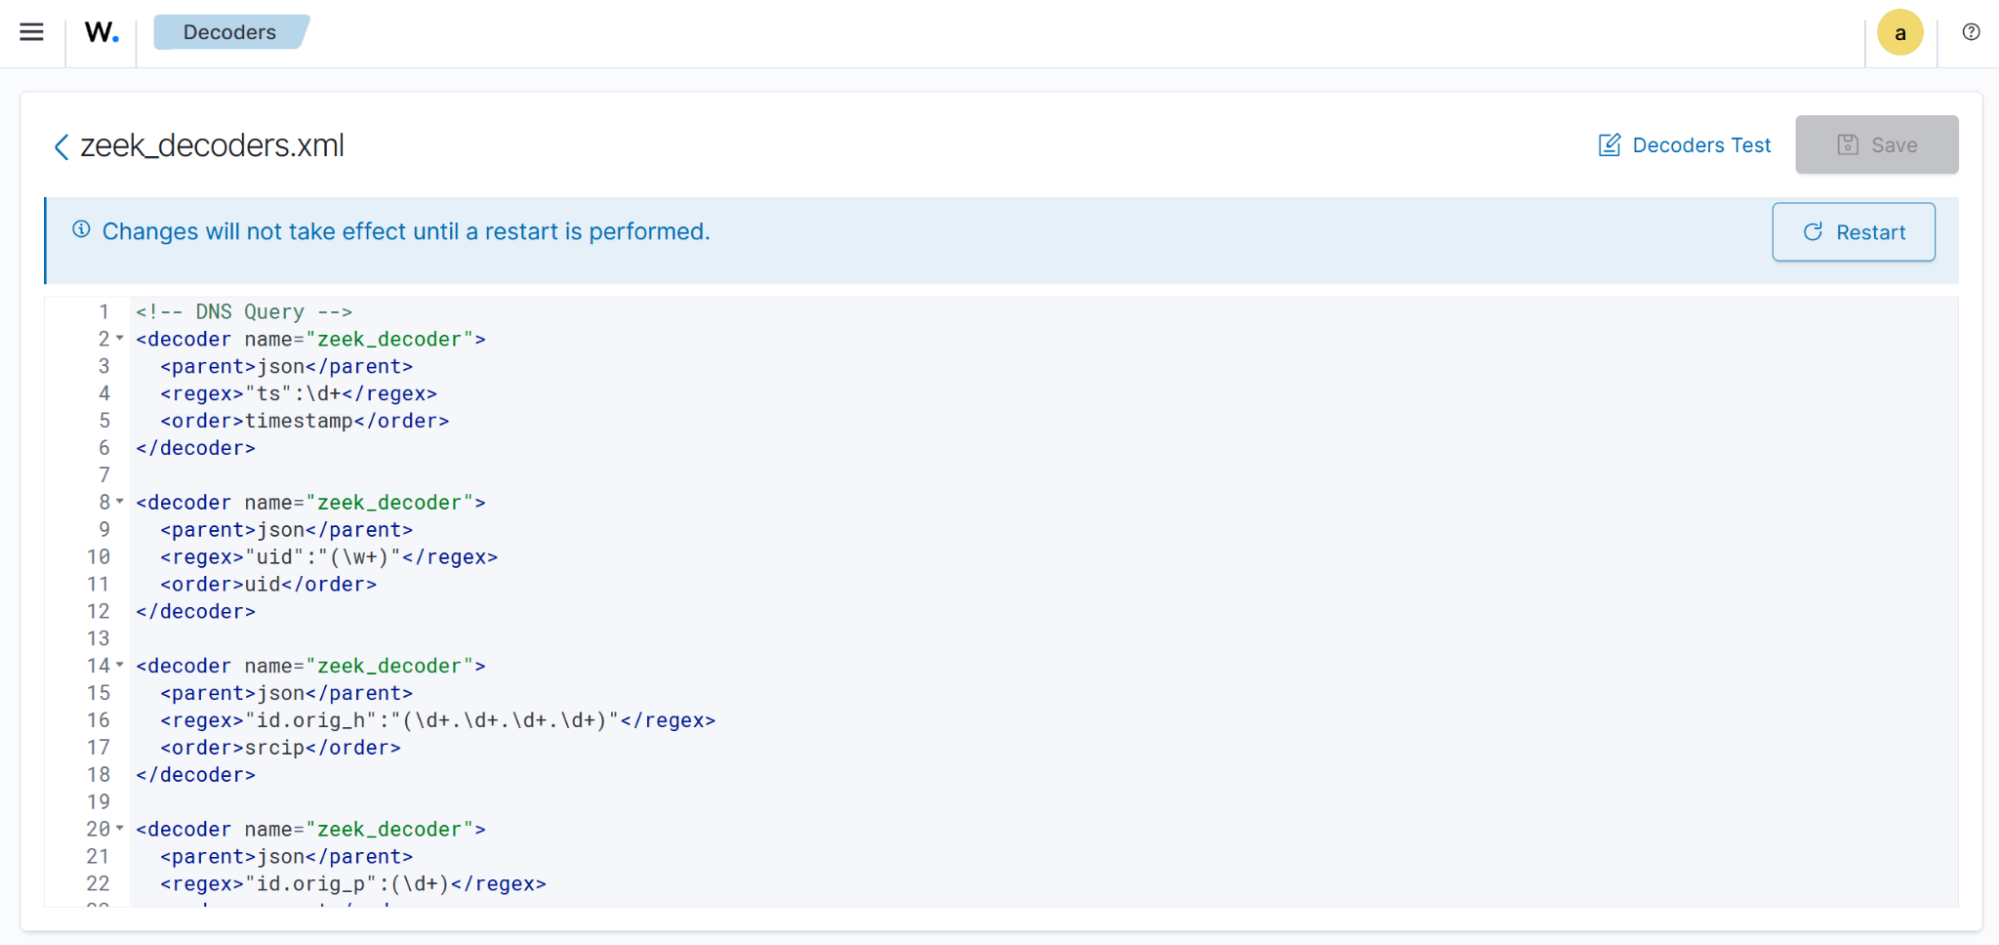
3. Copy and paste the decoders below and name the file zeek_decoders.xml. Click Save.
<!-- DNS Query --> <decoder name="zeek_decoder"> <parent>json</parent> <regex>"ts":\d+</regex> <order>timestamp</order> </decoder> <decoder name="zeek_decoder"> <parent>json</parent> <regex>"uid":"(\w+)"</regex> <order>uid</order> </decoder> <decoder name="zeek_decoder"> <parent>json</parent> <regex>"id.orig_h":"(\d+.\d+.\d+.\d+)"</regex> <order>srcip</order> </decoder> <decoder name="zeek_decoder"> <parent>json</parent> <regex>"id.orig_p":(\d+)</regex> <order>srcport</order> </decoder> <decoder name="zeek_decoder"> <parent>json</parent> <regex>"id.resp_h":"(\d+.\d+.\d+.\d+)"</regex> <order>dstip</order> </decoder> <decoder name="zeek_decoder"> <parent>json</parent> <regex>"id.resp_p":(\d+)</regex> <order>dstport</order> </decoder> <decoder name="zeek_decoder"> <parent>json</parent> <regex>"proto":"(\w+)"</regex> <order>protocol</order> </decoder> <decoder name="zeek_decoder"> <parent>json</parent> <regex>"trans_id":(\d+)</regex> <order>DNS_transaction_id</order> </decoder> <decoder name="zeek_decoder"> <parent>json</parent> <regex>"query":"(\.+)"</regex> <order>dnsquery</order> </decoder> <decoder name="zeek_decoder"> <parent>json</parent> <regex>"rcode_name":"(\w+)"</regex> <order>dns_response_code</order> </decoder> <decoder name="zeek_decoder"> <parent>json</parent> <regex>"AA":(\w+)</regex> <order>authoritative_answer</order> </decoder> <decoder name="zeek_decoder"> <parent>json</parent> <regex>"TC":(\w+)</regex> <order>truncate_flag</order> </decoder> <decoder name="zeek_decoder"> <parent>json</parent> <regex>"RD":(\w+)</regex> <order>recursion_desired_flag</order> </decoder> <decoder name="zeek_decoder"> <parent>json</parent> <regex>"RA":(\w+)</regex> <order>recursion_avalable_flag</order> </decoder> <decoder name="zeek_decoder"> <parent>json</parent> <regex>"Z":(\d+)</regex> <order>reserved_for_future_use</order> </decoder> <decoder name="zeek_decoder"> <parent>json</parent> <regex>"answers":(["\.+"])</regex> <order>resolved_by</order> </decoder> <decoder name="zeek_decoder"> <parent>json</parent> <regex>"TTLs":([\d+])</regex> <order>time_to_live</order> </decoder> <decoder name="zeek_decoder"> <parent>json</parent> <regex>"rejected":(\w+)</regex> <order>query_rejected</order> </decoder> <!-- Additional DNS metadata --> <decoder name="zeek_decoder"> <parent>json</parent> <regex>"service":"(\w+)"</regex> <order>application_layer_protocol</order> </decoder> <decoder name="zeek_decoder"> <parent>json</parent> <regex>"duration":(\d+.\d+)</regex> <order>duration_of_the_connection</order> </decoder> <decoder name="zeek_decoder"> <parent>json</parent> <regex>"orig_bytes":(\d+)</regex> <order>byte_send_by_originator</order> </decoder> <decoder name="zeek_decoder"> <parent>json</parent> <regex>"resp_bytes":(\d+)</regex> <order>byte_sent_by_responder</order> </decoder> <decoder name="zeek_decoder"> <parent>json</parent> <regex>"conn_state":"(\w+)"</regex> <order>connection_state</order> </decoder> <decoder name="zeek_decoder"> <parent>json</parent> <regex>"local_orig":(\w+)</regex> <order>local_origin</order> </decoder> <decoder name="zeek_decoder"> <parent>json</parent> <regex>"local_resp":(\w+)</regex> <order>local_response</order> </decoder> <decoder name="zeek_decoder"> <parent>json</parent> <regex>"missed_bytes":(\d+)</regex> <order>missed_bytes_might_packet_loss</order> </decoder> <decoder name="zeek_decoder"> <parent>json</parent> <regex>"history":\w+</regex> <order>history</order> </decoder> <decoder name="zeek_decoder"> <parent>json</parent> <regex>"orig_pkts":(\d+)</regex> <order>packet_sent_by_origin</order> </decoder> <decoder name="zeek_decoder"> <parent>json</parent> <regex>"orig_ip_bytes":(\d+)</regex> <order>ip_layer_bytes_from_origin</order> </decoder> <decoder name="zeek_decoder"> <parent>json</parent> <regex>"resp_pkts":(\d+)</regex> <order>packet_sent_by_responder</order> </decoder> <decoder name="zeek_decoder"> <parent>json</parent> <regex>"resp_ip_bytes":(\d+)</regex> <order>ip_layer_bytes_sent_by_responder</order> </decoder> <decoder name="zeek_decoder"> <parent>json</parent> <regex>"ip_proto":(\d+)</regex> <order>protocol_number_ip_header</order> </decoder> <!-- Software related --> <decoder name="zeek_decoder"> <parent>json</parent> <regex>"host":"(\d+.\d+.\d+.\d+)"</regex> <order>host_ip</order> </decoder> <decoder name="zeek_decoder"> <parent>json</parent> <regex>"software_type":"(\.+)"</regex> <order>software_type</order> </decoder> <decoder name="zeek_decoder"> <parent>json</parent> <regex>"name":"(\w+)"</regex> <order>software_name</order> </decoder> <decoder name="zeek_decoder"> <parent>json</parent> <regex>"unparsed_version":"(\.+)"</regex> <order>software_version</order> </decoder> <decoder name="zeek_decoder"> <parent>json</parent> <regex>"host_p":(\d+)</regex> <order>host_port</order> </decoder> <!-- SSL/TLS Connection Decoders --> <decoder name="zeek_decoder"> <parent>json</parent> <regex>"version":"(\.+)"</regex> <order>ssl_version</order> </decoder> <decoder name="zeek_decoder"> <parent>json</parent> <regex>"cipher":"(\.+)"</regex> <order>ssl_cipher</order> </decoder> <decoder name="zeek_decoder"> <parent>json</parent> <regex>"curve":"(\.+)"</regex> <order>ssl_curve</order> </decoder> <decoder name="zeek_decoder"> <parent>json</parent> <regex>"validation_status":"(\.+)"</regex> <order>ssl_validation_status</order> </decoder> <decoder name="zeek_decoder"> <parent>json</parent> <regex>"server_name":"(\.+)"</regex> <order>ssl_server_name</order> </decoder> <decoder name="zeek_decoder"> <parent>json</parent> <regex>"established":(\w+)</regex> <order>ssl_established</order> </decoder> <decoder name="zeek_decoder"> <parent>json</parent> <regex>"resumed":(\w+)</regex> <order>ssl_resumed</order> </decoder> <decoder name="zeek_decoder"> <parent>json</parent> <regex>"ssl_history":"(\.+)"</regex> <order>ssl_history</order> </decoder> <decoder name="zeek_decoder"> <parent>json</parent> <regex>"cert_chain_fps":"(\.+)"</regex> <order>ssl_cert_fingerprint</order> </decoder> <decoder name="zeek_decoder"> <parent>json</parent> <regex>"next_protocol":"(\.+)"</regex> <order>ssl_next_protocol</order> </decoder>
4. Navigate to Server management > Rules.
5. Click + Add new rules file.
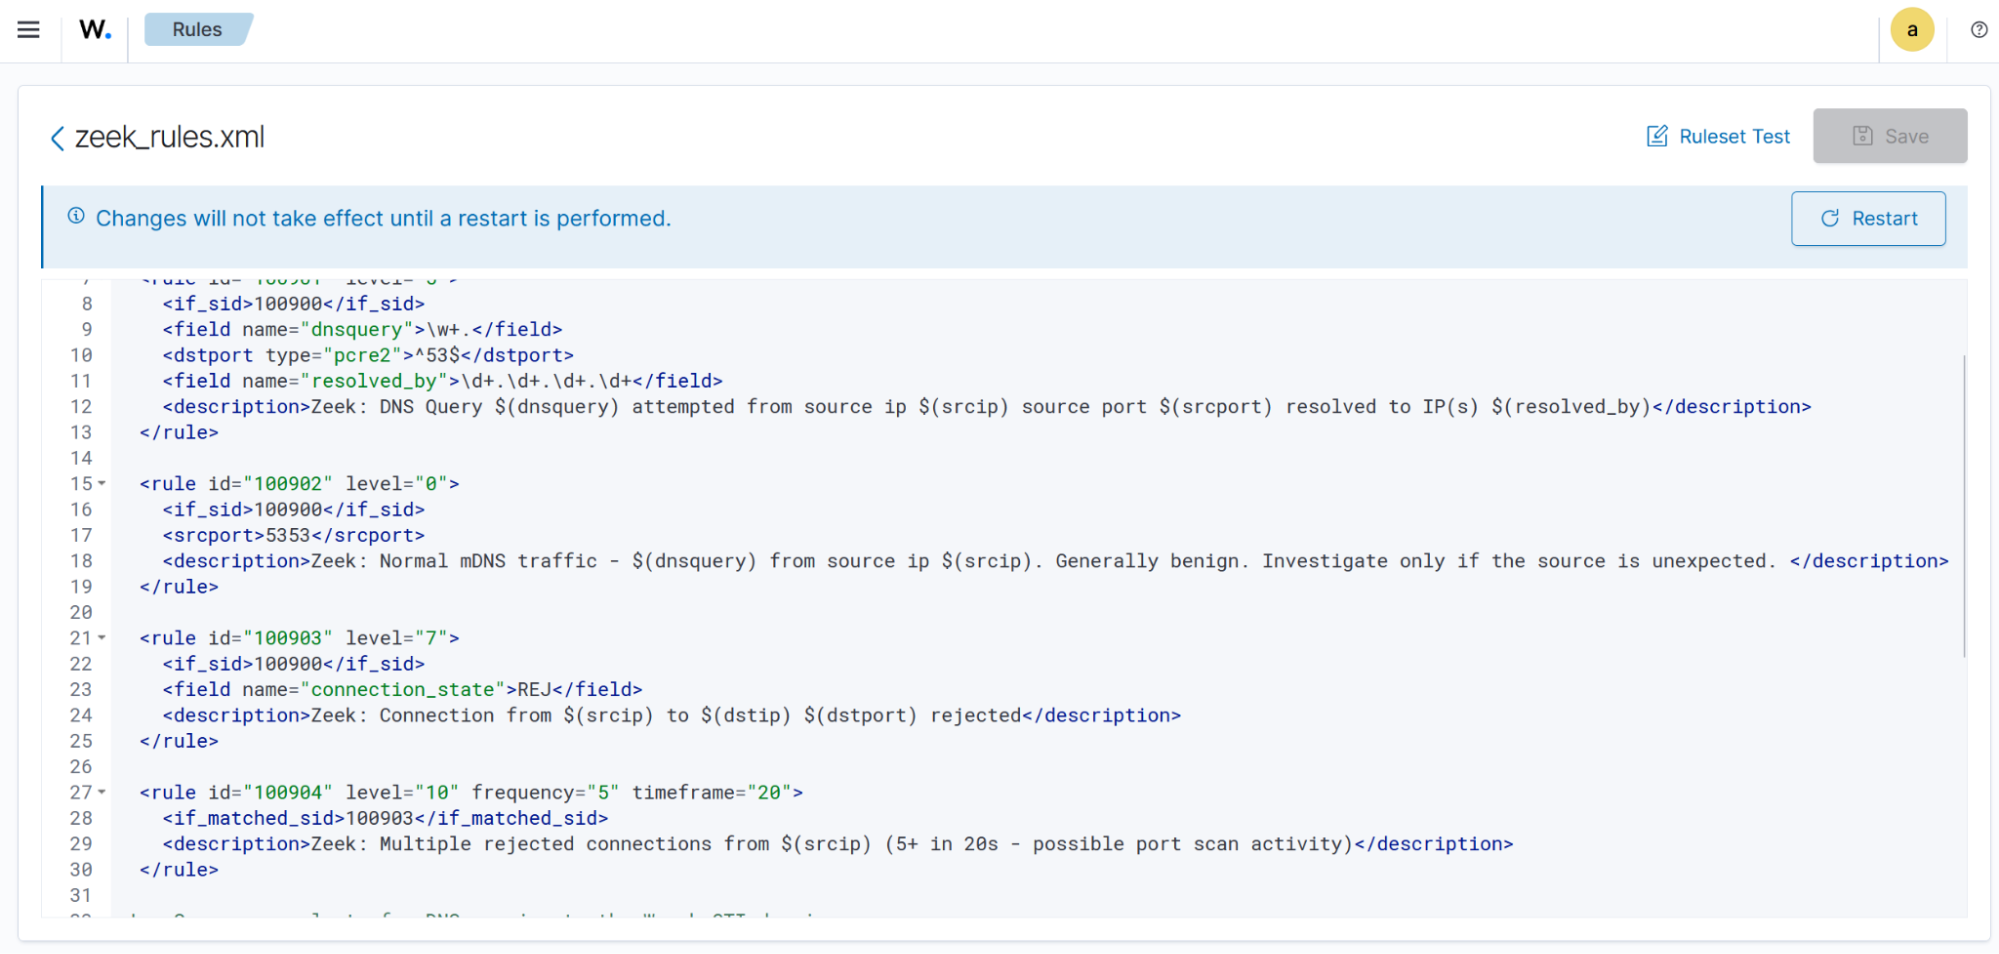
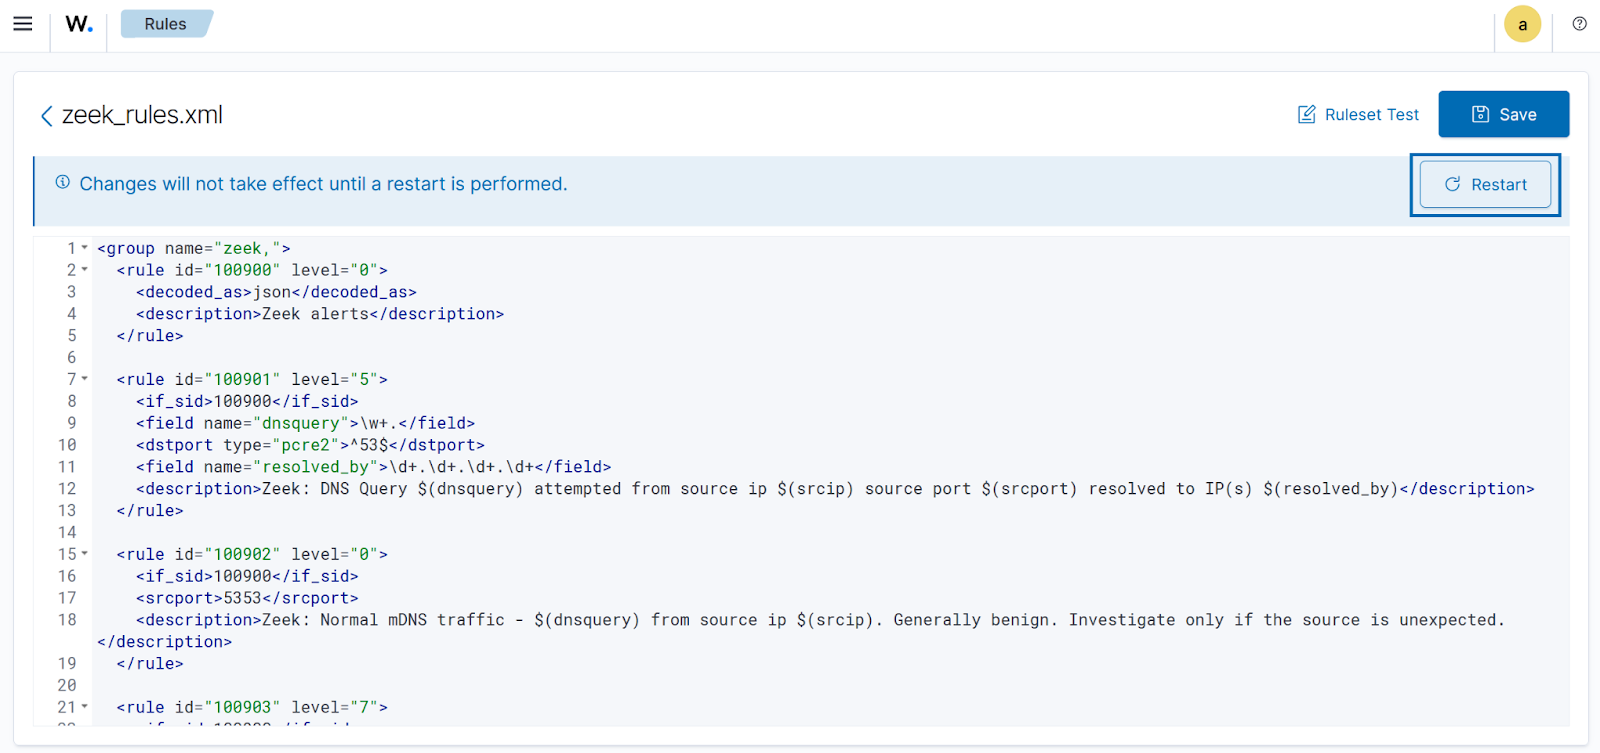
6. Copy and paste the rules below and name the file zeek_rules.xml. Click Save.
<group name="zeek,">
  <rule id="100900" level="0">
    <decoded_as>json</decoded_as>
    <description>Zeek alerts</description>
  </rule>

  <rule id="100901" level="5">
    <if_sid>100900</if_sid>
    <field name="dnsquery">\w+.</field>
    <dstport type="pcre2">^53$</dstport>
    <field name="resolved_by">\d+.\d+.\d+.\d+</field>
    <description>Zeek: DNS Query $(dnsquery) attempted from source ip $(srcip) source port $(srcport) resolved to IP(s) $(resolved_by)</description>
  </rule>

  <rule id="100902" level="0">
    <if_sid>100900</if_sid>
    <srcport>5353</srcport>
    <description>Zeek: Normal mDNS traffic - $(dnsquery) from source ip $(srcip). Generally benign. Investigate only if the source is unexpected. </description>
  </rule>

  <rule id="100903" level="7">
    <if_sid>100900</if_sid>
    <field name="connection_state">REJ</field>
    <description>Zeek: Connection from $(srcip) to $(dstip) $(dstport) rejected</description>
  </rule>

  <rule id="100904" level="10" frequency="5" timeframe="20">
    <if_matched_sid>100903</if_matched_sid>
    <description>Zeek: Multiple rejected connections from $(srcip) (5+ in 20s - possible port scan activity)</description>
  </rule>

<!-- Suppresses alerts for DNS queries to the Wazuh CTI domain. -->
  <rule id="100905" level="0">
    <if_sid>100900</if_sid>
    <field name="dnsquery">cti.wazuh.com</field>
    <description>Zeek: DNS Query $(dnsquery) exclude</description>
  </rule>

  <rule id="100906" level="8">
    <if_sid>100900</if_sid>
    <field name="ssl_validation_status">self signed certificate</field>
    <description>Zeek: Client $(srcip) connected to a server with self-signed certificate $(dstip)</description>
  </rule>

  <rule id="100907" level="12">
    <if_sid>100900</if_sid>
    <field name="ssl_validation_status">certificate has expired</field>
    <description>Zeek: Client $(srcip) connected to a server with expired certificate $(dstip)</description>
  </rule>
</group>
7. Click Restart to apply the changes. Click Confirm when prompted.
Testing the integration
We test the following use cases to validate the integration of Zeek with Wazuh:
Perform the following steps to test the integration and view alerts on the Wazuh dashboard.
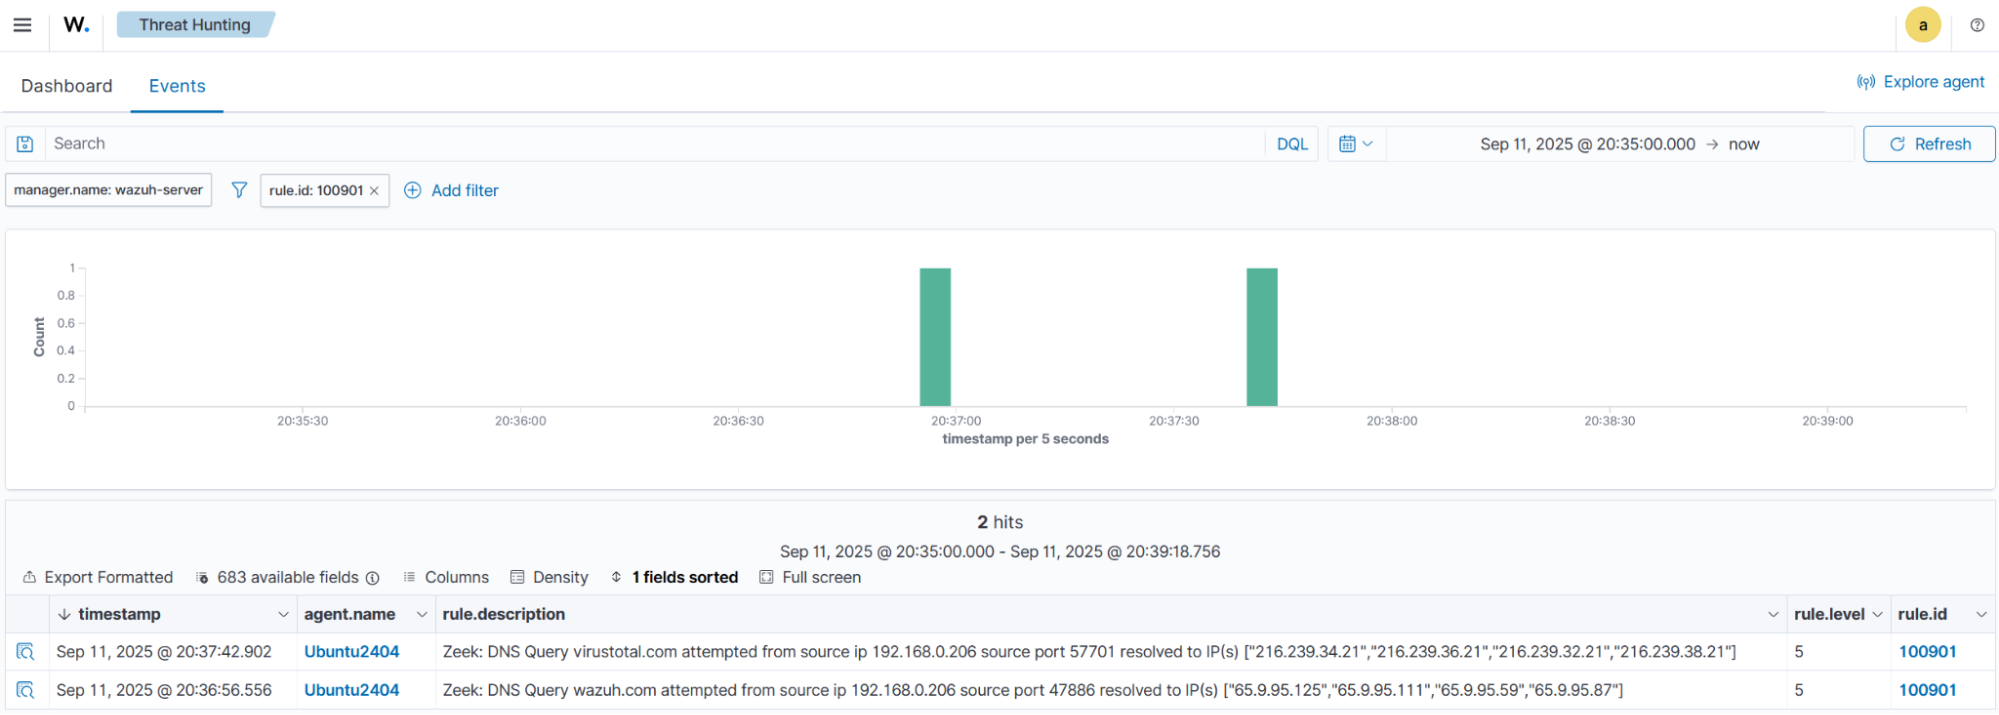
DNS queries
We simulate DNS queries on the Ubuntu endpoint. Run the following commands to generate DNS query logs.
# dig wazuh.com
# dig virustotal.com
Detection results
Follow the steps below to view the alerts generated on the Wazuh dashboard once the attack attempt is completed.
- Navigate to Threat intelligence > Threat Hunting, and click the Events tab.
- Click + Add filter. Then filter by
rule.id. - In the Operator field, select
is. - Search for and select
100901in the Values field. - Click Save.
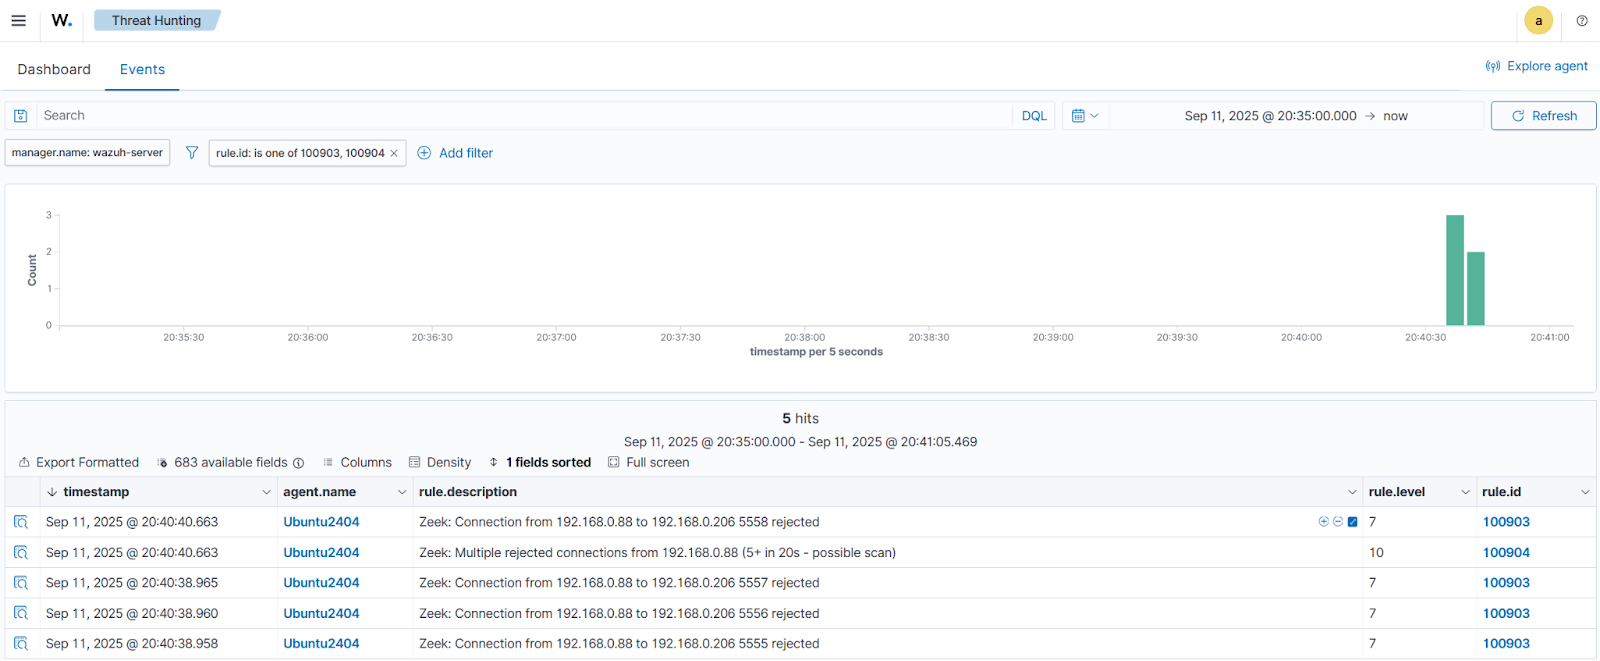
Reconnaissance and port scanning activity
Simulation
We simulate port-scanning activity from the attacker’s Ubuntu endpoint. Run the following command to simulate a port scan against ports 5555 - 5559. These ports do not have listening services or explicit firewall rules; therefore, the Linux kernel’s TCP automatically sends an RST response. Replace <UBUNTU_ENDPOINT_IP> with the IP address of your Ubuntu endpoint.
# for port in {5555..5559}; do nc -zv <UBUNTU_ENDPOINT_IP> $port || true; done
Detection results
Follow the steps below to view the alerts generated on the Wazuh dashboard once the attack simulation is completed.
- Navigate to Threat intelligence > Threat Hunting, and click the Events tab.
- Click + Add filter. Then filter by
rule.id. - Select
is oneof in the Operators field. - Search for and select
100903and100904in the Values field. - Click Save.
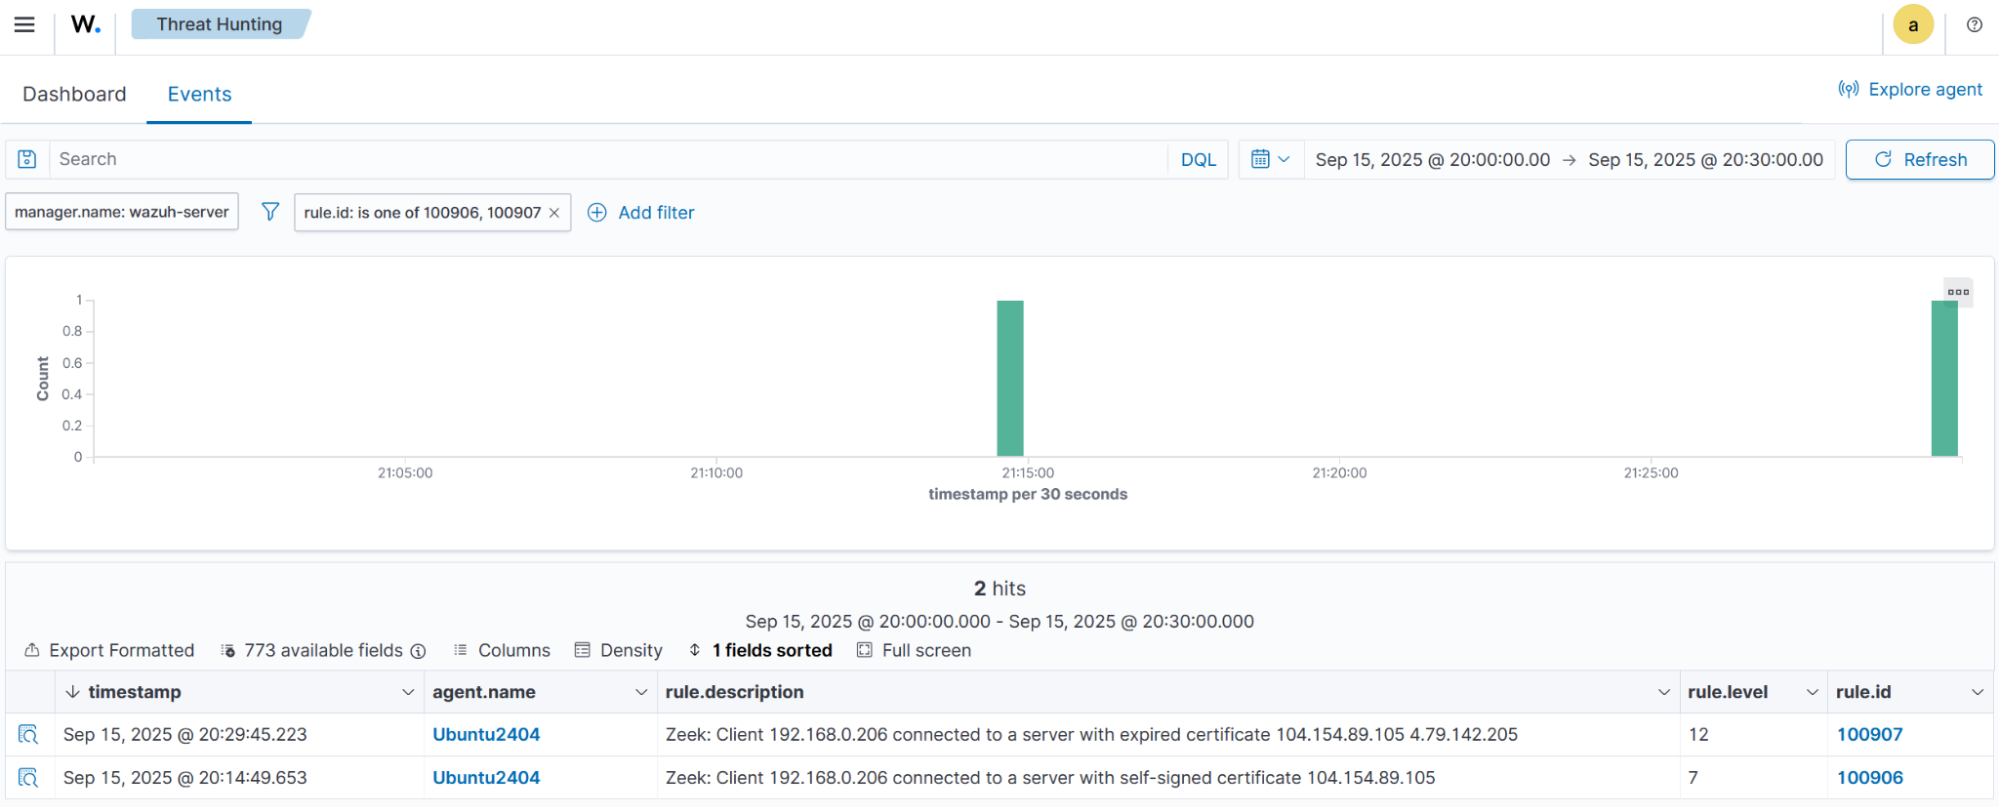
SSL/TLS certificate validation threats
Simulation
We simulate connections to servers with invalid or expired SSL certificates that may indicate malicious activity, man-in-the-middle attacks, or compromised services. Run the following commands on your Ubuntu endpoint to generate SSL certificate validation logs.
# curl -k https://self-signed.badssl.com
# curl -k https://revoked.grc.com
Detection results
Follow the steps below to view the alerts generated on the Wazuh dashboard once the attack attempt is completed.
- Navigate to Threat intelligence > Threat Hunting, and click the Events tab.
- Click + Add filter. Then filter by
rule.id. - Select
is oneof in the Operator field. - Search for and select
100906and100907in the Values field. - Click Save.
Conclusion
Integrating Zeek with Wazuh enhances network security by combining the traffic analysis capabilities of Zeek with Wazuh security monitoring and alerting capabilities. This integration can detect threats like brute-force attacks, port scans, and SSL certificate validation threats, providing real-time visibility and automated alerting. Security teams gain a scalable solution for detecting and responding to network threats using this integration.
To learn more about Wazuh, explore our blog posts, and join the growing community.