Snowflake is a fully managed, cloud-native data warehouse designed to handle structured and semi-structured data at massive scale. It separates storage from compute, allowing organizations to independently scale workloads such as data ingestion, analytics, machine learning, and reporting. It is a high-value target for attackers because it often centralizes critical business data such as financial transactions, PII, authentication logs, and operational analytics.
Monitoring Snowflake with Wazuh extends security visibility beyond traditional infrastructure and into cloud-hosted data warehouses. By integrating Snowflake audit logs with Wazuh, security teams can detect suspicious activity such as anomalous logins, failed authentication attempts, and database operations. Wazuh ruleset and analysis engine allows organizations to combine Snowflake events with other endpoint, network, and application logs, creating a unified picture of the entire IT infrastructure. This enhances alerting, speeds investigation, and helps organizations meet compliance and governance requirements by continuously monitoring access and activity within Snowflake.
This blog post explains how to export Snowflake logs and forward them to the Wazuh server for continuous analysis and monitoring.
Infrastructure
We use the following infrastructure to demonstrate the integration of Wazuh with Snowflake for active monitoring.
- A pre-built, ready-to-use Wazuh OVA 4.14.0, which includes Wazuh central components (Wazuh server, Wazuh indexer, and Wazuh dashboard). Follow this guide to set up the Wazuh virtual machine.
- A monitored Ubuntu endpoint with access to the internet to serve as the Snowflake log collector. Refer to the installation guide to install the Wazuh agent 4.14.0. The Ubuntu endpoint uses the Wazuh Command module to run a script that pulls the Snowflake logs at intervals. The logs are then forwarded to the Wazuh server for analysis by the Wazuh agent.
- A Snowflake account.
Configuration
Follow the configuration steps below to achieve this integration. We create an account on Snowflake and extract the connection parameters necessary to connect to the Snowflake instance. We then configure the Wazuh Command module to periodically run SQL queries to retrieve the logs from the Snowflake account and send them to the Wazuh server for analysis.
Configuring Snowflake
Follow the steps below to extract the connection parameters necessary to connect to the Snowflake instance:
1. Go to the Snowflake sign-up page and create an account. Select your preferred Cloud provider. If you already have an account, select Sign in.
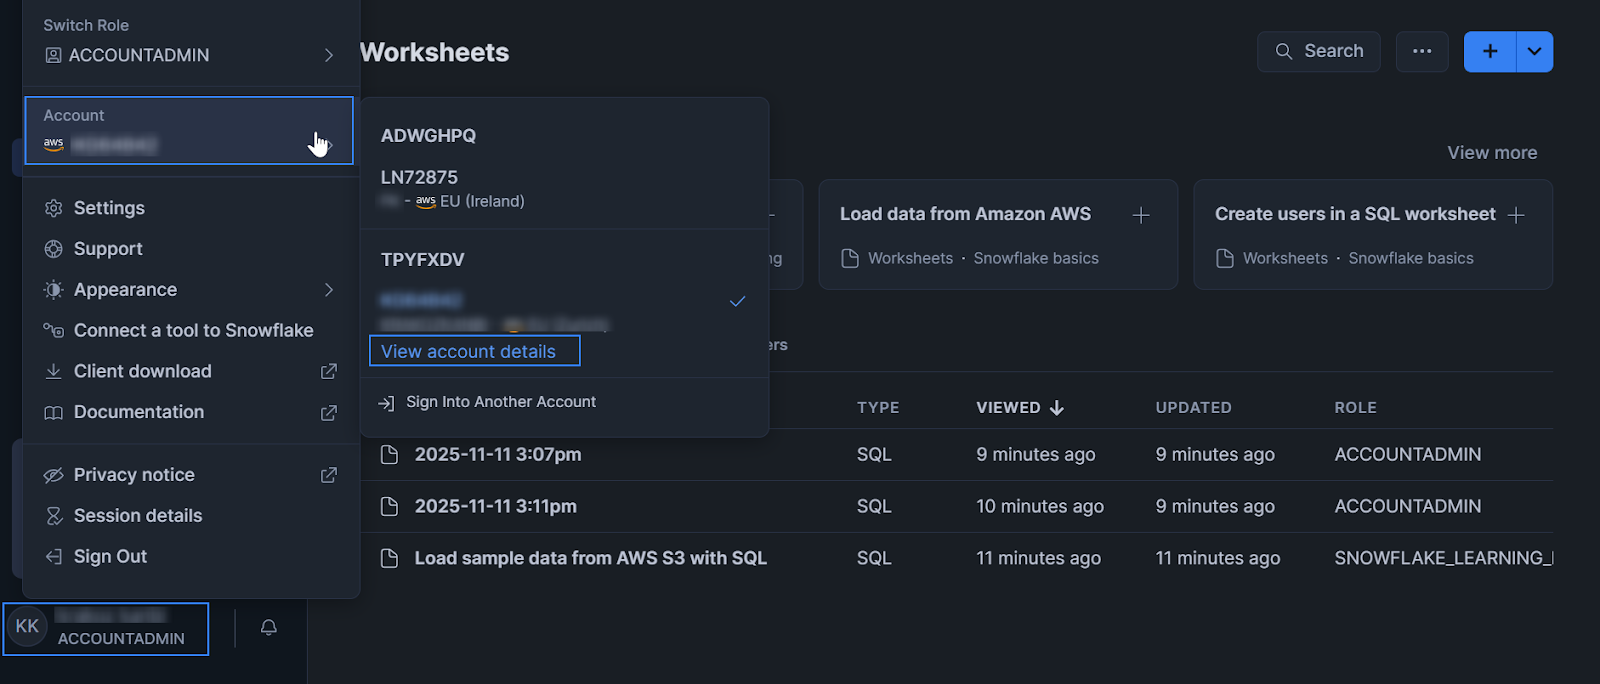
2. Click on your account’s avatar and navigate to Account > View account details.
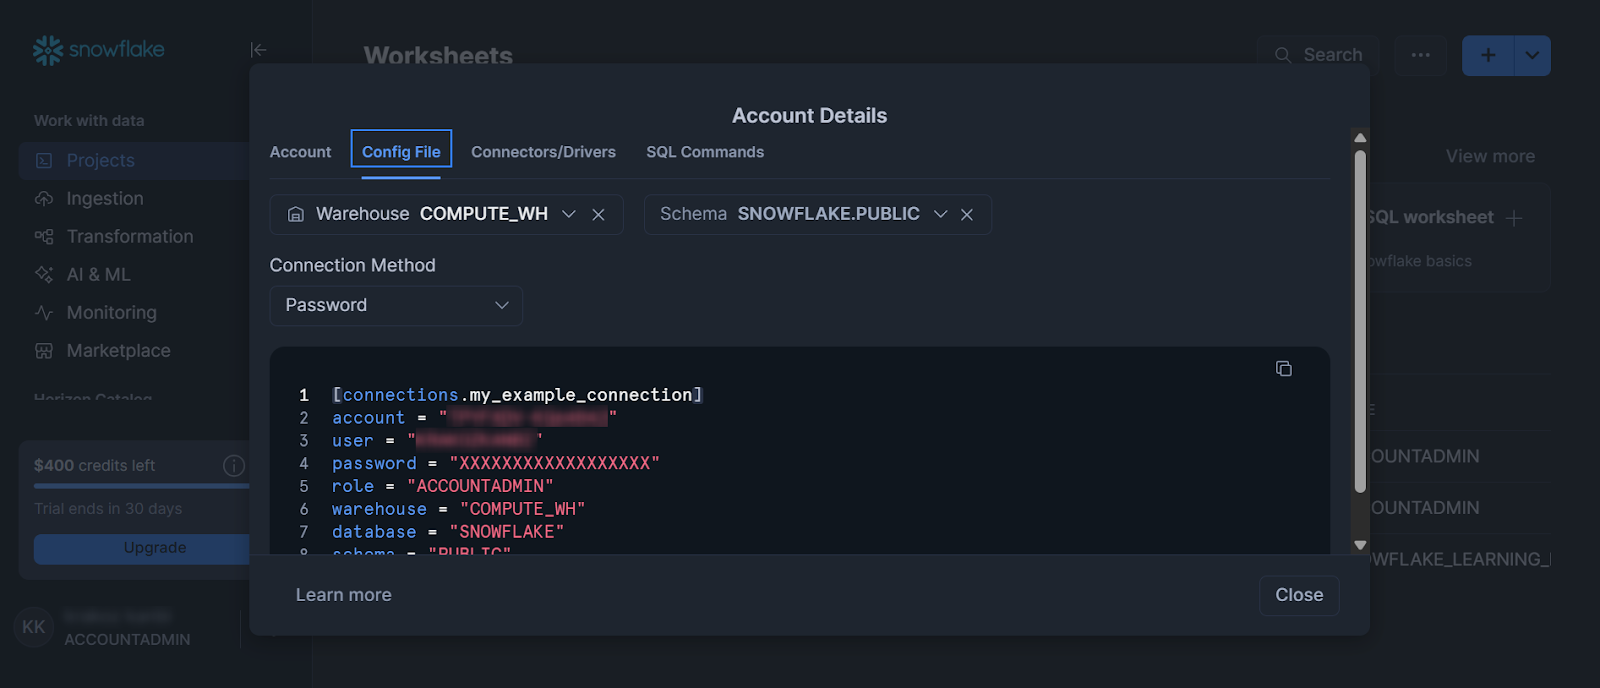
3. Navigate to the Config File tab, then select COMPUTE_WH as the warehouse, SNOWFLAKE as the database, and Password as the connection method. Note the configuration details provided; it will be used to configure the Snowflake log retrieval.
Ubuntu endpoint
Snowflake stores usage and operation logs in the SNOWFLAKE database located within the Snowflake warehouse. These logs are retrieved by running SQL queries in Snowflake, and the query results are exported to the Ubuntu connector endpoint. The Wazuh agent then reads the exported logs and sends them to the Wazuh server for analysis.
Perform the following steps to configure and routinely pull Snowflake logs on the monitored endpoint.
1. Install the required Python modules:
# apt install python3-venv python3-pip
# pip install snowflake-connector-python snowflake-connector-python[pandas] python-dotenv pandas
2. Create a folder snowflake_logs in the /etc directory. We also create other files and folders necessary for the integration:
# mkdir /etc/snowflake_logs
# mkdir /etc/snowflake_logs/queries
3. Create the following files in the /etc/snowflake_logs/queries directory and save the associated queries in them:
login.sql: Retrieves login events from theACCOUNT_USAGEschema.
SELECT 'snowflake' AS source, *
FROM SNOWFLAKE.ACCOUNT_USAGE.LOGIN_HISTORY
WHERE EVENT_ID > {{last_value}}
ORDER BY EVENT_ID ASC;
account_admin_no_MFA.sql: Retrieves events of admin users without MFA configured from the SnowflakeACCOUNT_USAGEschema.
SELECT
    'snowflake' AS source,
    'admin_no_mfa' AS title,
    u.*,
    u.last_success_login AS end_time,
    TIMEDIFF(days, u.password_last_set_time, CURRENT_TIMESTAMP(6)) || ' days ago' AS password_age
FROM
    SNOWFLAKE.ACCOUNT_USAGE.users u
WHERE
    u.ext_authn_duo = FALSE
    AND u.deleted_on IS NULL
    AND u.has_password = TRUE
    AND (u.last_success_login > TO_TIMESTAMP_NTZ('{{last_value}}'))
ORDER BY
    u.last_success_login ASC;
net_change.sql: Retrieves events about network policy changes from the SnowflakeACCOUNT_USAGEschema.
SELECT *, 'snowflake' AS source,
    user_name || ' made the following Network Policy change on ' || end_time || ' [' || query_text || ']' AS title,
FROM
    SNOWFLAKE.ACCOUNT_USAGE.query_history
WHERE
    execution_status = 'SUCCESS'
    AND (
        query_type IN ('CREATE_NETWORK_POLICY', 'ALTER_NETWORK_POLICY', 'DROP_NETWORK_POLICY')
        OR query_text ILIKE '% set network_policy%'
        OR query_text ILIKE '% unset network_policy%'
    )
    AND query_type NOT IN ('SELECT', 'UNKNOWN')
    AND (end_time > TO_TIMESTAMP_NTZ('{{last_value}}') )
ORDER BY
    end_time ASC;
admin_grants.sql: Retrieves events where an admin role is granted to a user from the SnowflakeACCOUNT_USAGEschema.
SELECT *, 'snowflake' AS source,
    user_name || ' made the following Network Policy change on ' || end_time || ' [' || query_text || ']' AS title,
FROM
    SNOWFLAKE.ACCOUNT_USAGE.query_history
WHERE
    execution_status = 'SUCCESS'
    AND (
        query_type IN ('CREATE_NETWORK_POLICY', 'ALTER_NETWORK_POLICY', 'DROP_NETWORK_POLICY')
        OR query_text ILIKE '% set network_policy%'
        OR query_text ILIKE '% unset network_policy%'
    )
    AND query_type NOT IN ('SELECT', 'UNKNOWN')
    AND (end_time > TO_TIMESTAMP_NTZ('{{last_value}}') )
ORDER BY
    end_time ASC;
db_modified.sql: Retrieves database modification events from the SnowflakeACCOUNT_USAGEschema.
SELECT *, 'snowflake' AS source,
    user_name || ' granted the ' || role_name || ' role on ' || end_time AS title,
    query_text AS statement,
FROM
    SNOWFLAKE.ACCOUNT_USAGE.QUERY_HISTORY
WHERE
    execution_status = 'SUCCESS'
    AND query_type = 'GRANT'
    AND query_text ILIKE '%grant%admin%to%'
    AND end_time > TO_TIMESTAMP_NTZ('{{last_value}}');
schema_modified.sql: Retrieves schema modification events from the SnowflakeACCOUNT_USAGEschema.
SELECT
    *,
    'snowflake' AS source,
    user_name || ' executed DB query ' || query_type || ' on ' || end_time AS title
FROM
    SNOWFLAKE.ACCOUNT_USAGE.QUERY_HISTORY
WHERE
    execution_status = 'SUCCESS'
    AND query_type IN (
        'CREATE',
        'DROP',
        'ALTER'
    )
    AND (query_text ILIKE '%DATABASE%')
    AND end_time > TO_TIMESTAMP_NTZ('{{last_value}}')
ORDER BY
    end_time ASC;
Note
You can monitor any required Snowflake events by generating an SQL query that matches the event and adding it to a file in the /etc/snowflake_logs/queries folder.Your SQL query must include 'snowflake' AS source in the SELECT condition, as seen in the examples above. This adds a column with ‘snowflake’ as the value to the results, making it easier to identify Snowflake logs within Wazuh.
The SQL query must also include a condition that tracks the state of the collected logs. This is a unique value that helps to track the last log that was queried; it is identified as last_value. An example is end_time or EVENT_ID.
- Create a Python script
snow_log_collector.pyin the/etc/snowflake_logs/directory to routinely pull Snowflake logs:
# touch /etc/snowflake_logs/snow_log_collector.py
- Add the following Python code to the script:
import os
import logging
import snowflake.connector
import pandas as pd
from dotenv import load_dotenv

load_dotenv()

# === Setup logging ===
logging.basicConfig(
    filename="/etc/snowflake_logs/script.log",
    level=logging.INFO,
    format="%(asctime)s - %(levelname)s - %(message)s",
)

# === Snowflake connection details (use env vars for security) ===
SNOWFLAKE_USER = os.getenv("SNOWFLAKE_USER")
SNOWFLAKE_PASSWORD = os.getenv("SNOWFLAKE_PASSWORD")
SNOWFLAKE_ACCOUNT = os.getenv("SNOWFLAKE_ACCOUNT")
SNOWFLAKE_WAREHOUSE = os.getenv("SNOWFLAKE_WAREHOUSE")
SNOWFLAKE_DATABASE = os.getenv("SNOWFLAKE_DATABASE")
SNOWFLAKE_SCHEMA = os.getenv("SNOWFLAKE_SCHEMA")

# === Paths ===
QUERY_DIR = "/etc/snowflake_logs/queries"
OUTPUT_DIR = "/etc/snowflake_logs/logs"
STATE_DIR = "/etc/snowflake_logs/state"

os.makedirs(OUTPUT_DIR, exist_ok=True)
os.makedirs(STATE_DIR, exist_ok=True)

# === Connect to Snowflake ===
try:
    conn = snowflake.connector.connect(
        user=SNOWFLAKE_USER,
        password=SNOWFLAKE_PASSWORD,
        account=SNOWFLAKE_ACCOUNT,
        warehouse=SNOWFLAKE_WAREHOUSE,
        database=SNOWFLAKE_DATABASE,
        schema=SNOWFLAKE_SCHEMA,
    )
    cursor = conn.cursor()
except Exception as e:
    logging.error(f"Failed to connect to Snowflake: {e}")
    raise


def get_last_value(state_file):
    """Read last processed ID/timestamp from state file."""
    if os.path.exists(state_file):
        with open(state_file, "r") as f:
            return f.read().strip()
    return None


def save_last_value(state_file, value):
    """Save last processed ID/timestamp to state file."""
    with open(state_file, "w") as f:
        f.write(str(value))


# === Loop through SQL files ===
for filename in os.listdir(QUERY_DIR):
    if filename.endswith(".sql"):
        query_path = os.path.join(QUERY_DIR, filename)
        output_file = os.path.join(OUTPUT_DIR, f"{os.path.splitext(filename)[0]}.json")
        state_file = os.path.join(STATE_DIR, f"{os.path.splitext(filename)[0]}.state")

        try:
            with open(query_path, "r") as f:
                base_query = f.read().strip()

            last_value = get_last_value(state_file)
            if last_value:
                # Assumption: query has a placeholder like {{last_value}}
                query = base_query.replace("{{last_value}}", last_value)
            else:
                query = base_query.replace("{{last_value}}", "0")  # default start

            logging.info(f"Running query from {filename} with last_value={last_value or 0}")
            cursor.execute(query)

            df = cursor.fetch_pandas_all()

            if not df.empty:
                # Append as NDJSON
                df.to_json(output_file, orient="records", lines=True, mode="a")

                # Update state with the max EVENT_ID or TIMESTAMP
                if "EVENT_ID" in df.columns:
                    new_last = df["EVENT_ID"].max()
                elif "TIMESTAMP" in df.columns:
                    new_last = df["TIMESTAMP"].max()
                elif "END_TIME" in df.columns:
                    new_last = df["END_TIME"].max()
                else:
                    raise ValueError("No EVENT_ID or TIMESTAMP column found for tracking")

                save_last_value(state_file, new_last)
                logging.info(f"Appended {len(df)} rows to {output_file}, new last_value={new_last}")
            else:
                logging.info(f"No new rows for {filename}")

        except Exception as e:
            logging.error(f"Error processing {filename}: {e}")

# === Cleanup ===
cursor.close()
conn.close()
- Create an environment variable file to hold the Snowflake connection credentials:
# touch /etc/snowflake_logs/.env
- Add the following configuration to the
/etc/snowflake_logs/.envfile. Replace the variables with the values gotten from the Configuring Snowflake log export section:
SNOWFLAKE_USER="<USER>"
SNOWFLAKE_PASSWORD="<PASSWORD>"
SNOWFLAKE_ACCOUNT="<ACCOUNT>"
SNOWFLAKE_WAREHOUSE="<DATA_WAREHOUSE_NAME>"
SNOWFLAKE_DATABASE="<DATABASE>"
SNOWFLAKE_SCHEMA="<SCHEMA>"
Replace:
<USER>with your Snowflake username.<PASSWORD>with your Snowflake account’s password.<ACCOUNT>with the account ID associated with your Snowflake account.<DATA_WAREHOUSE_NAME>with your selected Snowflake data warehouse name.<DATABASE>with the chosen Snowflake database.<SCHEMA>with the schema associated with your chosen Snowflake database.
Note
The execution of the snow_log_collector.py script creates a log file for each query in the /etc/snowflake_logs/logs directory.
- Append the following configuration to the Wazuh agent
/var/ossec/etc/ossec.conffile to ensure the script runs periodically, and the log file is ingested by the Wazuh agent.
<ossec_config>
  <wodle name="command">
    <disabled>no</disabled>
    <command>python3 /etc/snowflake_logs/snow_log_collector.py</command>
    <interval>5m</interval>
    <ignore_output>yes</ignore_output>
    <run_on_start>yes</run_on_start>
    <timeout>180</timeout>
  </wodle>

  <localfile>
    <log_format>json</log_format>
    <location>/etc/snowflake_logs/logs/*.json</location>
  </localfile>
</ossec_config>
Note
The <interval> setting controls the time between the command executions. You can adjust the setting as required.
- Restart the Wazuh agent to apply the configuration:
# systemctl restart wazuh-agent
Wazuh server
For this integration, no custom decoders are required because Wazuh automatically decodes logs in JSON format. Add the following custom rules to the Wazuh server to generate alerts when the Snowflake logs are received.
1. Navigate to Server management > Rules.
2. Click + Add new rules file.
3. Copy and paste the rules below and name the file snowflake_rules.xml, then click Save.
<!-- Rules to detect Snowflake events -->
<!-- Snowflake logs group -->
<group name="snowflake">
<rule id="110100" level="0">
<decoded_as>json</decoded_as>
<field name="SOURCE">snowflake</field>
<description>Logs from Snowflake</description>
</rule>
<!-- Rule to detect failed login attempts -->
<rule id="110101" level="10">
<if_sid>110100</if_sid>
<field name="EVENT_TYPE" type="pcre2">(?i)LOGIN</field>
<field name="IS_SUCCESS" type="pcre2">(?i)NO</field>
<description>Snowflake: Failed login attempt by $(USER_NAME)</description>
<mitre>
<id>T1110</id>
</mitre>
</rule>
<!-- Rule to detect admins with no MFA configured -->
<rule id="110102" level="10">
<if_sid>110100</if_sid>
<field name="TITLE">admin_no_mfa</field>
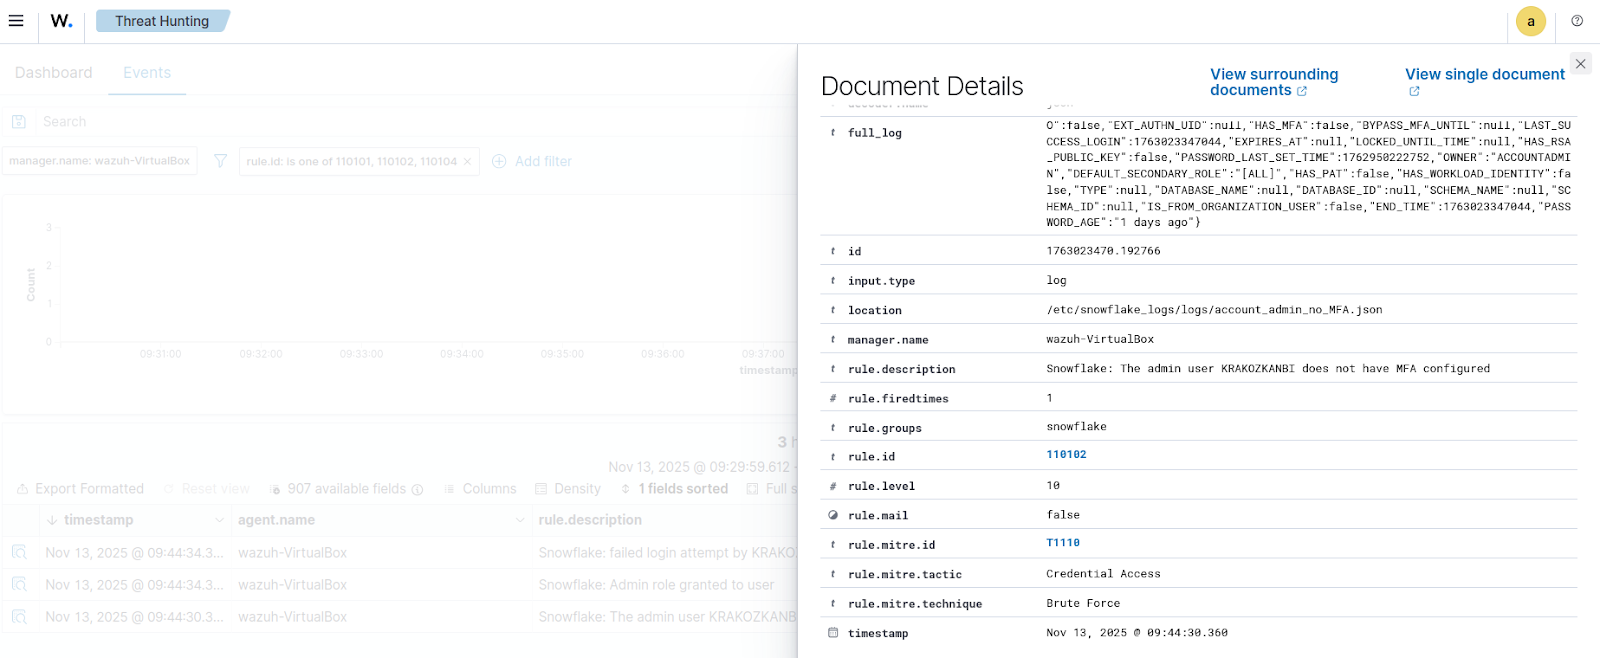
<description>Snowflake: The admin user $(LOGIN_NAME) does not have MFA configured</description>
<mitre>
<id>T1110</id>
</mitre>
</rule>
<!-- Rule to detect network policy changes -->
<rule id="110103" level="10">
<if_sid>110100</if_sid>
<field name="TITLE">made the following Network Policy change</field>
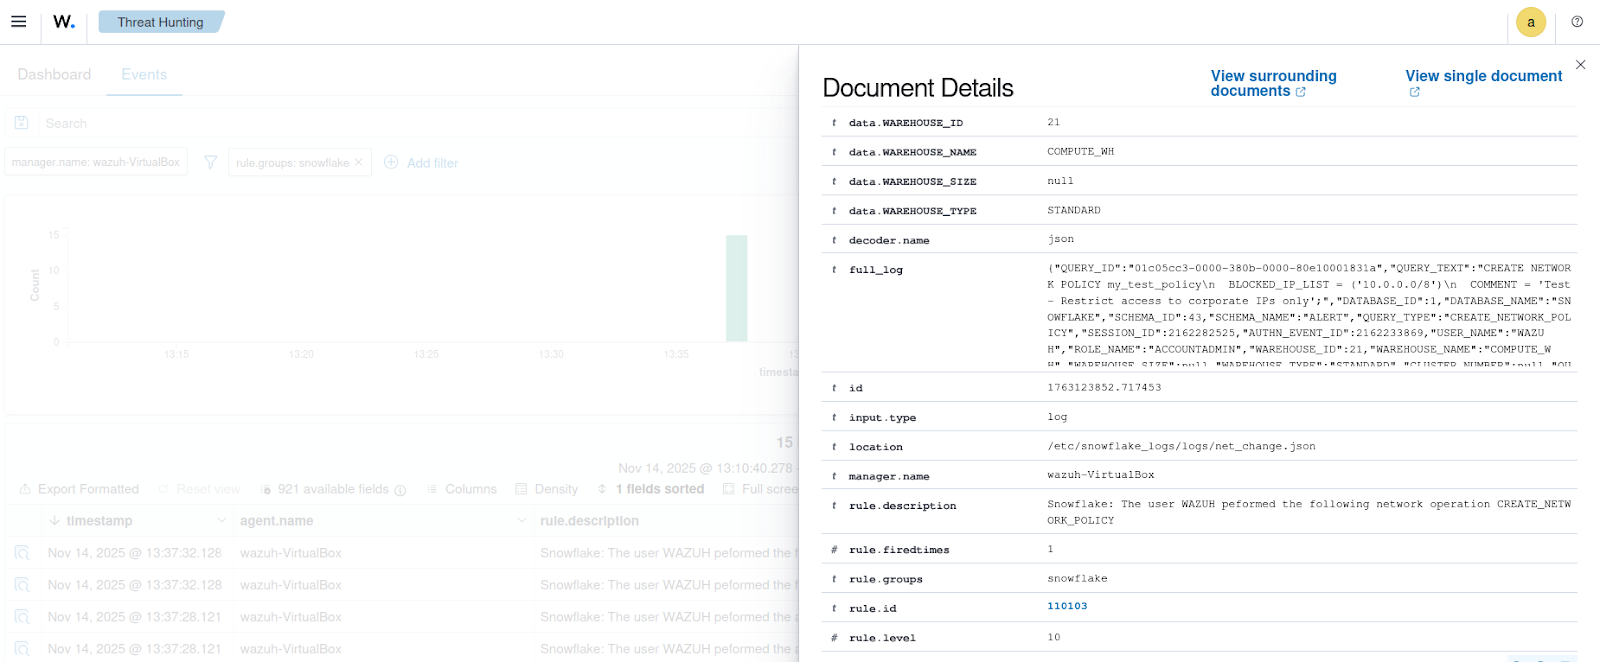
<description>Snowflake: The user $(USER_NAME) performed the following network operation $(QUERY_TYPE)</description>
</rule>
<!-- Rule to detect an admin role granted to a user -->
<rule id="110104" level="10">
<if_sid>110100</if_sid>
<field name="TITLE" type="pcre2">granted the .* role on</field>
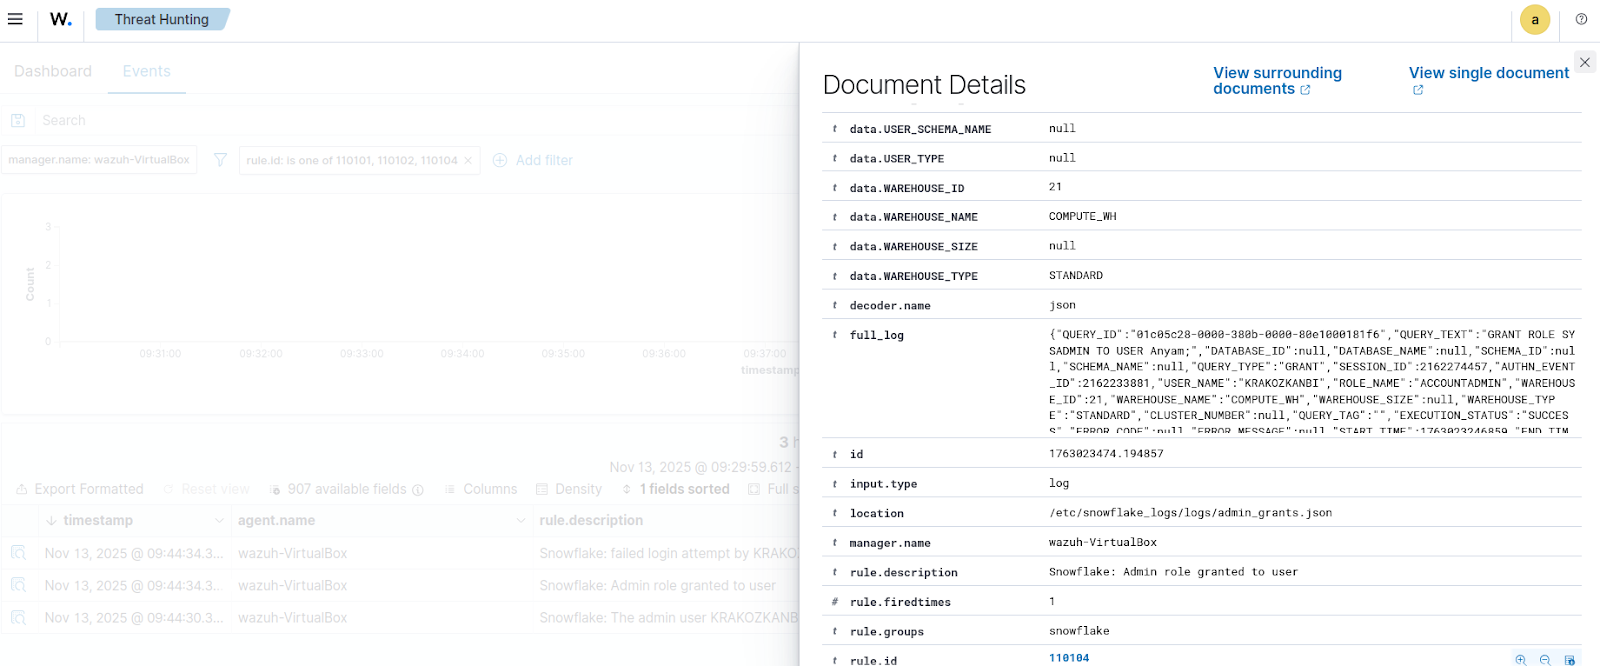
<description>Snowflake: Admin role granted to user</description>
<mitre>
<id>TA0004</id>
</mitre>
</rule>
<!-- Rule to detect when a DB is modified -->
<rule id="110105" level="10">
<if_sid>110100</if_sid>
<field name="TITLE" type="pcre2">executed DB query</field>
<description>Snowflake: The user $(USER_NAME) performed the action $(QUERY_TYPE) on a database</description>
</rule>
<!-- Rule to detect when a Schema is modified -->
<rule id="110106" level="10">
<if_sid>110100</if_sid>
<field name="TITLE" type="pcre2">executed schema query</field>
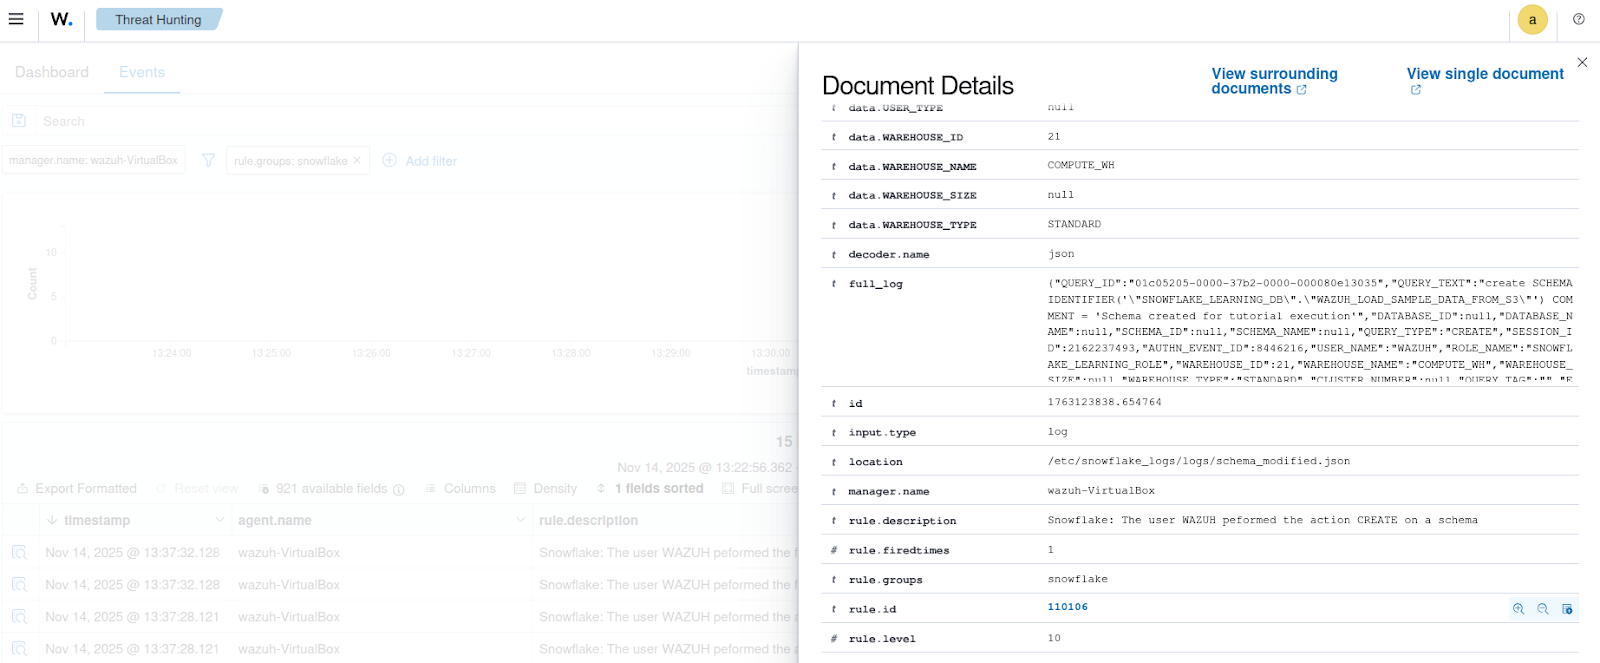
<description>Snowflake: The user $(USER_NAME) performed the action $(QUERY_TYPE) on a schema</description>
</rule>
</group>
Where:
- Rule ID
110100groups Snowflake logs. - Rule ID
110101identifies failed login attempts from users. - Rule ID
110102is triggered when the admin user has not configured Multi-factor authentication (MFA). - Rule ID
110103is triggered when a network policy has been created or modified. - Rule ID
110104is triggered when the account admin role is granted to a user. - Rule ID
110105is triggered when a database has been created or modified. - Rule ID
110106is triggered when a schema has been created or modified.
4. Click Reload to apply the changes.
Testing the integration
Perform the following steps on the Snowflake account to validate the integration.
1. Attempt to sign into your Snowflake account using an incorrect password.
2. Navigate to Project > Worksheet > SQL Worksheet and run the following query to create a test user, new_user:
USE ROLE SECURITYADMIN;

CREATE USER new_user
  PASSWORD = 'StrongP@ssw0rd!'
  LOGIN_NAME = 'new_user'
  MUST_CHANGE_PASSWORD = TRUE
  COMMENT = 'Admin user for platform management';
3. Run the following query on the worksheet to grant an admin role to the user, new_user:
GRANT ROLE SYSADMIN TO USER new_user;
4. Run the following query to create a test network policy, my_test_policy:
USE ROLE ACCOUNTADMIN;

CREATE NETWORK POLICY my_test_policy
  BLOCKED_IP_LIST = ('10.0.0.0/8')
  COMMENT = 'Test - Restrict access to corporate IPs only';
5. Run the following query to create a test database, test_db:
USE ROLE ACCOUNTADMIN;

CREATE DATABASE test_db
  COMMENT = 'Database for testing';
6. Run the following query to create a test schema, my_schema in the test_db database:
CREATE SCHEMA test_db.my_schema;
Detection results
Follow the steps below to view the alerts generated on the Wazuh dashboard.
1. Navigate to Threat intelligence > Threat Hunting and click the Events tab.
2. Click + Add filter. Then filter by rule.groups.
3. In the Operator field, select is.
4. In the Value field, input snowflake.
5. Click Save.
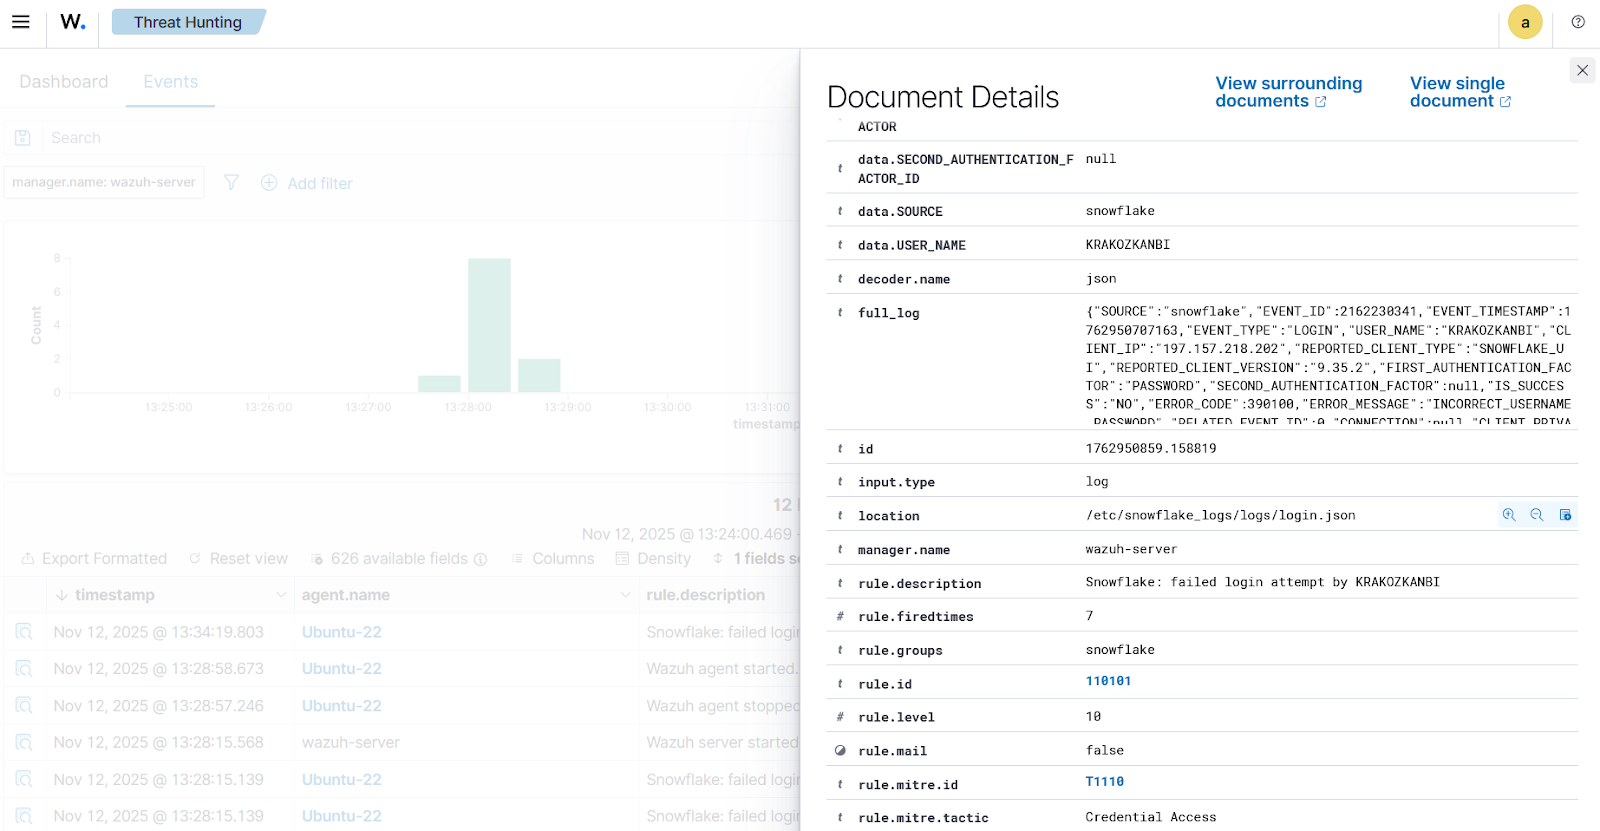
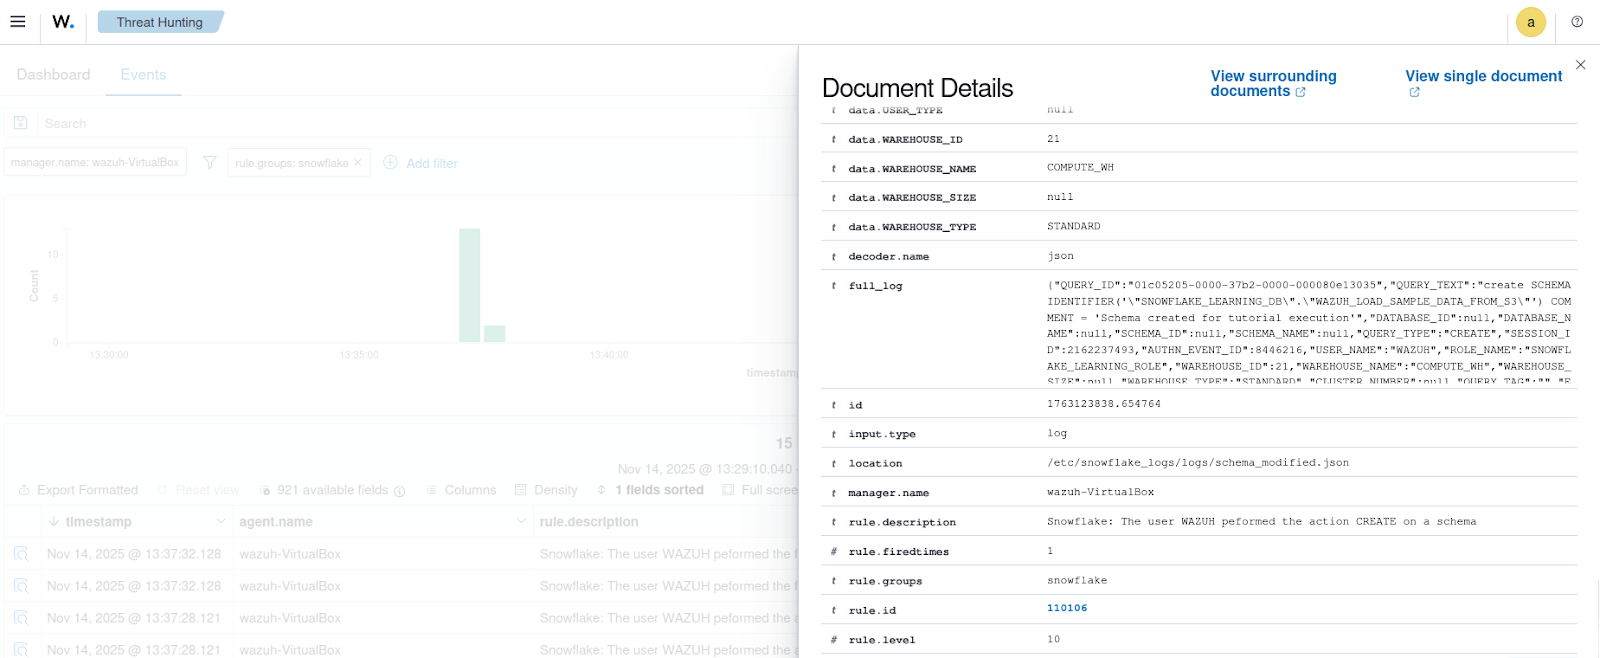
The figures below show the related Snowflake alerts on the Wazuh dashboard.
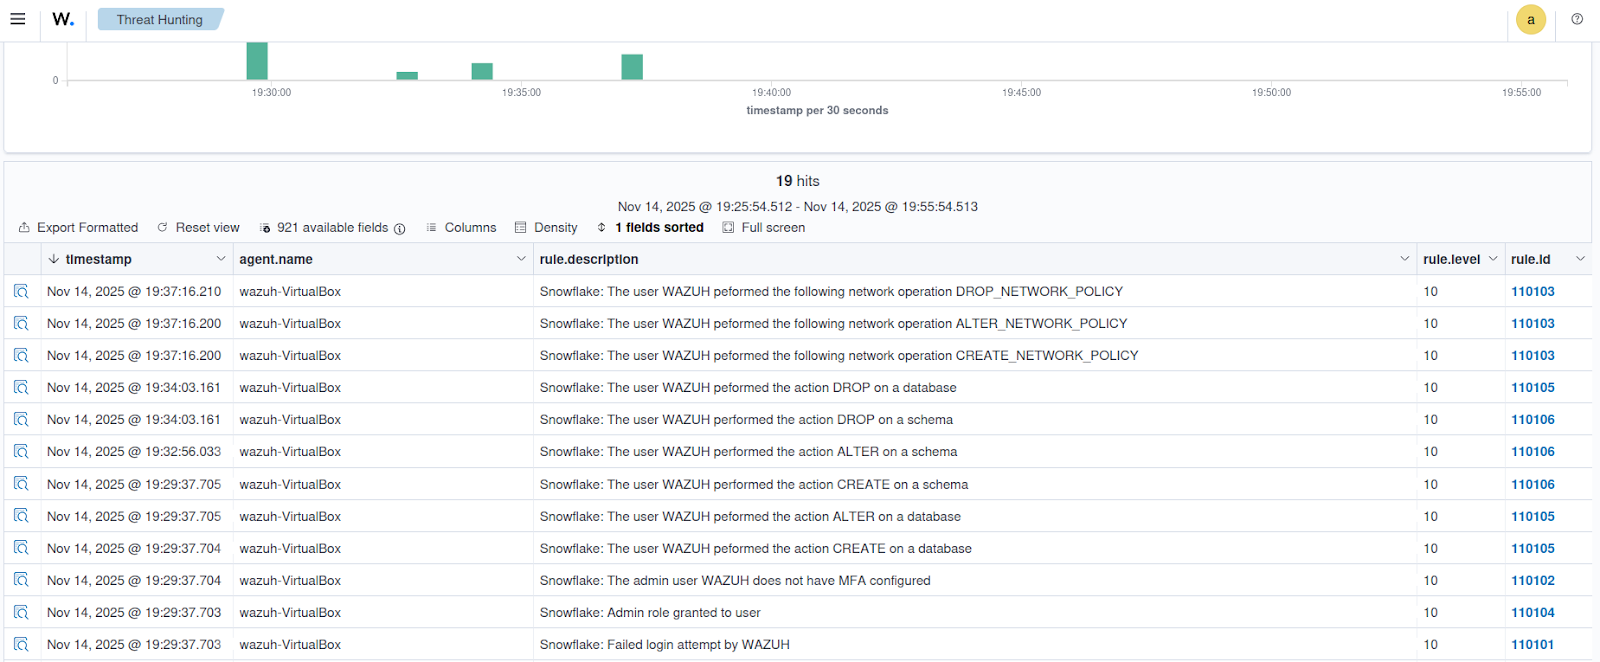
Click the Inspect document details button at the far left of the alerts to view the details.
Conclusion
This blog post demonstrates how to integrate and monitor Snowflake data warehouse with Wazuh. This integration helps achieve visibility and control over sensitive data in modern, cloud-driven environments.
By exporting Snowflakes logs to Wazuh, organizations gain the ability to correlate activity across platforms, detect threats in real time, and respond quickly to potential incidents.
If you have any questions about this blog post or Wazuh, we invite you to join our community, where our team will be happy to assist you.