Monitoring application metrics such as error rate, memory usage, and CPU usage is useful for early anomaly detection and maintaining system health. These metrics offer insights into how software behaves under different conditions, such as during peak user activity, helping teams to identify issues early. While traditional monitoring often centers on the endpoint’s health, application-level metrics provide deeper insight into how the software is performing under varying conditions.
OpenTelemetry (OTel) is an open source observability framework that provides a standard way to generate, collect, and export telemetry data, including metrics, logs, and traces, directly from applications.
For telemetry data to be actionable, it needs to be collected, transformed, and routed to the appropriate platform. Data Prepper is an open source data ingestion and transformation pipeline that collects, filters, and enriches observability data before forwarding it to the target system. In this setup, Data Prepper transforms OpenTelemetry metrics into a format that Wazuh can parse and index alongside security events.
Ingesting application metrics into Wazuh enables teams to monitor both performance and security data from a single platform. This reduces the need to maintain multiple platforms and simplifies operational overhead.
This blog post demonstrates how to analyze application metrics into Wazuh using OpenTelemetry and Data Prepper. This approach enables you to analyze performance metrics with security events on the Wazuh platform.
Infrastructure
We use the following infrastructure to demonstrate OTel metrics ingestion into Wazuh using Data Prepper.
- A pre-built, ready-to-use Wazuh OVA 4.14.0. Follow this Wazuh OVA installation guide to download the virtual machine.
- An Ubuntu 24.04 endpoint which will serve as the application server, with:
- Wazuh agent 4.14.0 installed and enrolled into the Wazuh server.
- Docker and Docker Compose installed.
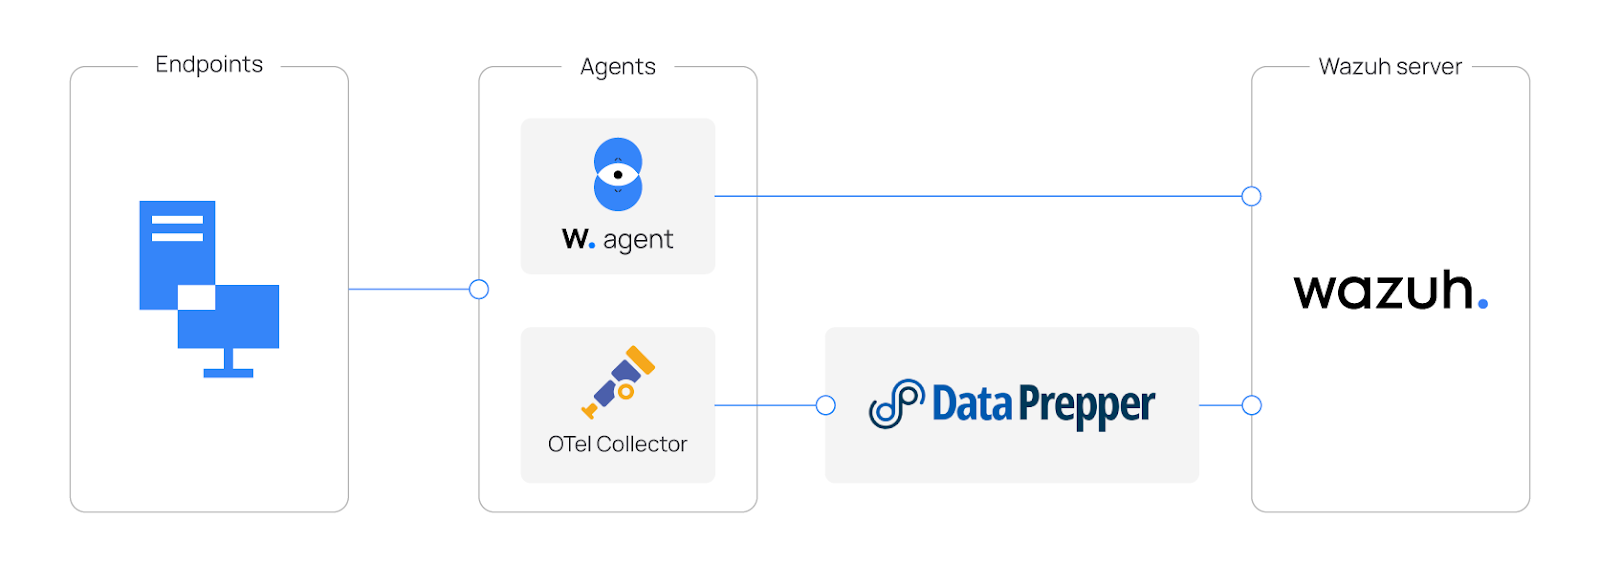
As shown above, the Wazuh agent forwards security events like intrusion detection, log analysis, vulnerability detection, and configuration assessment to the Wazuh server. An application instrumented with OTel standards exports metrics to the OpenTelemetry Collector. The OpenTelemetry Collector gathers performance metrics, which Data Prepper parses and forwards to the Wazuh indexer, enabling a unified platform for application performance and security.
Configuration
To demonstrate this ingestion, we first configure the Wazuh indexer to allow external communication with Data Prepper on port 9200. Then, we deploy an application instrumented with the OpenTelemetry standard, along with an OpenTelemetry Collector and Data Prepper, on the Ubuntu endpoint. Finally, we create the metrics-otel-v1* index on the Wazuh indexer using the Wazuh dashboard.
Wazuh server
Perform the following steps on the Wazuh server endpoint:
- Update the
network.hostparameter in the/etc/wazuh-indexer/opensearch.ymlconfiguration file:
network.host: "127.0.0.1,<WAZUH_INDEXER_IP>"
Replace <WAZUH_INDEXER_IP> with the IP address of the Wazuh Indexer.
This configuration allows the Wazuh indexer to listen on both the localhost interface and the specified server IP, enabling external connections and local access.
- Restart the Wazuh indexer to apply the changes:
# systemctl restart wazuh-indexer
Wazuh dashboard
Perform the following steps on the Wazuh dashboard:
Create an internal user
We create an internal user to securely handle the connection between the Wazuh indexer and Data Prepper.
- Navigate to Indexer management > Security > Internal users and click Create internal user.
- Enter a username and a strong password in the username and password fields. This will be required later when configuring Data Prepper.
- Click Create.
Create a role and map the internal user
We create a dedicated role and assign it specific privileges to control what Data Prepper can access within the Wazuh indexer.
- Navigate to Indexer management > Security > Roles and click Create Role.
- Enter
otel-rolein the Name field. Selectcluster_all,indices:admin/template/get, andindices:admin/template/putin the Cluster permissions field. - Enter
metrics-otel-v1*in the Index field. Selectindices_allin the Index permissions field. - Click Add another index permission.
- Enter
.opendistro-ism-configin the Index field. Selectindices_allin the Index permissions field. - Click Add another index permission.
- Enter
*in the Index field. Selectmanage_aliasesin the Index permissions field. - Click Create.
- Navigate to Mapped users and click Map users.
- Select the internal user you created and click Map.
Ubuntu endpoint
Perform the following steps on the Ubuntu endpoint:
- Generate SSL certificates
- Configure OpenTelemetry Collector
- Configure Data Prepper
- Configure and deploy services with Docker Compose
Generate SSL certificates
We generate SSL certificates to ensure secure communication between the OpenTelemetry Collector and Data Prepper.
- Create a
certsdirectory at/opt/data-prepperand switch into it:
# mkdir -p /opt/data-prepper/certs && cd /opt/data-prepper/certs
- Create a private certificate authority (CA):
# openssl genrsa -out ca.key 4096
# openssl req -x509 -new -nodes -key ca.key -sha256 -days 365 \
  -subj "/CN=MyCompany Root CA" -out ca.crt
- Generate a key for Data Prepper:
# openssl genrsa -out data-prepper.key 2048
- Create a SAN (Subject Alternative Names) configuration:
# cat > san.cnf <<EOF
[req]
req_extensions = v3_req
distinguished_name = dn
[dn]
[v3_req]
subjectAltName = @alt_names
[alt_names]
DNS.1 = data-prepper
DNS.2 = localhost
EOF
- Create a CSR (Certificate Signing Request):
# openssl req -new -key data-prepper.key \
  -subj "/CN=data-prepper" \
  -out data-prepper.csr
- Sign the CSR:
# openssl x509 -req -in data-prepper.csr -CA ca.crt -CAkey ca.key -CAcreateserial \
  -out data-prepper.crt -days 365 -sha256 -extensions v3_req -extfile san.cnf
- Grant read permissions to the
data-prepper.crtfile so that Data Prepper can use it:
# chmod 644 data-prepper.crt
Configure OpenTelemetry Collector
The OpenTelemetry Collector is responsible for collecting metrics from the instrumented application and shipping them to Data Prepper for further processing.
- Create the OpenTelemetry Collector configuration file
otel-collector-config.yamlin the/opt/data-prepperdirectory and insert the following:
receivers:
  otlp:
    protocols:
      grpc:
        endpoint: 0.0.0.0:4317

processors:
  batch:

exporters:
  otlp/data-prepper:
    endpoint: data-prepper:21892
    tls:
      ca_file: /etc/certs/ca.crt

service:
  pipelines:
    metrics:
      receivers: [otlp]
      processors: [batch]
      exporters: [otlp/data-prepper]
Where:
endpoint: 0.0.0.0:4317defines the endpoint on which the Open Telemetry collector will receive metrics.endpoint: data-prepper:21892defines the endpoint to which the Open Telemetry collector will export metrics.
Configure Data Prepper
Configure Data Prepper to ingest, transform, and forward metrics to the Wazuh indexer.
- Create the Data Prepper pipeline file
pipeline.yamlin the/opt/data-prepperdirectory and insert the following:
entry-pipeline:
  source:
    otel_metrics_source:
      ssl: true
      sslKeyCertChainFile: /etc/certs/data-prepper.crt
      sslKeyFile: /etc/certs/data-prepper.key
      health_check_service: true
      port: 21892
  sink:
   - opensearch:
        hosts: ["https://<WAZUH_INDEXER_IP>:9200"]
        insecure: true
        username: "<WAZUH_INDEXER_USERNAME>"
        password: "<WAZUH_INDEXER_PASSWORD>"
        index_type: metric-analytics-plain
Replace:
<WAZUH_INDEXER_IP>with the IP address of the Wazuh indexer.<WAZUH_INDEXER_USERNAME>with the internal user created here.<WAZUH_INDEXER_PASSWORD>with the password of the internal user created here.
Configure and deploy services with Docker Compose
We use Docker Compose to start the OpenTelemetry Collector, Data Prepper, and a sample application instrumented with the OpenTelemetry framework for testing.
- Create the Docker compose file
compose.yamlin the/opt/data-prepperdirectory and insert the following:
services:
  otel-collector:
    image: "otel/opentelemetry-collector-contrib:0.128.0"
    volumes:
      - ./otel-collector-config.yaml:/etc/otelcol-contrib/config.yaml
      - ./certs/ca.crt:/etc/certs/ca.crt
    ports:
      - "4317:4317"
    depends_on:
      data-prepper:
        condition: service_healthy

  data-prepper:
    image: "opensearchproject/data-prepper:2.12.0"
    volumes:
      - ./pipeline.yaml:/usr/share/data-prepper/pipelines/pipelines.yaml
      - ./certs/data-prepper.crt:/etc/certs/data-prepper.crt
      - ./certs/data-prepper.key:/etc/certs/data-prepper.key
    ports:
      - "21892:21892"
    healthcheck:
      test: ["CMD-SHELL", "echo > /dev/tcp/localhost/21892"]
      interval: 30s
      timeout: 5s
      retries: 5
The compose.yaml file above includes the services described below:
data-prepper: Acts as the central pipeline for ingesting, processing, and exporting telemetry data.otel-collector: Acts as an agent for collecting telemetry data.
- Create a separate Docker compose file
compose-sample-app.yamlin the/opt/data-prepperdirectory, with the following content to set up the demo application for monitoring:
services:
  sample-app:
    image: "jobri237/sample-flask-meter:1.0"
    ports:
      - "5000:5000"
    depends_on:
      otel-collector:
        condition: service_started
The compose-sample-app.yaml file above includes the services described below:
sample-app: A metrics-generating application, used here for demonstration purposes. It exposes the following metrics:http.server.request.count: Tracks the total number of incoming HTTP requests received by the application.http.server.response.errors: Counts HTTP responses with status codes in the4xxand5xxranges.http.server.bytes_sent: Measures the volume of data sent back to clients in HTTP responses.orders.created.total: A custom application metric that increments whenever the/orderendpoint is called.process.cpu.percent: Reports the CPU usage percentage for the running application.system.memory.usage: Captures the total amount of system memory currently in use, reported in bytes.system.load_average: Exports the system load average.open.ports.count: Shows the number of ports currently in a listening state (TCP/UDP).active_sessions: Maintains the count of in-memory sessions created through the API.
- Start the services from the
/opt/data-prepperdirectory:
# docker compose -f compose.yaml -f compose-sample-app.yaml up -d
Run the application
Perform the following steps on the Ubuntu endpoint to trigger metrics from the sample application.
- Generate HTTP traffic to increase
http.server.request.countandhttp.server.bytes_sent:
# curl http://localhost:5000/
- Simulate order creation to increment the custom business metric
orders.created.total:
# curl -X POST http://localhost:5000/order
- Create a session to add a new entry in memory and update
active_sessions:
# curl -X POST http://localhost:5000/session/create
The command output should be similar to the following:
{"session_id": "1733240923456"}
- Delete the session using the returned session ID to decrease
active_sessions:
# curl -X DELETE http://localhost:5000/session/delete/<SESSION_ID>
Replace <SESSION_ID> with the actual value from the creation step.
- Trigger an error response on a non-existing path to increase
http.server.response.errors:
# curl http://localhost:5000/does-not-exist
- Simulate system load with repeated requests to increase
process.cpu.percent,system.memory.usage, andsystem.load_average:
# for i in {1..50}; do curl -s http://localhost:5000/ > /dev/null; done
Viewing data on the Wazuh dashboard
In this section, we create the metrics-otel-v1* index in the Wazuh dashboard. We then build a saved search, create visualizations, and assemble a dashboard for a unified view of the application metrics.
Create an index pattern and a saved search
Perform the following steps on the Wazuh dashboard:
Create the index pattern
An index pattern tells the Wazuh dashboard which data fields are available and how to interpret them. Creating this index pattern ensures that Wazuh can discover and parse the OpenTelemetry metrics saved.
- Navigate to Dashboards management > Dashboards Management > Index patterns on the Wazuh dashboard.
- Click +Create index pattern and fill
metrics-otel-v1*in the index pattern name field. - Click Next step, set
timein the Time field drop-down list, and click Create index pattern.
Create a saved search
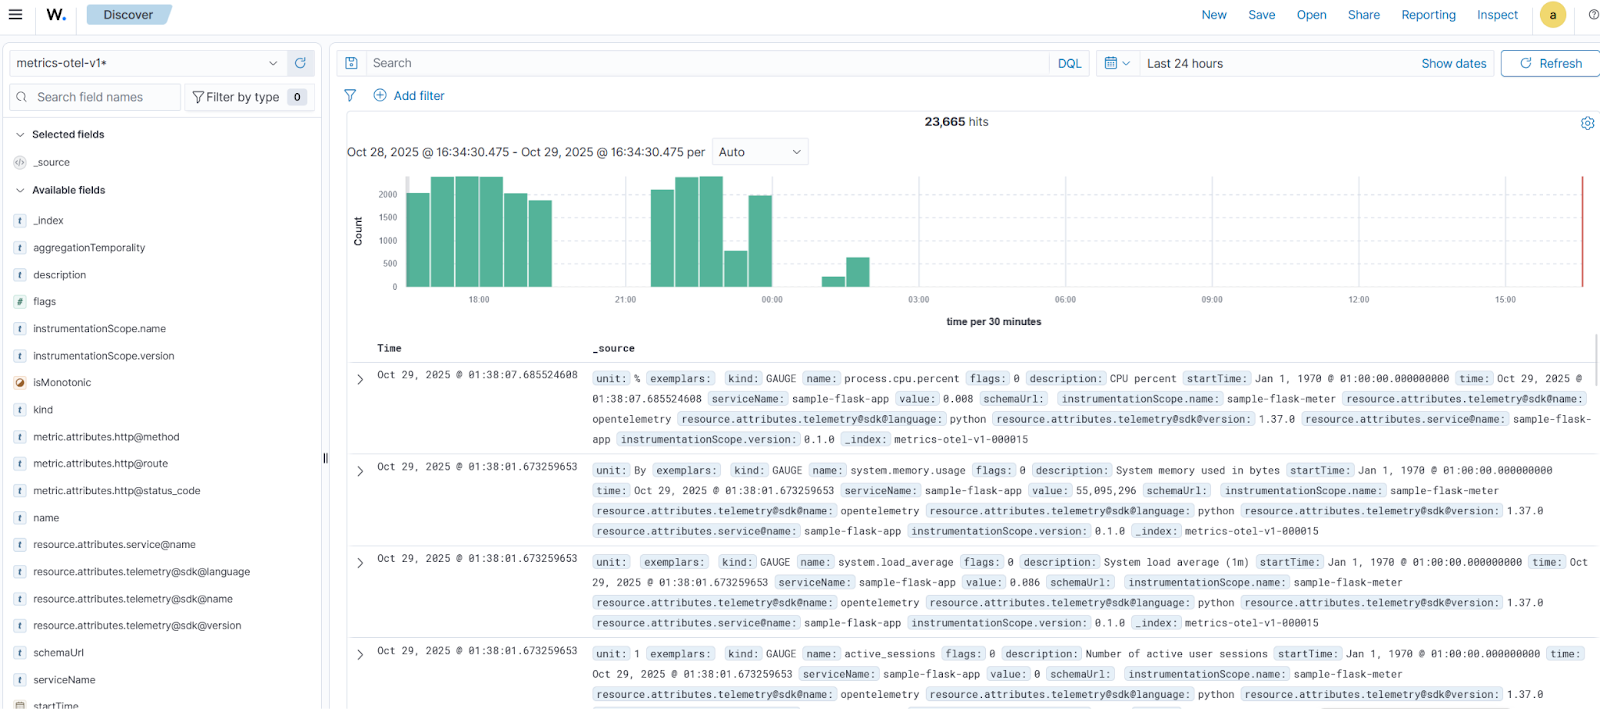
Applications can generate multiple metrics that operators or security teams might not initially be aware of. A saved search helps teams quickly review and understand which metrics the monitored application is sending before building dashboards.
- Navigate to Explore > Discover and select
metrics-otel-v1*as the index pattern name.
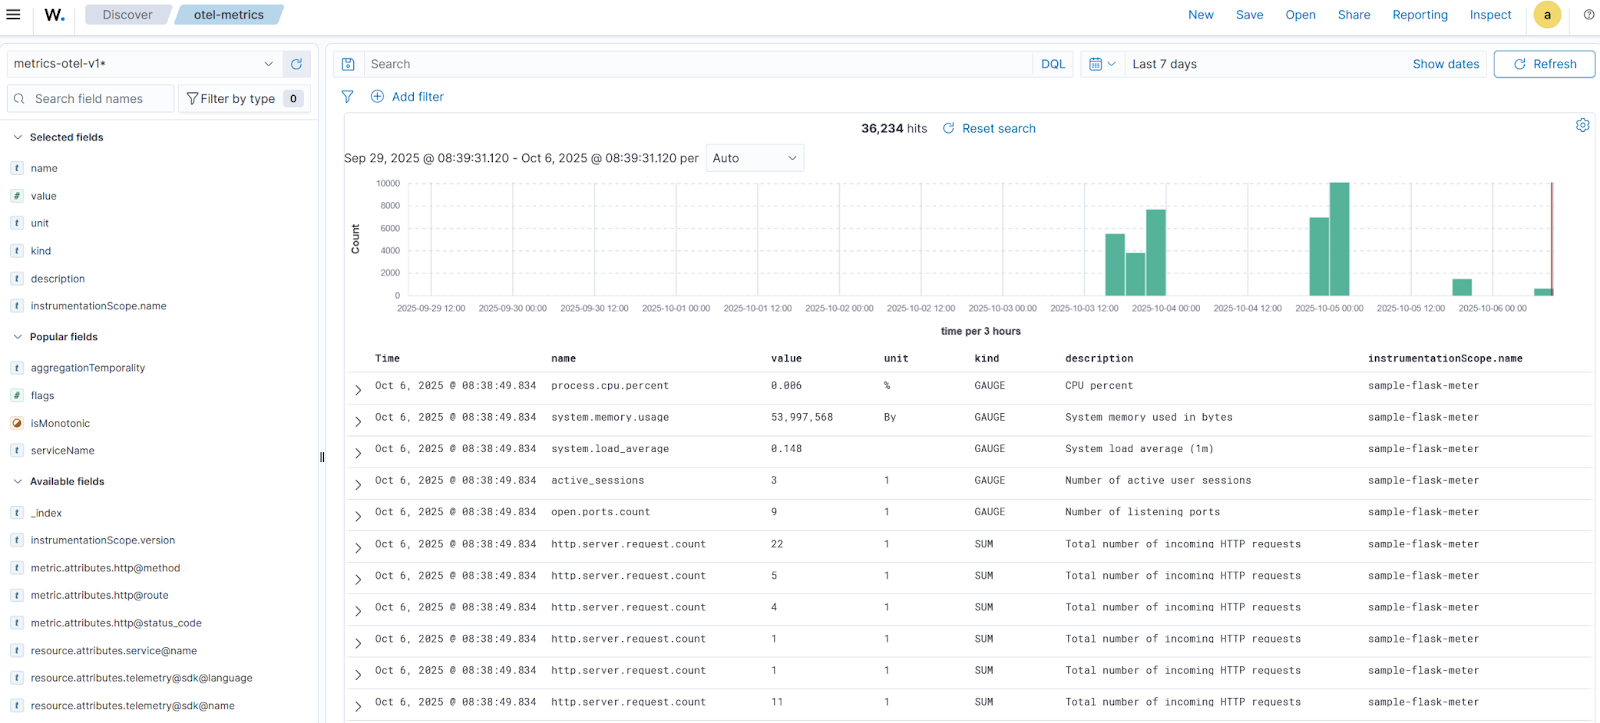
- Click Available fields. Then click + Add field as column on the following fields:
name,value,unit,kind,description,instrumentationScope.name.
Where:
name: identifies the metric namevalue: is the metric measurementunit: is the unit of measurementkind: indicates the type of metricdescription: explains the metricinstrumentationScope.name: shows the library or component produced by the metric
- Click Save, fill
otel-metricsas the Title, and click Save.
Create visualizations and dashboards
In this section, we create visualizations to understand better the metrics collected from our sample application.
You can create the following visualizations for each data type based on the relevant metrics for your monitored application. This approach applies to any monitored application by simply replacing the metric names with those generated by your application.
The following dashboard and visualizations are created based on the available fields in the saved search created above.
Click the upper-left menu icon ☰ and navigate to Explore > Dashboards > Create new Dashboard and add the following visualizations.
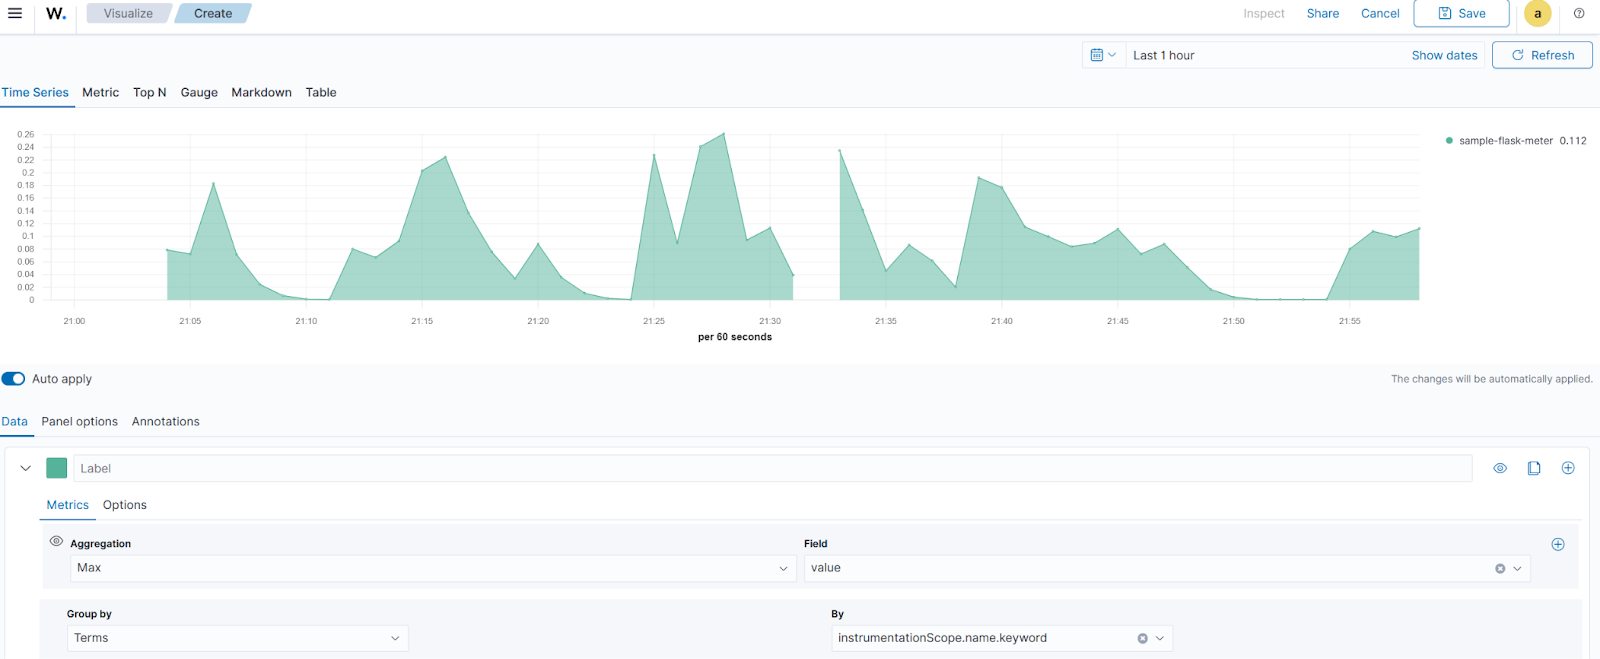
Gauge data type
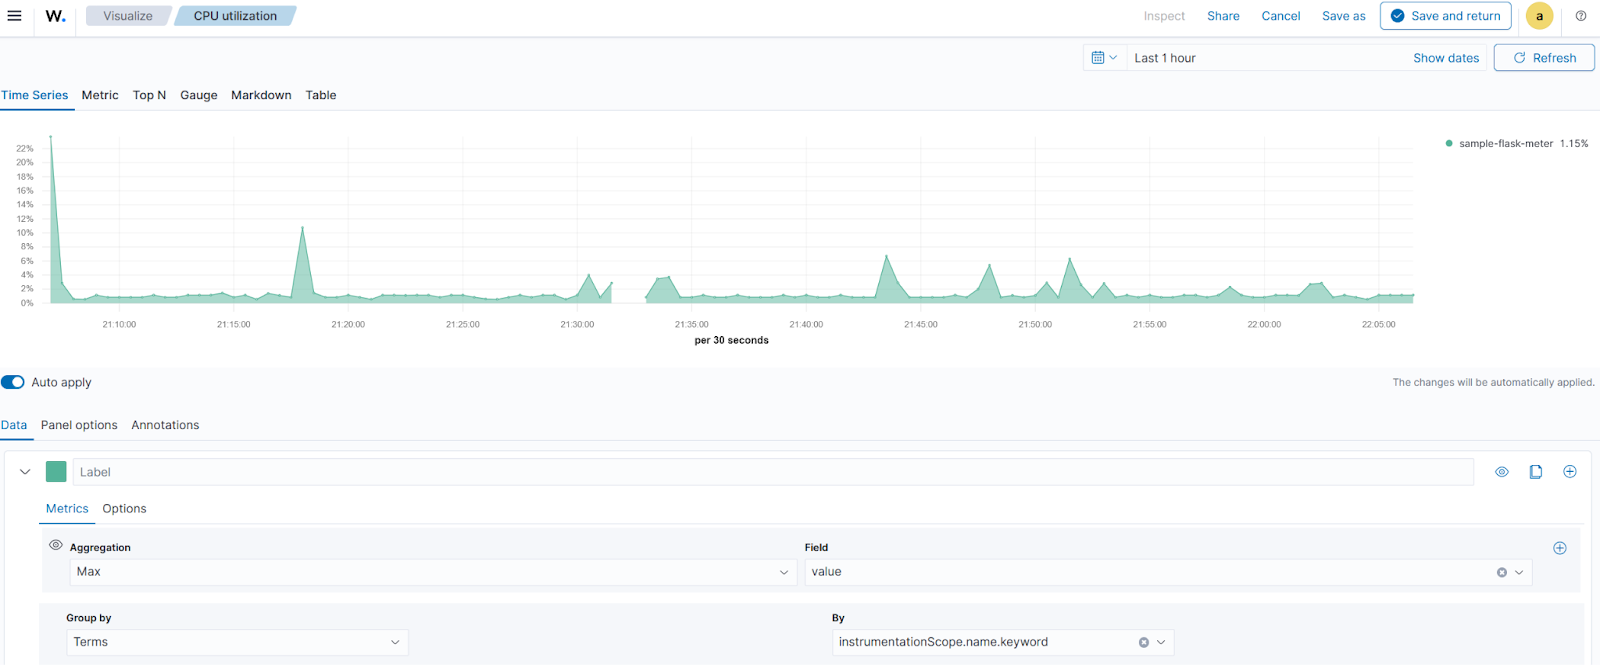
Gauge metrics represent a value sampled at a specific point in time, such as CPU or memory usage. To visualize them in the Wazuh dashboard:
- Click Create new and select the
TSVBvisualization on the New Visualization tab. - Navigate to Panel options:
- Set
metrics-otel-v1*under Index name. - Set
timeunder Time fieldand >=1munder Interval.
- Navigate to the Data > Metrics tab:
- Set
Maxunder Aggregation andvalueunder Field. - Set
Termsunder Group by andinstrumentationScope.nameunder By.
Process CPU usage
- Navigate to Panel Options, and set
name:process.cpu.percentunder Panel filter. - Navigate to Data > Options, and set
Percentunder Data Formatter. - Click Save, set
CPU usageunder Title, and click Save and return.
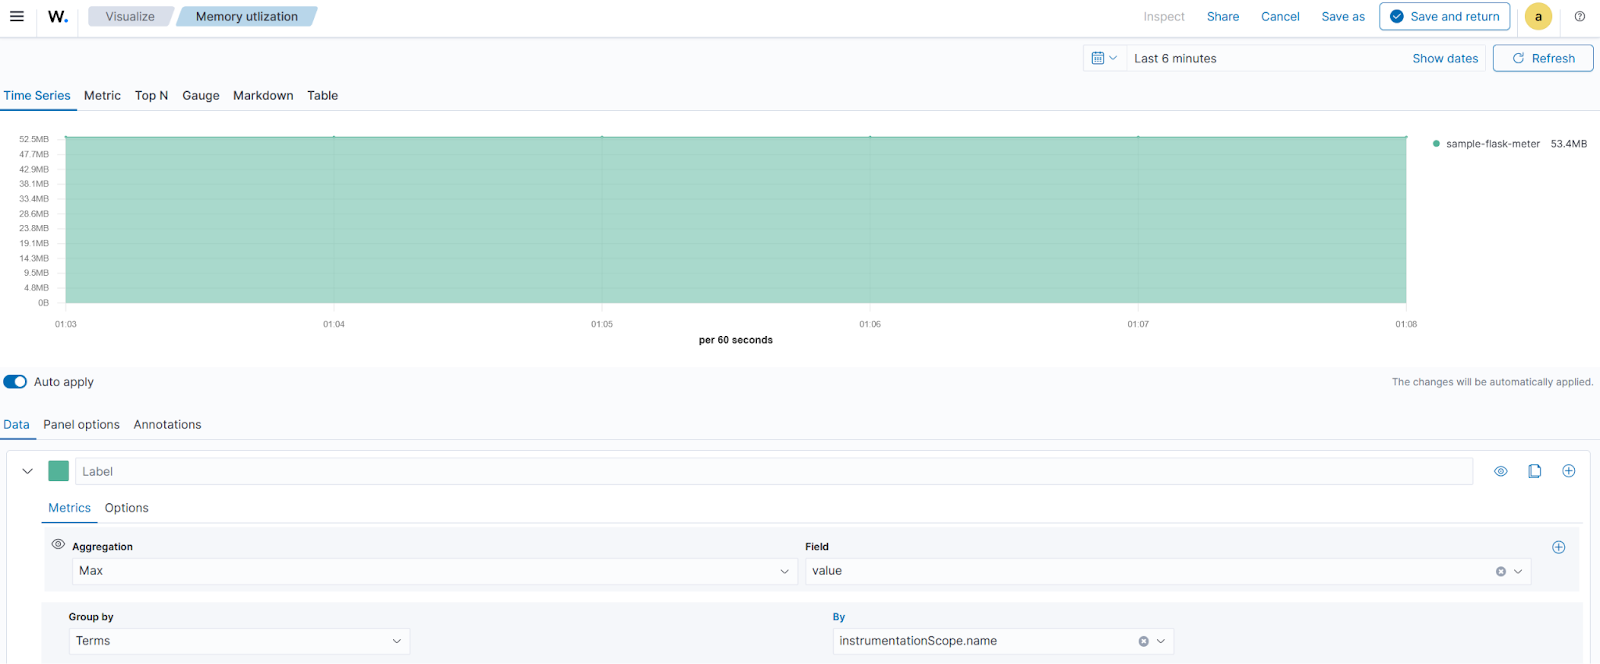
Process memory usage
Repeat steps 1 to 3 under the Gauge data type section, then:
- Navigate to Panel Options, and set
name:system.memory.usageunder Panel filter. - Navigate to Data > Options and set
Bytesunder Data Formatter. - Click Save, set
Memory usageunder Title, and click Save and return.
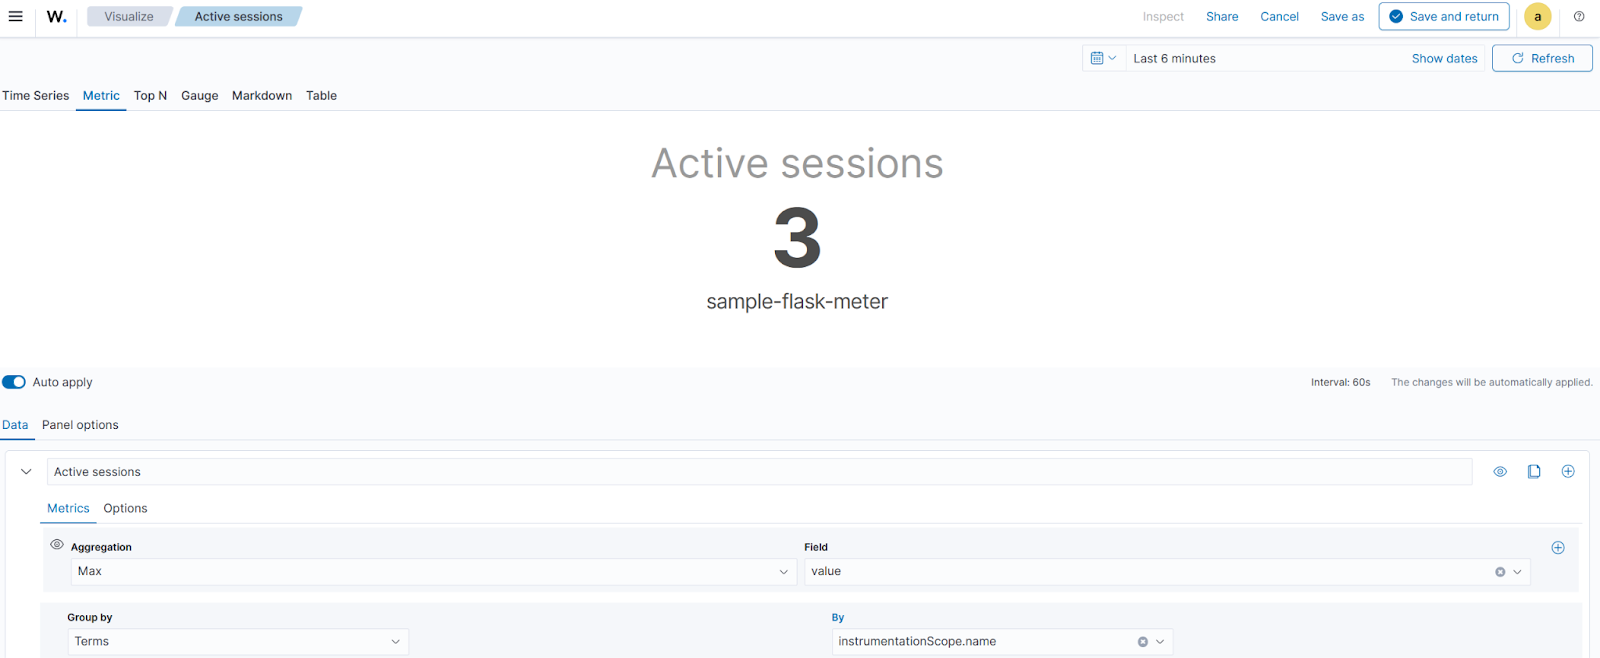
Number of active sessions
Repeat steps 1 to 3 under the Gauge data type section, then:
- Navigate to Panel Options, and set
name:active_sessionsunder Panel filter. - Navigate to the Metric tab, and set
Active sessionsunder Label. - Click Save, set
Active sessionsunder Title, and click Save and return.
Average load
Repeat steps 1 to 3 under the Gauge data type section, then:
- Navigate to Panel Options, and set
name:system.load_averageunder Panel filter. - Click Save, set
Average loadunder Title, and click Save and return.
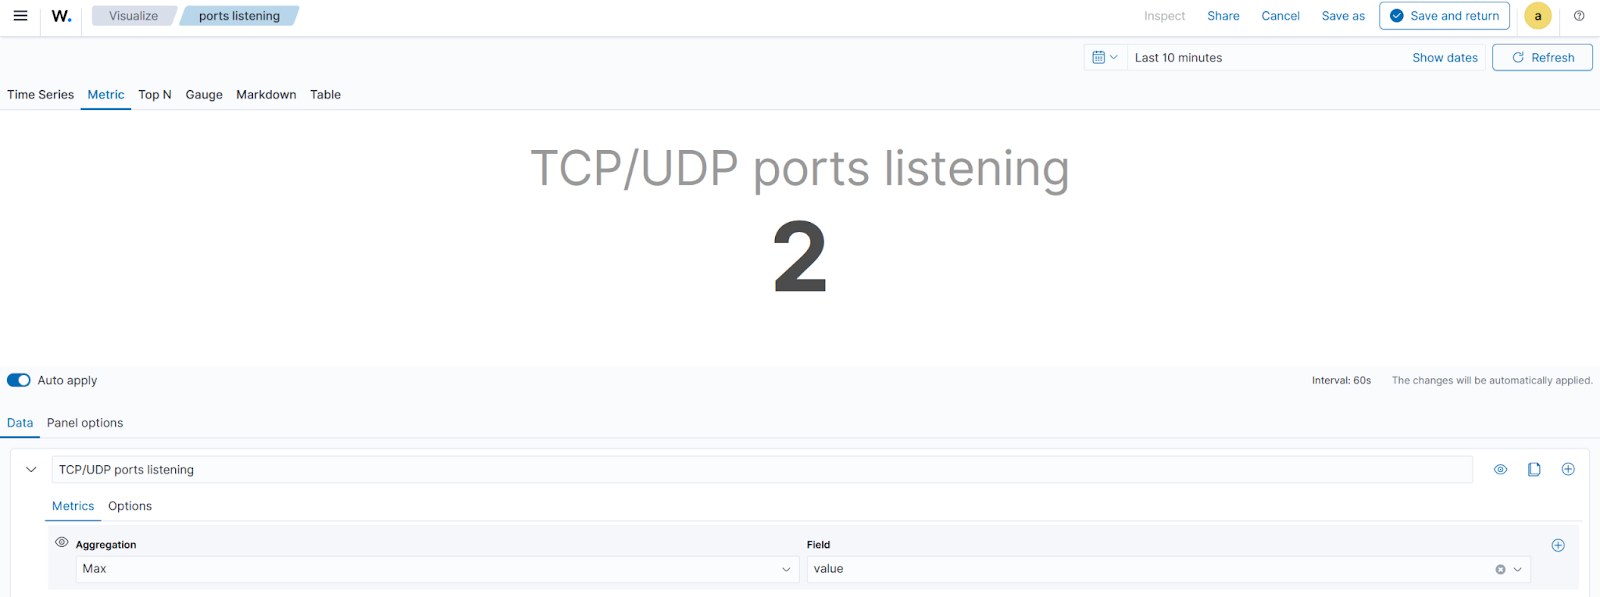
Ports in listening state
Repeat steps 1 to 3 under the Gauge data type section, then:
- Navigate to Panel Options, and set
name:open.ports.countunder Panel filter. - Navigate to the Metric tab, and set
TCP/UDP ports listeningunder Label. - Click Save, set
ports listeningunder Title, and click Save and return.
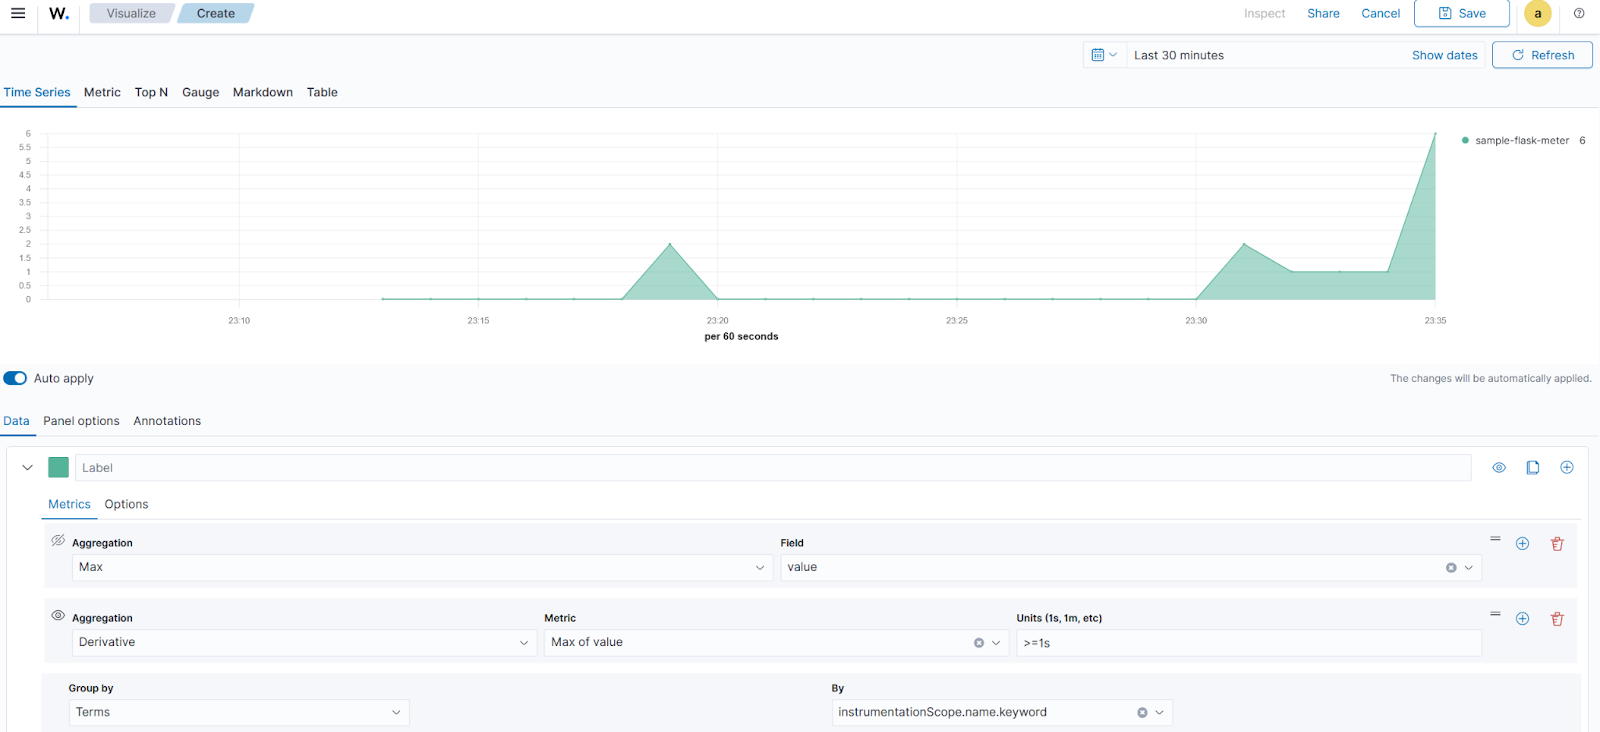
Sum data type
- Click Create new and select the
TSVBvisualization on the New Visualization tab. - Navigate to Panel options:
- Set
metrics-otel-v1*under Index name. - Set
timeunder Time field and>=1munder Interval.
- Navigate to the Data > Metrics tab:
- Set
Maxunder Aggregation andvalueunder Field. - Click +Add Metric, set
Derivativeunder Aggregation, andMax of valueunder Metric - Set
Termsunder Group by, andinstrumentationScope.nameunder By.
HTTP server request count
- Navigate to Panel Options, and set
name:http.server.request.countunder Panel filter. - Click Save, set
Request countunder Title, and click Save and return.
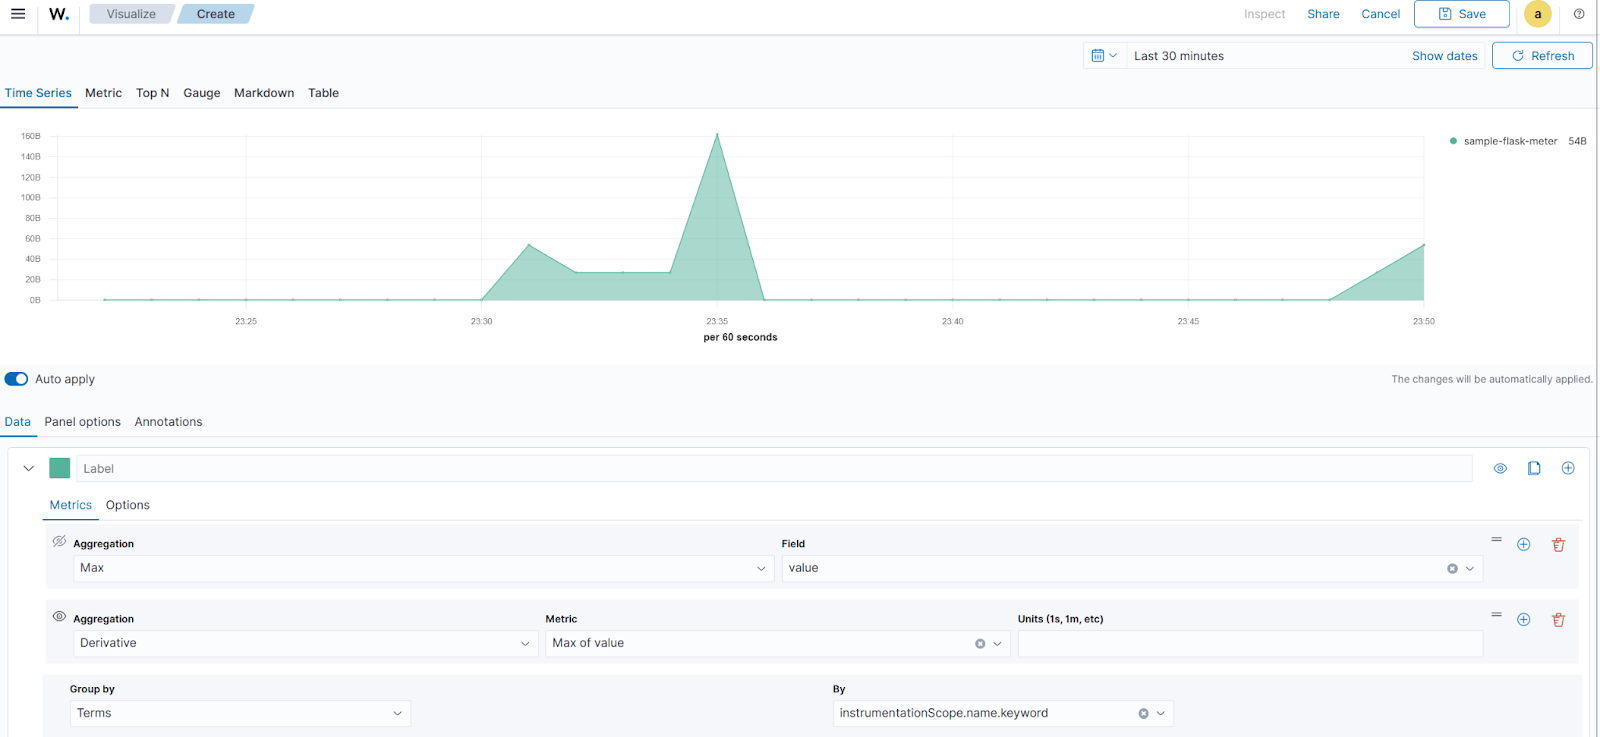
Server response size
Repeat steps 1 to 3, under the Sum data type section, then:
- Navigate to Data > Options and set
Bytesunder Data Formatter. - Navigate to Panel Options, and set
name:http.server.bytes_sentunder Panel filter. - Click Save, set
Serverresponse size under Title, and click Save and return.
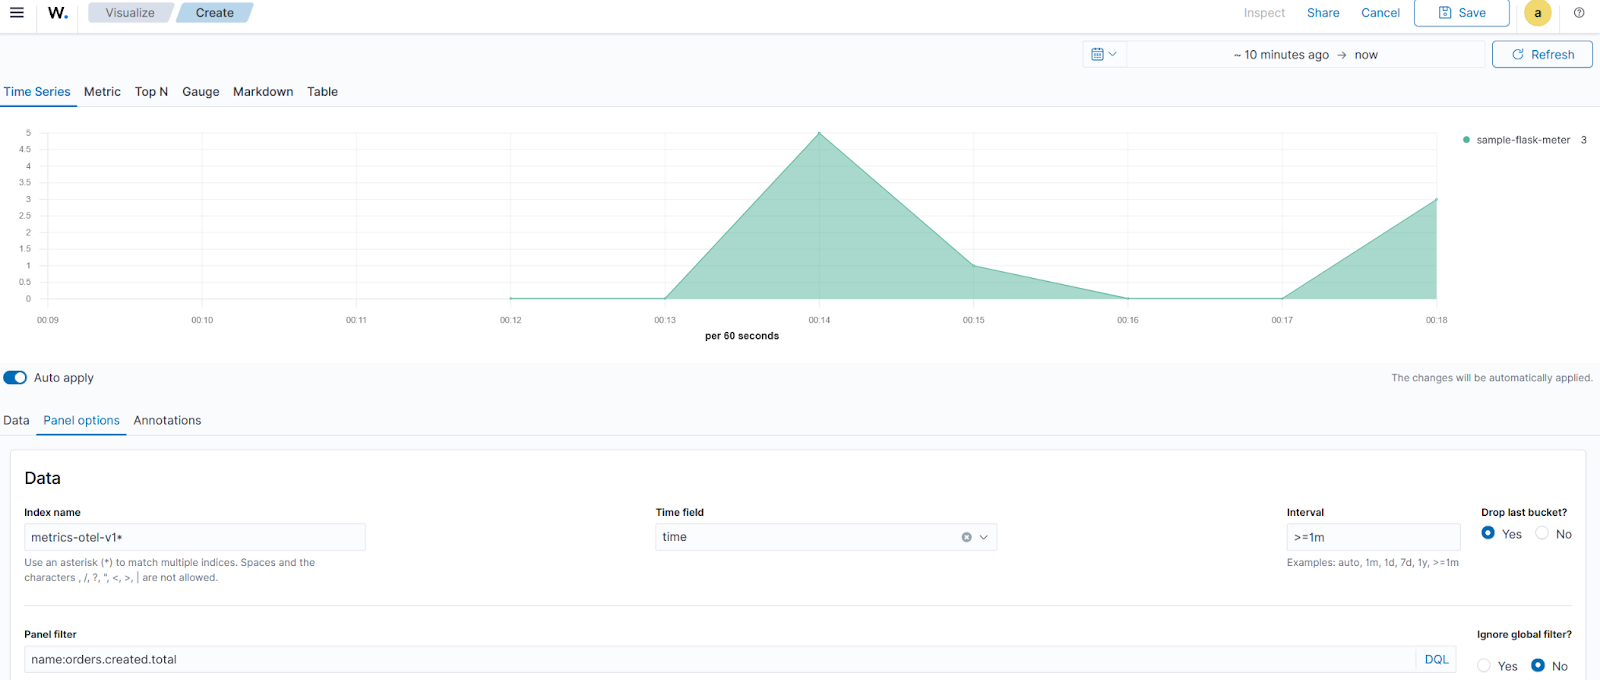
Orders created
Repeat steps 1 to 3 under the Sum data type section, then:
- Navigate to Panel Options, and set
name:orders.created.totalunder Panel filter. - Click Save, set
Orders createdunder Title, and click Save and return.
Finally, click Save and enter OTel metrics as the dashboard title, and then click Save. The GIF below shows the resulting dashboard:
Conclusion
Integrating OpenTelemetry with Wazuh through Data Prepper allows you to ingest and analyze application metrics alongside security data. This enables effective monitoring of both application performance and security from a single platform.
Wazuh is a free and open source security solution designed for threat detection, incident response, and compliance management. Wazuh continues to provide new integrations and capabilities, and has an active and supportive community.
To learn more, explore our documentation and blog posts.