SharpHound is a data collection tool, and BloodHound is an analysis and visualization tool; together, they help identify and visualize active directory (AD) trust relationships and privilege escalation paths within a network. SharpHound leverages the native Windows API and LDAP namespace functions to collect data from Domain controllers and domain-joined systems.
Such information includes what domain the active user belongs to, abused rights on ADs, and more. SharpHound extracts the sensitive information from the AD and archives this data as a single zip file.
System Administrators use SharpHound responsibly from a defensive standpoint to identify complex attack paths that may pose security risks within an active directory. However, SharpHound poses a significant risk when leveraged by threat actors seeking to gain deeper insights into a target Domain controller. In this blog post, we emulate SharpHound activities in an active directory environment and detect them using Wazuh.
Infrastructure
- A ready-to-use Wazuh OVA 4.4.4 virtual machine (VM). Follow this guide to download the virtual machine. This VM hosts the Wazuh central components (Wazuh server, Wazuh indexer, and Wazuh dashboard).
- A Windows server 2022 that acts as the Domain controller (DC). This server will run Wazuh agent 4.4.4. We used the domain name
wazuh.testfor our use case.
A Windows 11 endpoint with the Wazuh agent 4.4.4 installed and running. We register this endpoint in the wazuh.test domain, and it serves as the attacker’s foothold after compromise.
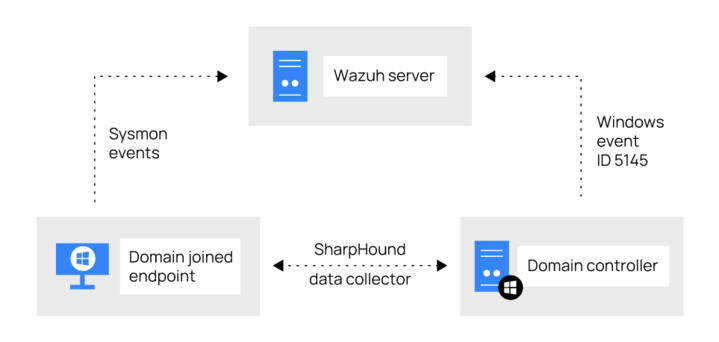
Figure 1: Logical representation of the infrastructure
Configuration
We enable the Windows event ID 5145 generation in the Group Policy Object (GPO) settings on the Domain controller. Event ID 5145 is the security policy for network file share auditing that records file or folder access actions. Next, we install Sysmon on the Windows 11 endpoint to detect events generated by SharpHound.
Domain controller
Wazuh agent configuration
1. Delete EventID !=5145 and from the <query> tags within the eventchannel block in the Wazuh agent configuration file C:\Program Files (x86)\ossec-agent\ossec.conf as shown below:
<localfile>
  <location>Security</location>
  <log_format>eventchannel</log_format>
  <query>Event/System[EventID !=5447 and EventID != 4670 and  EventID != 4690 and EventID != 4703 and EventID != 4907 and EventID != 5152 and EventID != 5147]</query>
</localfile>
Warning: Wazuh excludes event 5145 by default. However, event 5145 in this use case is necessary for monitoring and detecting activities related to network share objects.
2. Save the configuration file.
3. Restart the Wazuh agent to apply the configuration changes:
> Restart-Service -Name Wazuh
Group Policy Object configuration
Follow the steps below to enable event ID 5145 on the domain controller.
1. Open the Group Policy Management console by typing “gpmc.msc” in the Run dialog box or using the Start menu search.
2. Expand the Forest: <YOUR_DOMAIN_NAME> > Domains and click on <YOUR_DOMAIN_NAME>. Where <YOUR_DOMAIN_NAME> is the name of your domain.
3. Navigate to the Linked Group Policy Objects tab, right-click the existing Group Policy Object, and select EDIT. The GPO will open in the Group Policy Management Editor.
4. Navigate to Object Access within the Group Policy Management Editor; Computer Configuration > Policies > Windows Settings > Security Settings > Advanced Audit Policy Configuration > Audit Policies > Object Access.
5. Double-click on Audit Detailed File Share from the right pane to open its properties.
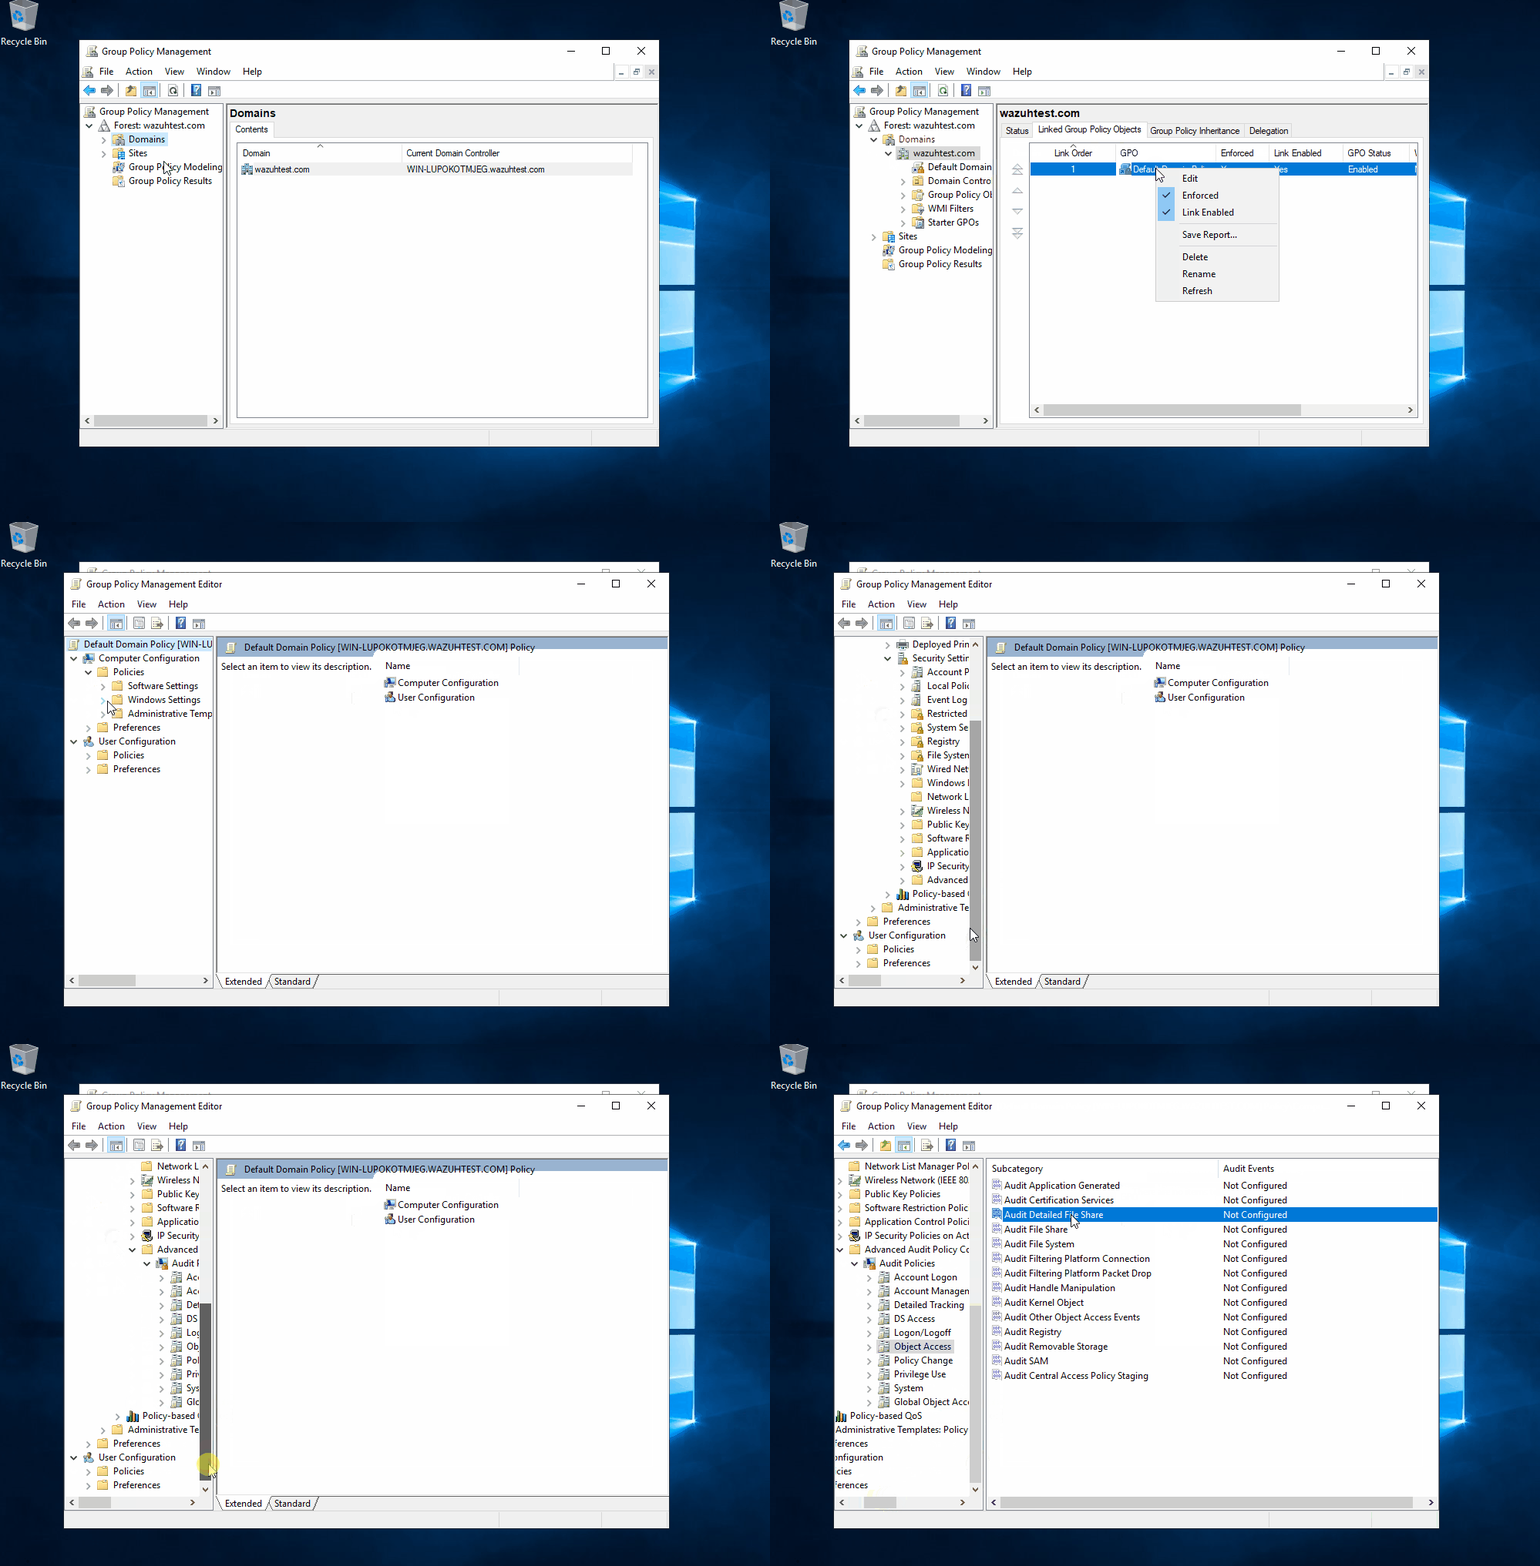
A graphical representation of steps 2 to 5
6. Check the options Configure the following audit events and Success to enable auditing for successful file and folder access.
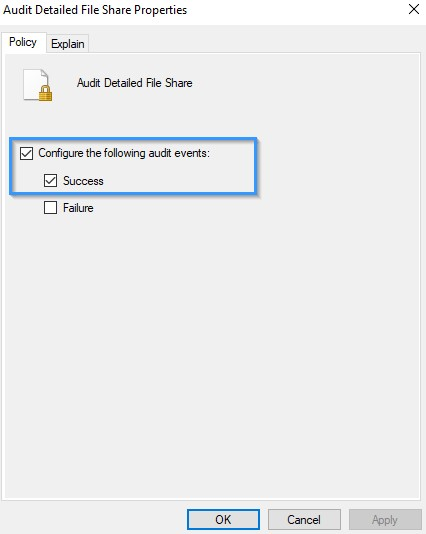
Figure 2: Audit Detailed File Share Properties
7. Click OK to save the changes.
8. Ensure the settings are enforced and enabled on the group policy object.
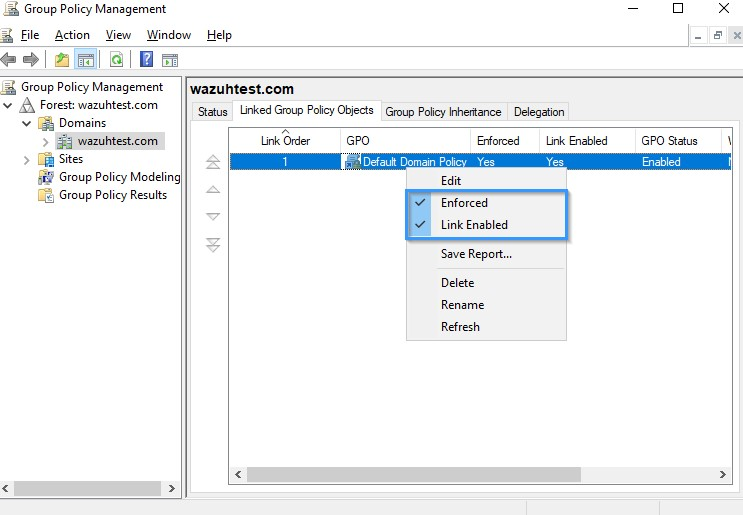
Figure 3: Group Policy Management.
Windows endpoint
Perform the following steps to configure the Wazuh agent to capture Sysmon logs and send them to the Wazuh server for analysis:
1. Download Sysmon from the Microsoft Sysinternals page.
2. Download the Sysmon configuration file, sysmonconfig.xml.
3. Navigate to the directory where the downloaded Sysmon files exist and install Sysmon using PowerShell with administrator privileges:
> .\sysmon64.exe -accepteula -i sysmonconfig.xml
4. Add the following configuration within the <ossec_config> block of the Wazuh agent configuration file C:\Program Files (x86)\ossec-agent\ossec.conf:
<localfile>

  <location>Microsoft-Windows-Sysmon/Operational</location>

  <log_format>eventchannel</log_format>

</localfile>
The above configuration allows the Wazuh agent to collect and forward Sysmon event logs to the Wazuh server.
5. Restart the Wazuh agent to apply the configuration changes:
> Restart-Service -Name Wazuh
Detection rules
In this section, we create rules to detect SharpHound behavior on the endpoint.
Wazuh server
1. Create a custom rule file, sharphound.xml, in the /var/ossec/etc/rules/ directory:
$ sudo touch /var/ossec/etc/rules/sharphound.xml
2. Add the below custom detection rules for SharpHound to the /var/ossec/etc/rules/sharphound.xml file:
<group name="sharphound">
<!-- This rule detects the organization name, SpecterOps in the binary.-->
<rule id="111151" level="7">
  <if_sid>61603</if_sid>
  <field name="win.eventdata.company" type="pcre2">^SpecterOps$</field>
  <description>Possible Bloodhound activity: Sharphound binary executed. </description>
  <mitre>
    <id>T1033</id>
  </mitre>
</rule>
<!-- This rule detects the CollectionMethods flag, sometimes specified when running the executable.-->
<rule id="111152" level="12">
  <if_sid>61603</if_sid>
  <field name="win.eventdata.parentImage" type="pcre2">(?i)[c-z]:\\\\Windows\\\\System32\\\\.+\\\\(powershell|cmd)\.exe</field>
  <field name="win.eventdata.commandLine" type="pcre2">(?i)((--CollectionMethods\s)((.+){1,12})|(\s(--Loop)))</field>
  <description>Possible Bloodhound activity: CollectionMethods flag detected.</description>
  <mitre>
    <id>T1059.00</id>
    <id>T1033</id>
  </mitre>
</rule>
<!-- This rule detects the launch of the SharpHound PowerShell cmdlet.-->
<rule id="111153" level="12">
  <if_sid>61603</if_sid>
  <field name="win.eventdata.parentImage" type="pcre2">(?i)[c-z]:\\\\Windows\\\\System32\\\\.+\\\\(powershell|cmd)\.exe</field>
  <field name="win.eventdata.commandLine" type="pcre2">(?i)((invoke-bloodhound\s)|(get-bloodHounddata\s))</field>
  <description>Possible Bloodhound activity: Sharphound Powershell cmdlet detected. </description>
  <mitre>
    <id>T1059.00</id>
    <id>T1033</id>
  </mitre>
</rule>
<!-- This rule detects attempts made by an executable to query LDAP-->
<rule id="111154" timeframe="1" level="3">
  <if_sid>61605</if_sid>
  <field name="win.eventdata.image" type="pcre2">(?i)^[c-z](([^\\]+?)(.*)(\.exe|ps1)$)</field>
  <field name="win.eventdata.destinationPort" type="pcre2">^389$</field>
  <description>LDAP query detected by $(win.eventdata.image) binary on $(name) host.</description>
  <mitre>
    <id>T1560</id>
  </mitre>
</rule>
<!-- This rule detects the creation of JSON files containing sensitive AD information
 obtained by the ingestor from the AD-->
<rule id="111155" timeframe="2" frequency="2" level="7">
  <if_sid>61613</if_sid>
  <field name="win.eventdata.image" type="pcre2">\.exe</field>
  <field name="win.eventdata.targetFilename" type="pcre2">(?i)([^\\]+?)(_computers\.json$|_domains\.json$|_ous\.json$|_users\.json$|_groups\.json$|_containers\.json$|_gpos\.json$)</field>
  <description>Possible Bloodhound activity detected: $(win.eventdata.targetFilename) file created by $(win.eventdata.image).</description>
  <mitre>
    <id>T1036</id>
  </mitre>
</rule>
<!-- This rule detects the creation of a zip file by an executable binary-->
<rule id="111156" level="3">
  <if_sid>61613</if_sid>
  <field name="win.eventdata.image" type="pcre2">\.exe</field>
  <field name="win.eventdata.targetFilename" type="pcre2">(?i)[c-z]:\\.*?([^\\]+\.(zip))$</field>
  <description>Zip file created: compressed data $(win.eventdata.targetFilename) created by $(win.eventdata.image).</description>
  <mitre>
    <id>T1560</id>
  </mitre>
</rule>
</group>
<group name="nullsession-connection">
<!-- This rule detects attempts to enumerate DC through null session connections.-->
<rule id="111157" frequency="2" timeframe="3" level="5">
  <if_sid>60103</if_sid>
  <field name="win.system.eventID" type="pcre2">^5145$</field>
  <field name="win.eventdata.relativeTargetName" type="pcre2">^srvsvc|lsarpc|samr$</field>
  <field name="win.eventdata.subjectUserName" type="pcre2">^(?!.*\$$).*$</field>
  <description> Possible Network Service enumeration by $(win.eventdata.subjectUserName) targeting $(win.eventdata.relativeTargetName).</description>
  <mitre>
    <id>T1087</id>
  </mitre>
</rule>
</group>
Where:
- Rule ID
111151detects that the vendor nameSpecterOpsis in the executed binary. - Rule ID
111152detects the presence ofCollectionMethodsorloopflag, which is sometimes specified when running the executable. - Rule ID
111153detects the execution of the Sharphound PowerShell cmdlet. - Rule ID
111154detects attempts made by an executable to query LDAP. - Rule ID
111155detects the creation of JSON files containing sensitive AD information. - Rule ID
111156detects the creation of a zip file by the executable binary. - Rule ID
111157detects enumeration on the DC targetingsmar,srvsvs, orlsarpcwith null session connections.
2. Restart Wazuh manager with the command below to apply the rules:
$ sudo systemctl restart wazuh-manager
Attack emulation
Windows endpoint
1. Download the precompiled SharpHound binary from the SharpHound GitHub repository.
2. Navigate to the SharpHound executable directory.
3. Run the command below to initiate the SharpHound session loop collection method:
> .\SharpHound.exe --CollectionMethods All --Loop
Detection results
Below are images of the alerts generated on the Wazuh Security events dashboard when SharpHound is executed on the domain joined Windows endpoint.
Follow the next steps to view the alerts on your Wazuh dashboard.
1. Navigate to the Security events tab.
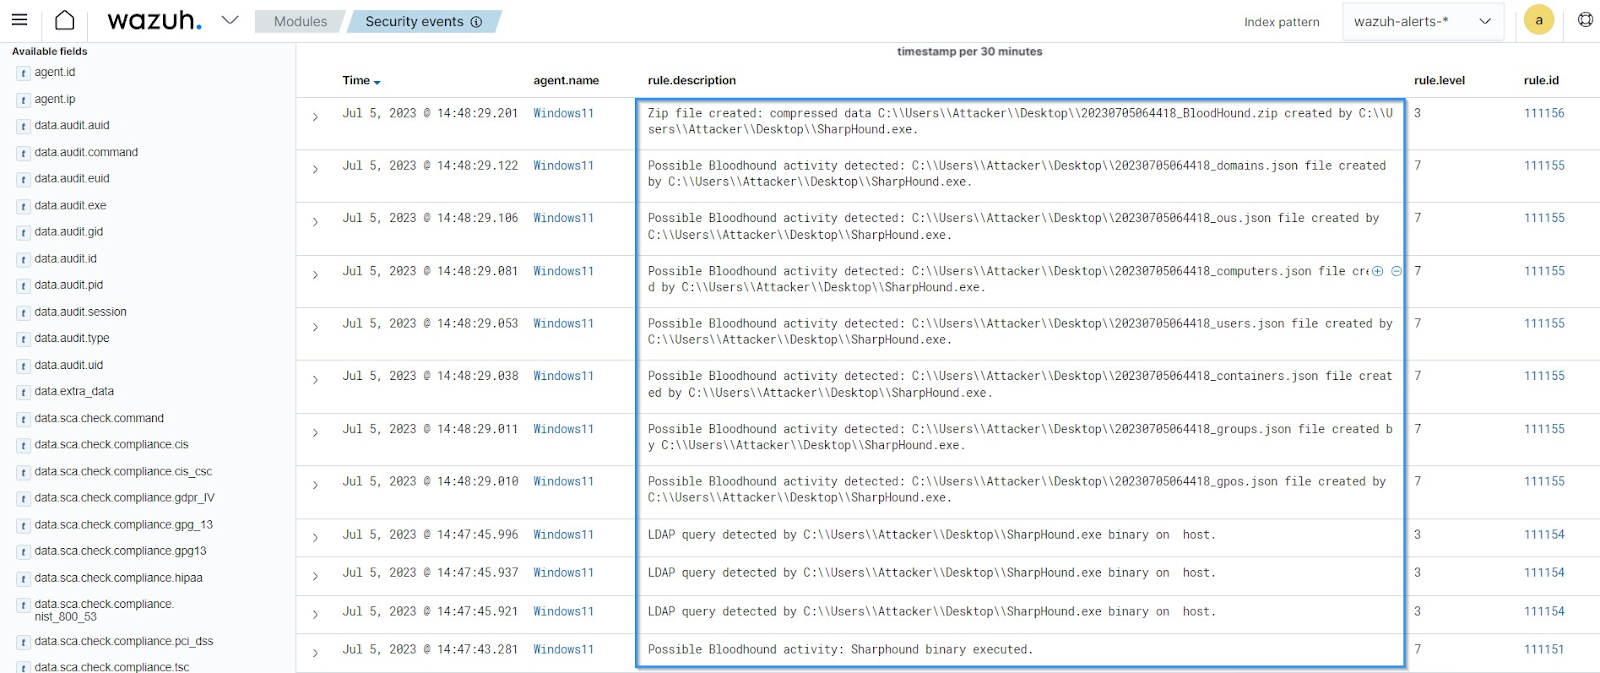
Figure 4: Security alerts generated from the Windows 11 endpoint.
The alerts in the image above show the actions performed by a typical SharpHound binary after execution.
2. Filter for event ID 5145 to view the alert for the DC with null session connections.
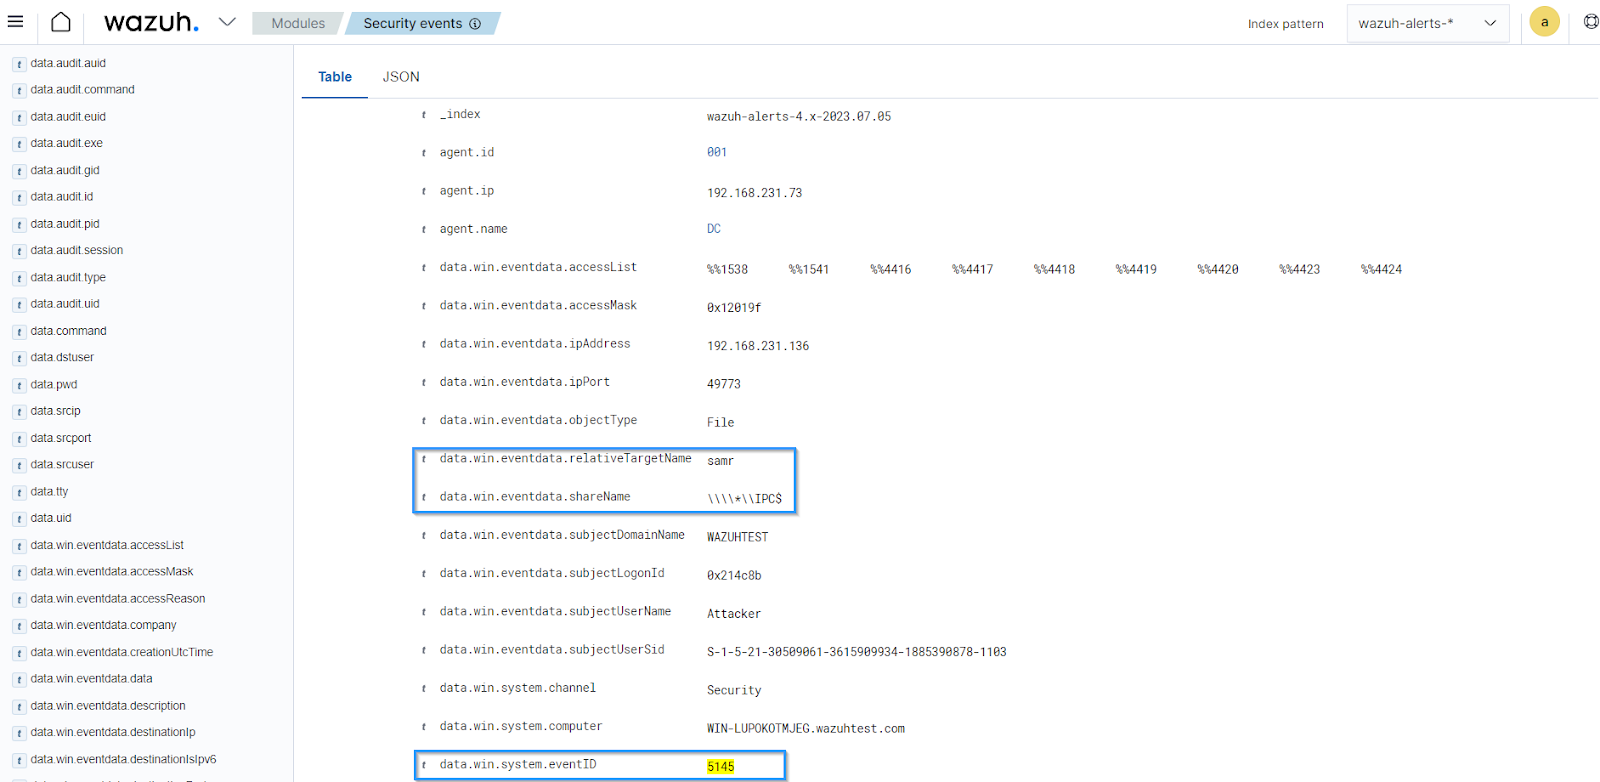
Figure 5: Security alert generated from the Domain controller.
Conclusion
In this blog post, we showed how to use Wazuh security capabilities to detect SharpHound activities. We monitored and detected SharpHound AD data collection activities, which is essential for AD security. Integrating Wazuh detection capabilities into an organization’s AD environment is crucial as it helps reduce the mean time to detect (MTTD), minimizing potential compromise by threat actors.
If you have any questions or require assistance regarding this setup, join our Slack community channel!
References
