Wazuh is a free and open source unified XDR and SIEM platform which is highly modular and customizable for each organization’s needs. The use cases Wazuh supports include security monitoring and automatic response to threats. The focus of this blog post will be on web attack detection. With Wazuh, we can detect common web attacks. To further enhance Wazuh web detection capabilities, we integrate teler a lightweight HTTP IDS. Wazuh with teler can be used to detect web exploits like HTML injection attacks, directory traversal, and upload attacks.
This blog post is a guide on how to configure Wazuh and teler to detect common web attacks in near real-time.
Setting up the lab
In our configuration, we set up teler and DVWA (Damn Vulnerable Web Application) on an Ubuntu 20.04 endpoint. We then configure Wazuh to ingest and analyze teler logs.
We recommend using a test environment to carry out this use case before deploying for widescale use.
Prerequisites
- A pre-built ready-to-use Wazuh OVA 4.3.9. Follow this guide to set up the virtual machine.
- Ubuntu 20.04 endpoint with DVWA and Wazuh agent installed. A step-by-step guide on installing DVWA (Damn Vulnerable Web Application).
- A Kali Linux 2022.3 endpoint that acts as an attacker. We use Nikto, one of its pre-installed tools, to simulate web attacks.
Configuring teler on Ubuntu
This section includes steps on how to configure teler on the Ubuntu endpoint hosting DVWA (Damn Vulnerable Web Application). Download and extract the teler binary on the Ubuntu endpoint:
1. Download and extract the teler binary on the Ubuntu endpoint:
$ wget https://github.com/kitabisa/teler/releases/download/v2.0.0-rc.3/teler_2.0.0-rc.3_linux_amd64.tar.gz
$ tar -xvzf teler_2.0.0-rc.3_linux_amd64.tar.gz
2. Download the sample configuration file teler.example.yaml and ensure it is in the same directory as the teler binary.
3. Rename the file to teler.yaml.
4. On the Ubuntu endpoint, modify the log_format parameter in the teler.yaml file to use the configuration below.
Apache Configuration:
log_format: |
  $remote_addr - $remote_user [$time_local] "$request_method $request_uri $request_protocol" $status $body_bytes_sent "$http_referer" "$http_user_agent"
Note
Other configuration types exist per user environment and preference.
5. Modify the logs parameter in the teler.yaml file to enable logging and choose a location for teler logs:
logs:
  file:
    active: true
    json: true
    path: "<PATH_TO_LOGFILE>/output.log" #e.g /var/log/teler/output.log
6. Other parameters such as rules, customs, metrics, and whitelists in the teler.yaml config file is available on the teler configuration site.
7. On the Ubuntu endpoint, add the configuration block below to the Wazuh agent configuration file located at /var/ossec/etc/ossec.conf to monitor the output.log file generated by teler:
<localfile>
  <log_format>syslog</log_format>
  <location><PATH_TO_LOGFILE>/output.log</location>
</localfile>
8. Restart the Wazuh agent:
# systemctl restart wazuh-agent
9. Run the command below on the Ubuntu endpoint to start the teler application:
$ tail -f /var/log/apache2/access.log | ./teler -c /path/to/teler.yaml
#Output for the alerts generated by teler on the terminal
	  __      __
	 / /____ / /__ ____
	/ __/ -_) / -_) __/
	\__/\__/_/\__/_/
	                v2.0.0-rc.3

	infosec@kitabisa.com

[WRN] This tool is under development!
[WRN] Please submit a report if an error occurs.
[INF] Analyzing...
[INF] Listening dashboard on http://127.0.0.1:8080
Configuring rules on Wazuh
1. On the Wazuh server, we add the custom rules below to the /var/ossec/etc/rules/local_rules.xml file. The Wazuh rules below work with the default pre-configured rules defined in the teler.yaml file:
<group name="teler,">
 <rule id="100012" level="10">
   <decoded_as>json</decoded_as>
   <field name="category" type="pcre2">Common Web Attack(: .*)?|CVE-[0-9]{4}-[0-9]{4,7}</field>
   <field name="request_uri" type="pcre2">\D.+|-</field>
   <field name="remote_addr" type="pcre2">\d+.\d+.\d+.\d+|::1</field>
   <mitre>
     <id>T1210</id>
   </mitre>
   <description>teler detected $(category) against resource $(request_uri) from $(remote_addr)</description>
   </rule>

   <rule id="100013" level="10">
   <decoded_as>json</decoded_as>
   <field name="category" type="pcre2">Bad (IP Address|Referrer|Crawler)</field>
   <field name="request_uri" type="pcre2">\D.+|-</field>
   <field name="remote_addr" type="pcre2">\d+.\d+.\d+.\d+|::1</field>
   <mitre>
     <id>T1590</id>
   </mitre>
   <description>teler detected $(category) against resource $(request_uri) from $(remote_addr)</description>
   </rule>

   <rule id="100014" level="10">
   <decoded_as>json</decoded_as>
   <field name="category" type="pcre2">Directory Bruteforce</field>
   <field name="request_uri" type="pcre2">\D.+|-</field>
   <field name="remote_addr" type="pcre2">\d+.\d+.\d+.\d+|::1</field>
   <mitre>
     <id>T1595</id>
   </mitre>
   <description>teler detected $(category) against resource $(request_uri) from $(remote_addr)</description>
   </rule>
</group>
2. Restart the Wazuh manager:
# systemctl restart wazuh-manager
Attack emulation
From the Kali Linux endpoint, use Nikto to launch an attack against the vulnerable web application:
# nikto -h http://<UBUNTU_IP>/dvwa/
Where -h specifies the target URL.
Note
Nikto is an automated web vulnerability scanner. This attack will generate a lot of alerts on the Wazuh dashboard because Nitko will try numerous exploits against a buggy web application.
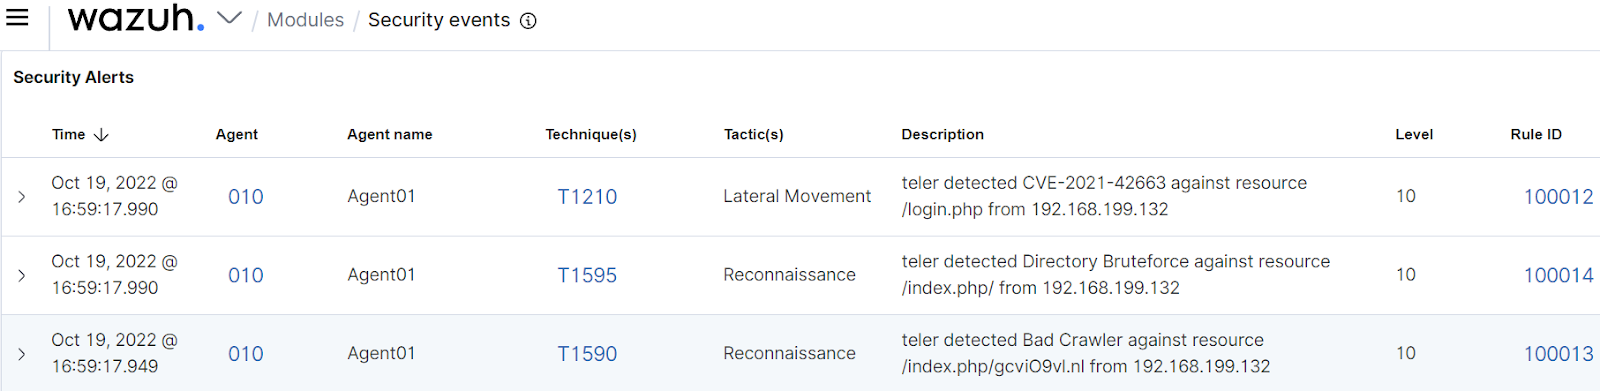
After completing the steps above, teler will analyze the web server logs based on its default pre-configured rules, generating alerts on the Wazuh dashboard. The screenshot below shows alerts on the Wazuh dashboard after the attack emulation.
Conclusion
In this blog post, we successfully integrated teler with Wazuh to enrich its web attack detection capabilities. The capabilities of teler HTTP IDS, in conjunction with Wazuh, can be used by threat analysts and incident responders to scan web server logs and extract relevant data for investigations. Using the Wazuh SIEM and XDR solution, an organization can keep ahead of security-related activities by quickly identifying and responding to incidents.
Kindly join our community, where our team and contributors can help you if you have any more questions, or read our documentation to find out more about Wazuh.