Wazuh, as an open source unified XDR and SIEM platform, continuously offers diverse integration approaches with various data analysis and visualization solutions. We developed a new approach for Integrating Wazuh and OpenSearch.
OpenSearch is an open source search and analytics engine that provides a platform for managing and visualizing security data. Integrating Wazuh and OpenSearch allows you to combine the threat detection and security monitoring capabilities of Wazuh with the search and analytics engine of OpenSearch. This integration in turn enables you to centralize your security operations, extract actionable insights from your data, and detect threats more effectively.
In this blog post, we explore how to integrate the Wazuh indexer with OpenSearch using Logstash. We configure the solution to monitor your infrastructure and show a practical use case to demonstrate its potential.
Infrastructure
We use the following infrastructure to demonstrate how we integrate the Wazuh indexer with OpenSearch using Logstash.
- A CentOS 7 endpoint with the Wazuh indexer and Wazuh server 4.5.2 deployed.
- An Ubuntu 22.04 endpoint with OpenSearch 2.10.0 components installed. Use the following documentation to install OpenSearch and OpenSearch Dashboards.
Configuration
Ubuntu
We configure the Wazuh indexer integration with OpenSearch using Logstash as a data forwarder. This integration operates by reading indices stored on the Wazuh indexer and forwarding them to OpenSearch. OpenSearch then creates indices for the received events and displays them on OpenSearch Dashboards, the user interface for OpenSearch. These operations create indices in both Wazuh and OpenSearch for the same events.
Installing and configuring Logstash
For this blog post, we installed Logstash 8.10 on the same host as OpenSearch but you can also install it separately on a dedicated server.
1. Run the following commands to install and start Logstash:
$ sudo apt-get install apt-transport-https
$ wget -qO - https://artifacts.elastic.co/GPG-KEY-elasticsearch | sudo gpg --dearmor -o /usr/share/keyrings/elastic-keyring.gpg
$ echo "deb [signed-by=/usr/share/keyrings/elastic-keyring.gpg] https://artifacts.elastic.co/packages/8.x/apt stable main" | sudo tee -a /etc/apt/sources.list.d/elastic-8.x.list
$ sudo apt-get update && sudo apt-get install logstash
$ sudo systemctl start logstash
$ sudo systemctl status logstash
2. Install the logstash-input-opensearch plugin and the logstash-output-opensearch plugin using the following command. These plugins allow reading the data from the Wazuh indexer and writing it into OpenSearch.
$ sudo /usr/share/logstash/bin/logstash-plugin install logstash-input-opensearch logstash-output-opensearch
Note: If you did not enable SSL on your OpenSearch instance, skip creating the /etc/logstash/opensearch-certs directory and setting the permissions in step 3, 4 and 5 for OpenSearch.
3. Create the /etc/logstash/wazuh-indexer-certs and /etc/logstash/opensearch-certs directories:
$ sudo mkdir /etc/logstash/wazuh-indexer-certs
$ sudo mkdir /etc/logstash/opensearch-certs
4. Copy your Wazuh indexer and OpenSearch root certificates into the /etc/logstash/wazuh-indexer-certs and /etc/logstash/opensearch-certs directories respectively.
5. Assign appropriate permissions to the copied certificates to allow the logstash user to read them when running Logstash as a service:
$ sudo chmod -R 755 /etc/logstash/wazuh-indexer-certs/root-ca.pem
$ sudo chmod -R 755 /etc/logstash/opensearch-certs/root-ca.pem
6. Run the commands below to create the /etc/logstash/templates/ directory and download the logstash/os_template.json template as wazuh.json. We use this template to configure the index initialization for OpenSearch.
$ sudo mkdir /etc/logstash/templates
$ sudo curl -o /etc/logstash/templates/wazuh.json https://packages.wazuh.com/integrations/opensearch/4.x-2.x/dashboards/wz-os-4.x-2.x-template.json
Configuring the ingestion pipeline
A Logstash pipeline is a data processing configuration that defines how to ingest, transform, and forward data to its destination using Logstash.
In order to read the Wazuh indexer indices and write them into OpenSearch, the Logstash pipeline requires access to their respective credentials. We use the Logstash keystore to securely store these values.
Set the keystore password
1. Run the following commands on your Logstash server to set a keystore password:
$ set +o history
$ echo 'LOGSTASH_KEYSTORE_PASS="<MY_KEYSTORE_PASSWORD>"'| sudo tee /etc/default/logstash
$ export LOGSTASH_KEYSTORE_PASS=<MY_KEYSTORE_PASSWORD>
$ set -o history
$ sudo chown root /etc/default/logstash
$ sudo chmod 600 /etc/default/logstash
$ sudo systemctl restart logstash
Replace <MY_KEYSTORE_PASSWORD> with your keystore password.
Store the credentials
Perform the steps below to securely create a keystore and store the Wazuh indexer and OpenSearch credentials.
1. Create a new keystore:
$ sudo -E /usr/share/logstash/bin/logstash-keystore --path.settings /etc/logstash create
Note: Each of the commands below prompts you to enter your credentials but the credentials are not visible when you enter them.
2. Run the following commands to store your OpenSearch username and password:
$ sudo -E /usr/share/logstash/bin/logstash-keystore --path.settings /etc/logstash add OPENSEARCH_USERNAME
$ sudo -E /usr/share/logstash/bin/logstash-keystore --path.settings /etc/logstash add OPENSEARCH_PASSWORD
Where OPENSEARCH_USERNAME and OPENSEARCH_PASSWORD are keys representing your OpenSearch username and password respectively.
3. Run the following commands to store your Wazuh indexer administrator username and password:
$ sudo -E /usr/share/logstash/bin/logstash-keystore --path.settings /etc/logstash add WAZUH_INDEXER_USERNAME
$ sudo -E /usr/share/logstash/bin/logstash-keystore --path.settings /etc/logstash add WAZUH_INDEXER_PASSWORD
Where WAZUH_INDEXER_USERNAME and WAZUH_INDEXER_PASSWORD are keys representing your Wazuh indexer administrator username and password respectively.
Configure the pipeline
Perform the following steps to configure the Logstash pipeline.
1. Create the configuration file wazuh-opensearch.conf in the /etc/logstash/conf.d/ directory:
$ sudo touch /etc/logstash/conf.d/wazuh-opensearch.conf
2. Add the following configuration to the wazuh-opensearch.conf file. This configuration sets the parameters required to run Logstash.
input {
  opensearch {
	hosts =>  ["<WAZUH_INDEXER_ADDRESS>:9200"]
	user  =>  "${WAZUH_INDEXER_USERNAME}"
	password  =>  "${WAZUH_INDEXER_PASSWORD}"
	index =>  "wazuh-alerts-4.x-*"
	ssl => true
	ca_file => "/etc/logstash/wazuh-indexer-certs/root-ca.pem"
	query =>  '{
   	 "query": {
   		 "range": {
   			 "@timestamp": {
   				 "gt": "now-1m"
   			 }
   		 }
   	 }
	}'
	schedule => "* * * * *"
  }
}

output {
    opensearch {
    	hosts => ["<OPENSEARCH_ADDRESS>"]
    	auth_type => {
        	type => 'basic'
        	user => '${OPENSEARCH_USERNAME}'
        	password => '${OPENSEARCH_PASSWORD}'
      	}
    	index  => "wazuh-alerts-4.x-%{+YYYY.MM.dd}"
    	cacert => "/etc/logstash/opensearch-certs/root-ca.pem"
    	ssl => true
        template => "/etc/logstash/templates/wazuh.json"
    	template_name => "wazuh"
    	template_overwrite => true
	}
}
Replace:
<WAZUH_INDEXER_ADDRESS>with the IP address or FQDN of your Wazuh indexer.<OPENSEARCH_ADDRESS>with the IP address or FQDN of your OpenSearch instance.
Note: Replace cacert => "/etc/logstash/opensearch-certs/root-ca.pem” with ssl_certificate_verification => false in the configuration above if you did not enable SSL on your OpenSearch instance. This configuration disables SSL verification.
Running Logstash
1. Run Logstash with the following commands:
$ sudo systemctl stop logstash
$ sudo -E /usr/share/logstash/bin/logstash -f /etc/logstash/conf.d/wazuh-opensearch.conf --path.settings /etc/logstash/
Ensure that the Wazuh indexer’s RESTful API port (9200) is open.
2. After confirming that the configuration loads correctly without errors, cancel the command and run Logstash as a service:
$ sudo systemctl enable logstash
$ sudo systemctl start logstash
OpenSearch Dashboards
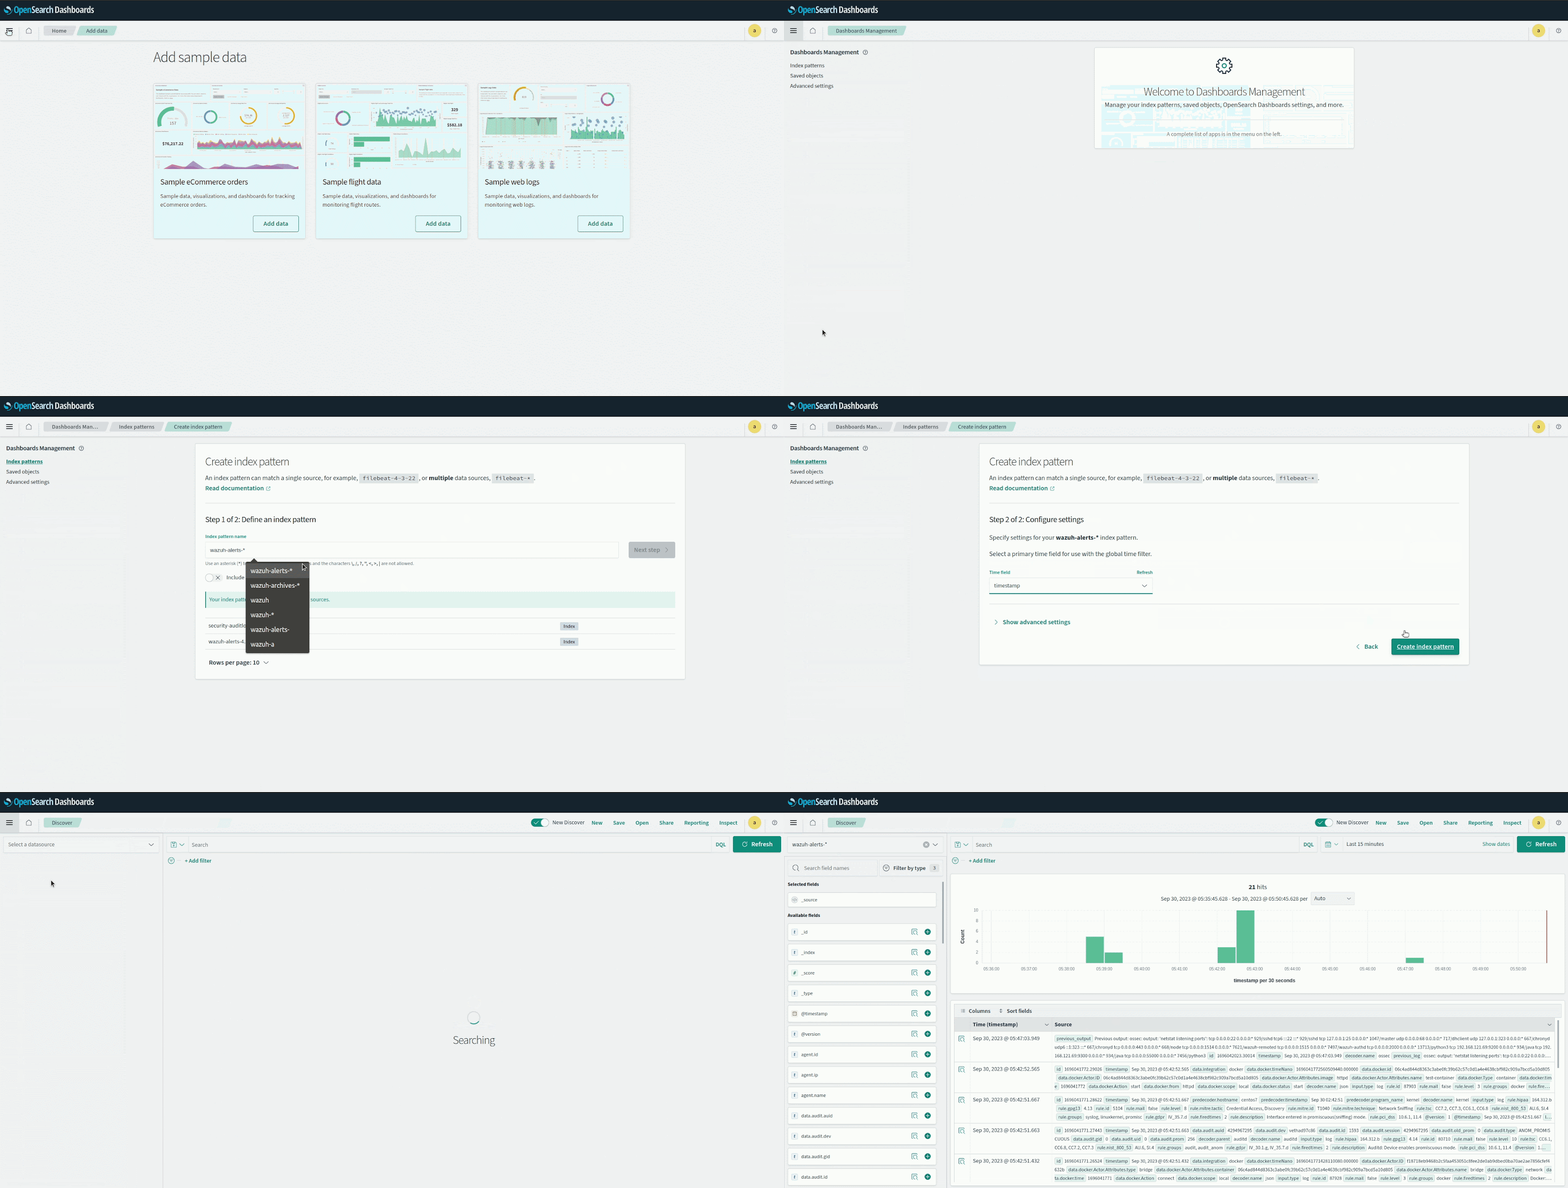
Follow the next steps to create the index pattern name for the Wazuh alerts and visualize the events.
1. Select ☰ > Management > Dashboards Management.
2. Choose Index Patterns and select Create index pattern.
3. Define wazuh-alerts-* as the index pattern name.
4. Select timestamp as the primary time field for use with the global time filter. Then, click Create the index pattern.
5. Open the menu and select Discover under OpenSearch Dashboards. You will find the Wazuh security data within the index pattern wazuh-alerts-4.x*.

Use case
Monitor docker events with Docker events dashboard
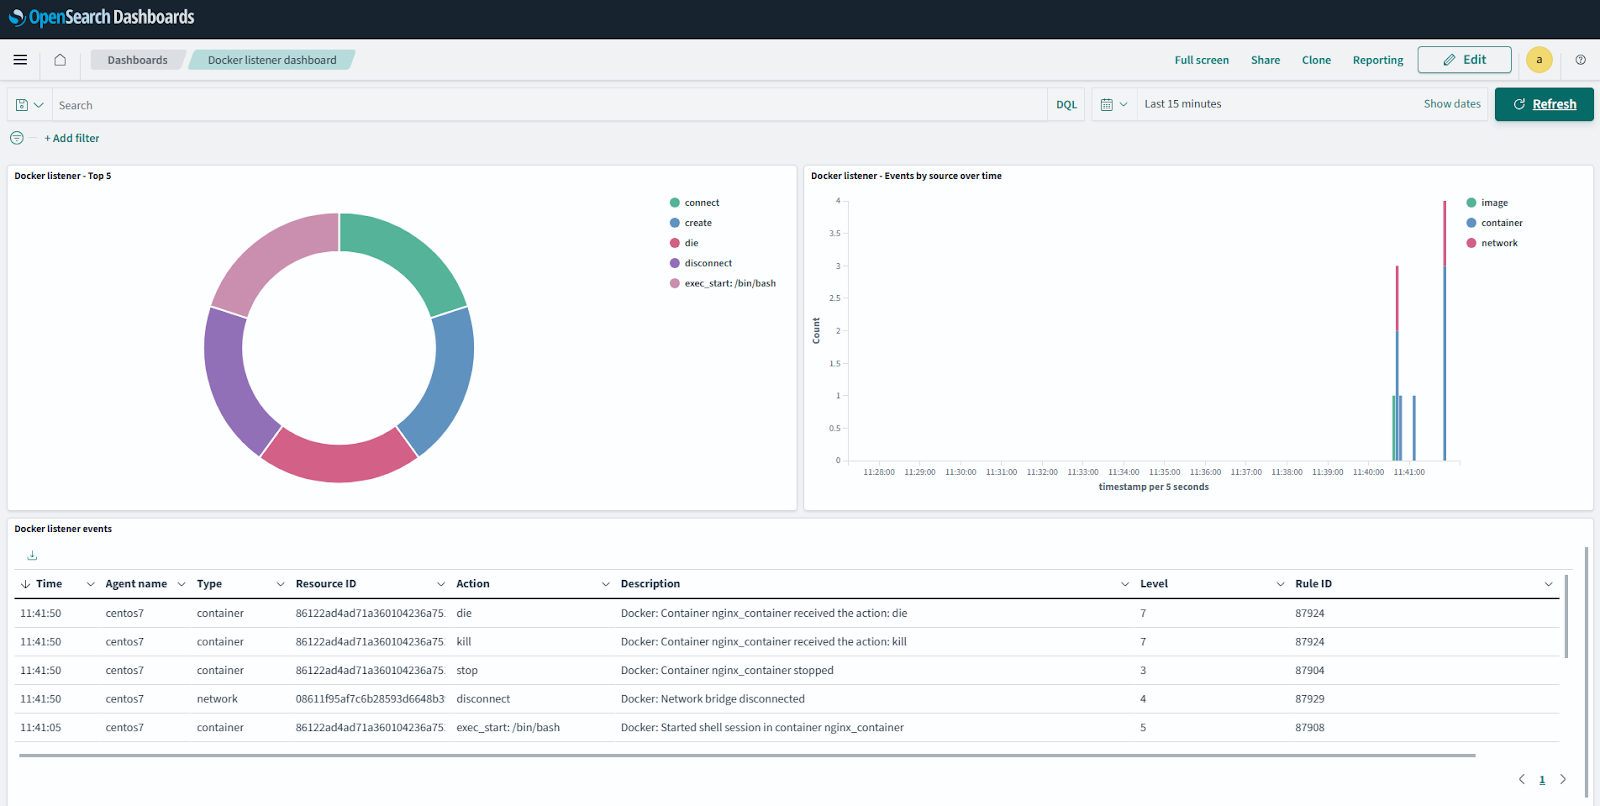
In this use case we utilize the docker-listener module to monitor a Docker environment and integrate the Wazuh Docker events dashboard into OpenSearch to visualize the events. This dashboard helps security teams detect potential threats and ensure the integrity and reliability of containerized applications.
Requirements
A CentOS 7 endpoint with Wazuh agent 4.5.2 installed and enrolled to the Wazuh server. To install the Wazuh agent, refer to the Wazuh agent installation guide.
CentOS endpoint
Follow the steps below to install Docker and configure the docker-listener module to monitor Docker events.
1. Install Python and pip:
$ sudo yum install python3 python3-pip
2. Install Docker and the Python Docker Library to run the containers:
$ sudo curl -sSL https://get.docker.com/ | sh
$ sudo systemctl start docker
$ sudo pip3 install docker==4.2.0
3. Edit the /var/ossec/etc/ossec.conf configuration file and add this block to enable the docker-listener module:
<ossec_config>
  <wodle name="docker-listener">
    <interval>10m</interval>
    <attempts>5</attempts>
    <run_on_start>yes</run_on_start>
    <disabled>no</disabled>
  </wodle>
</ossec_config>
Where:
intervalspecifies the waiting time to rerun the Docker listener in case it fails.attemptsspecifies the number of attempts to execute the listener in case it failsrun_on_startruns the Docker listener immediately when the Wazuh agent starts.
4. Restart the Wazuh agent to apply the changes:
$ sudo systemctl restart wazuh-agent
5. Perform several Docker activities like pulling a Docker image, starting an instance, and more to generate some Docker events to monitor:
$ sudo docker pull nginx
$ sudo docker run -d -P --name nginx_container nginx
$ sudo docker exec -it nginx_container cat /etc/passwd
$ sudo docker exec -it nginx_container /bin/bash
$ exit
$ sudo docker stop nginx_container
$ sudo docker rm nginx_container
$ sudo docker rmi nginx
Visualize the events with the Wazuh Docker events dashboard
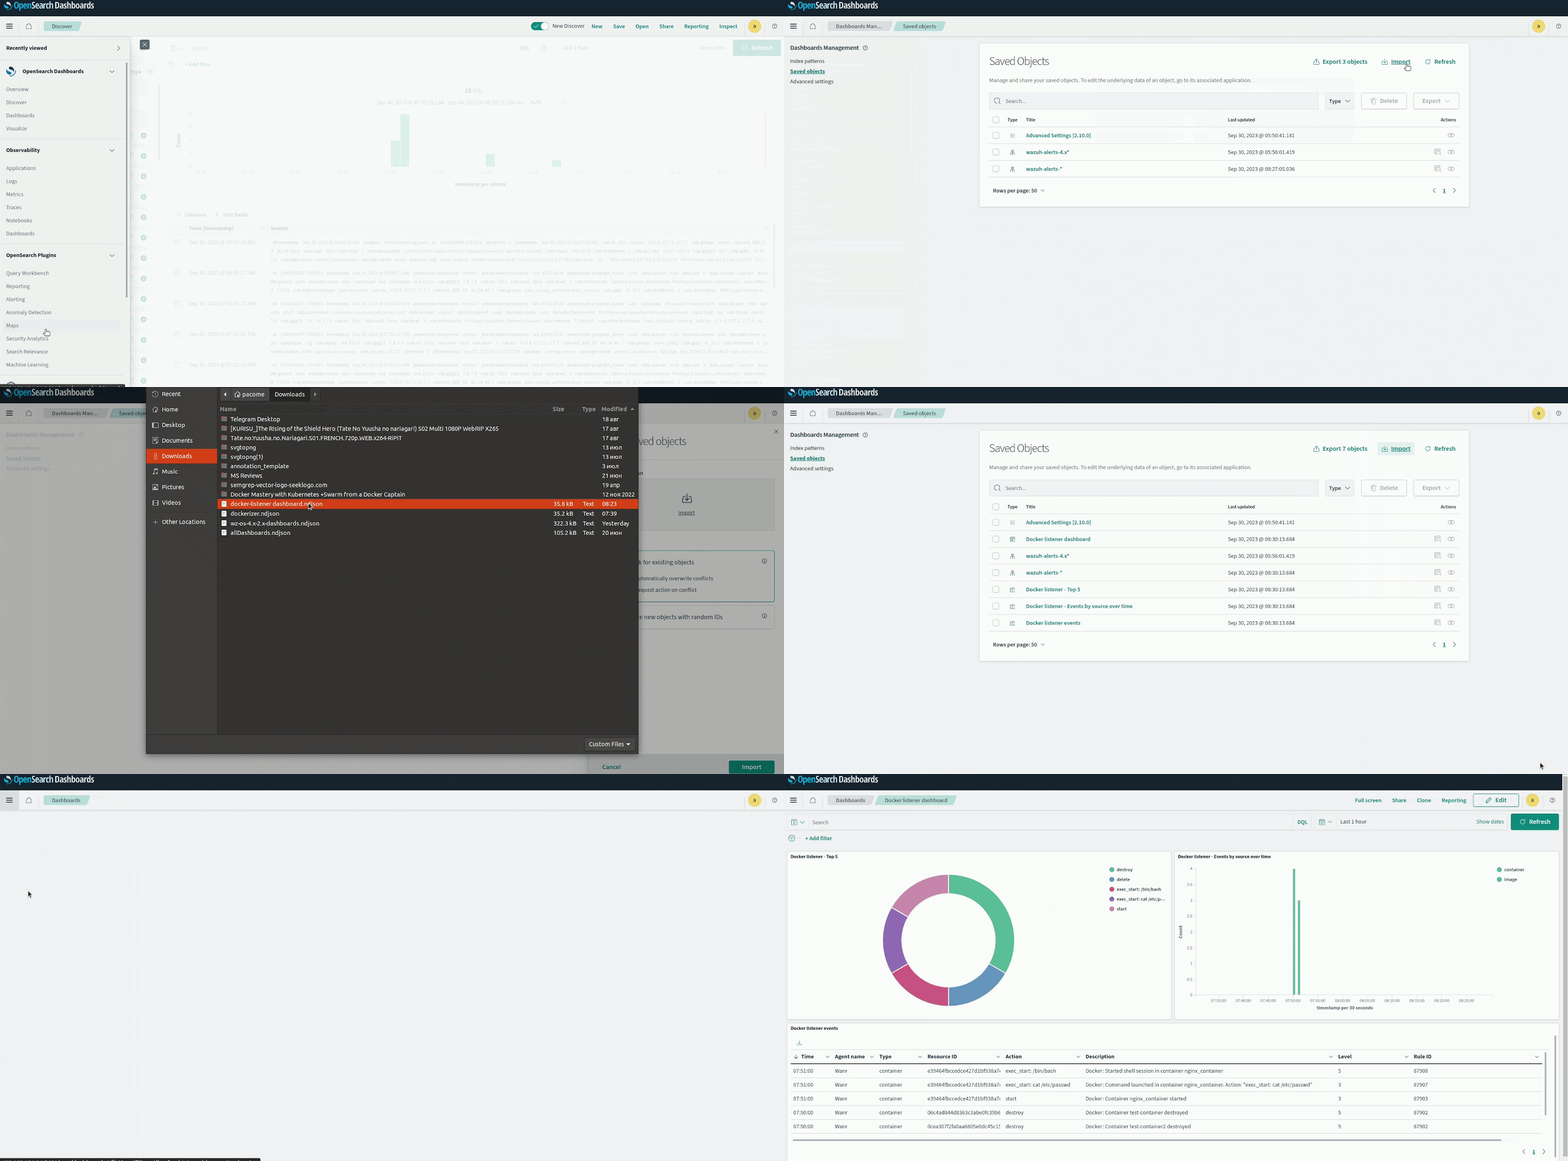
Perform the steps below to import the Wazuh Docker events dashboard in OpenSearch Dashboards and visualize the alerts.
1. Download the Wazuh Docker events dashboard file for OpenSearch on your endpoint.
2. In OpenSearch Dashboards, navigate to Management > Dashboards management.
3. Click on Saved Objects and click Import.
4. Click on the Import icon, browse your files, and select the dashboard file.
5. Click the Import button to start importing then click Done.6. To find the imported dashboard, navigate to Dashboards under OpenSearch Dashboards.


Conclusion
Throughout this blog post, we explore the configuration steps to integrate a Wazuh indexer with OpenSearch and showcase a practical use case to analyze Docker events in OpenSearch.
While this integration provides a direct method to forward Wazuh indexer indices and visualize events into OpenSearch, it is also possible to integrate a Wazuh server to forward its JSON alerts to OpenSearch using Logstash. This alternative method is useful if resource constraints limit hosting both the Wazuh indexer and OpenSearch.
With these integrations, your security team gains an ally in identifying advanced threats and extracting actionable insights from your security data.
References
