Dependency-Track is an open source platform that helps organizations identify and mitigate risks in their software supply chain. It achieves this by analyzing Software Bill of Materials (SBOMs), which is a detailed inventory of all software components, libraries, and modules that comprise an application.
Dependency-Track can be integrated into CI/CD pipelines to analyze SBOMs generated during the build process, before code is deployed to production. By continuously monitoring SBOMs, Dependency-Track enables teams to detect vulnerable or outdated dependencies, track newly disclosed vulnerabilities, and prioritize remediation efforts.
By integrating Dependency-Track with Wazuh, security teams can unify critical vulnerability intelligence from their software components with existing endpoint and infrastructure security alerts. This integration creates a holistic view of supply chain risks, enabling faster detection, prioritization, and automated response workflows for newly discovered vulnerabilities.
In this blog post, we demonstrate how to integrate Dependency-Track with Wazuh to enhance your software supply chain security posture through automated vulnerability monitoring and alerting.
Infrastructure
To demonstrate the integration of Dependency-Track with Wazuh, we use the following infrastructure:
- A pre-built, ready-to-use Wazuh OVA 4.12.0, which includes the Wazuh central components (Wazuh server, Wazuh indexer, and Wazuh dashboard). Follow this guide to download and set up the Wazuh virtual machine.
- An Ubuntu 24.04 endpoint with the Wazuh agent 4.12.0 installed and enrolled to the Wazuh server. We will also install Dependency-Track v4.13.2. This endpoint should have a minimum of 2 CPU cores and 5GB of RAM allocated.
Configuration
We perform the steps below to configure this integration.
Ubuntu endpoint
Perform the following steps on the Ubuntu endpoint.
- Install Dependency-Track
- Create a target application and generate an SBOM
- Upload the SBOM to Dependency-Track
- Create a custom bash script and configure the Wazuh Command module
Install Dependency-Track
Follow the steps below to install Dependency-Track on the Ubuntu endpoint.
Note
You need root user privileges to execute all the commands described below.
1. Update the list of available software packages. Then run the following commands to download and run the Docker installation script:
# apt update
# curl -sSL https://get.docker.com/ | sh
2. Create a new directory dependency-track in the user’s home directory and navigate into it. Then, download the Dependency-Track docker-compose.yml file:
# mkdir $HOME/dependency-track && cd $HOME/dependency-track
# curl -LO https://dependencytrack.org/docker-compose.yml
3. Edit the docker-compose.yml file and modify the API_BASE_URL environment variable to the IP address or hostname of the Ubuntu endpoint:
API_BASE_URL: "http://<UBUNTU_IP>:8081"
Replace <UBUNTU_IP> with the IP address or hostname of your Ubuntu endpoint.
4. Run the following command to start Dependency-Track. This command launches the Dependency-Track backend services and frontend user interface (UI). It takes a few minutes to download images and initialize.
- To run in the background (detached mode):
# docker compose up -d
- To run in the foreground and view logs directly:
# docker compose up
5. Open your web browser and navigate to http://<UBUNTU_IP>:8080 to access the Dependency-Track UI. The default credentials are admin/admin. You will be prompted to change the default password.
Create a target application and generate an SBOM
In this example, we create a sample Python project, define some intentionally vulnerable dependencies, and then use a tool to generate a CycloneDX SBOM. CycloneDX is a full-stack Bill of Materials (BOM) standard that provides advanced supply chain capabilities for cyber risk reduction.
Follow the steps below to create a target application and generate an SBOM on the Ubuntu endpoint.
1. Install dependencies:
# apt install -y python3 python3-pip build-essential python3-dev python3-venv -y
2. Create a project directory python-app in the user’s home directory and switch into it.
# mkdir $HOME/python-app && cd $HOME/python-app
3. Create and activate a Python virtual environment to isolate project dependencies. This prevents conflicts with system-wide Python packages.
# python3 -m venv venv
# source venv/bin/activate
4. Create a file requirements.txt in the $HOME/python-app directory and add the content below. This file lists the Python packages your project needs.
Note
These versions are intentionally vulnerable and should not be used in production environments.
cryptography==3.0
flask==0.12
httpie==1.0.3
pyyaml==5.1
pycrypto==2.6.1
Werkzeug==0.14.1
5. Install the dependencies listed in the requirements.txt file within the virtual environment. This will download and install cryptography, flask, httpie, pyyaml, pycrypto, and Werkzeug along with their dependencies.
# pip install -r requirements.txt
6. Install the CycloneDX Python generator into your active virtual environment. We use the cyclonedx-python tool to generate the SBOM from the installed packages:
# pip install cyclonedx-bom
7. Generate the CycloneDX SBOM. Run the following command to generate the SBOM and save it as bom.json:
# cyclonedx-py requirements > bom.json
8. Run the following command to confirm that the dependencies specified are listed:
# head -n 93 bom.json
The command output should be similar to the following:
{
  "components": [
	{
  	"bom-ref": "requirements-L6",
  	"description": "requirements line 6: Werkzeug==0.14.1",
  	"externalReferences": [
    	{
      	"comment": "implicit dist url",
      	"type": "distribution",
      	"url": "https://pypi.org/simple/Werkzeug/"
    	}
  	],
  	"name": "Werkzeug",
  	"purl": "pkg:pypi/werkzeug@0.14.1",
  	"type": "library",
  	"version": "0.14.1"
	},
	{
  	"bom-ref": "requirements-L1",
  	"description": "requirements line 1: cryptography==3.0",
  	"externalReferences": [
    	{
      	"comment": "implicit dist url",
      	"type": "distribution",
      	"url": "https://pypi.org/simple/cryptography/"
    	}
  	],
  	"name": "cryptography",
  	"purl": "pkg:pypi/cryptography@3.0",
  	"type": "library",
  	"version": "3.0"
	},
	{
  	"bom-ref": "requirements-L2",
  	"description": "requirements line 2: flask==0.12",
  	"externalReferences": [
    	{
      	"comment": "implicit dist url",
      	"type": "distribution",
      	"url": "https://pypi.org/simple/flask/"
    	}
  	],
  	"name": "flask",
  	"purl": "pkg:pypi/flask@0.12",
  	"type": "library",
  	"version": "0.12"
	},
	{
  	"bom-ref": "requirements-L3",
  	"description": "requirements line 3: httpie==1.0.3",
  	"externalReferences": [
    	{
      	"comment": "implicit dist url",
      	"type": "distribution",
      	"url": "https://pypi.org/simple/httpie/"
    	}
  	],
  	"name": "httpie",
  	"purl": "pkg:pypi/httpie@1.0.3",
  	"type": "library",
  	"version": "1.0.3"
	},
	{
  	"bom-ref": "requirements-L5",
  	"description": "requirements line 5: pycrypto==2.6.1",
  	"externalReferences": [
    	{
      	"comment": "implicit dist url",
      	"type": "distribution",
      	"url": "https://pypi.org/simple/pycrypto/"
    	}
  	],
  	"name": "pycrypto",
  	"purl": "pkg:pypi/pycrypto@2.6.1",
  	"type": "library",
  	"version": "2.6.1"
	},
	{
  	"bom-ref": "requirements-L4",
  	"description": "requirements line 4: pyyaml==5.1",
  	"externalReferences": [
    	{
      	"comment": "implicit dist url",
      	"type": "distribution",
      	"url": "https://pypi.org/simple/pyyaml/"
    	}
  	],
  	"name": "pyyaml",
  	"purl": "pkg:pypi/pyyaml@5.1",
  	"type": "library",
  	"version": "5.1"
	}
  ],
Note
Automating SBOM generation and upload within your CI/CD pipeline is a best practice to keep your Dependency-Track data current and accurate. The specific approach depends on your technology stack and the tools integrated into your CI/CD workflow.
Upload the SBOM to Dependency-Track
You can upload the bom.json file to Dependency-Track using either the API or the Graphical User Interface (GUI).
Option 1 – Upload using the API
For automation, scalability, and integration into CI/CD pipelines, uploading SBOMs via the Dependency-Track API is the preferred method. To perform this, you need the following information from your Dependency-Track instance:
- API key: For authentication
- Project UUID/Object Identifier: This identifies the specific project you want to upload the SBOM to.
Perform the steps below to upload the bom.json file to Dependency-Track using the API:
Step 1: Obtain your API key from Dependency-Track
1. Log in to your Dependency-Track UI as an administrator.
2. Navigate to ADMINISTRATION > Administration > Access Management > Teams.
3. Click + Create Team and enter Wazuh as the Team Name. Then, click Create.
4. Select Wazuh to expand it. Under Permissions, click + and select the following permissions for the Wazuh team: BOM_UPLOAD & VIEW_PORTFOLIO. Then, click Select.
5. Click the + under API Keys. This will generate a new API Key that will only be displayed once. Copy the API key.
Step 2: Obtain the Project UUID/Object Identifier
1. Navigate to the Projects tab in the Dependency-Track UI.
2. Click Create Project. Enter a project name, version (optional), and Classifier. In this blog post, we use Python-App, 1.0.0, and Application respectively. Populate the other fields as desired and click Create.
3. Click on the name of the project you want to upload the SBOM for (for example, Python-App).
4. Once you are on the project’s detail page, look at the URL in your browser’s address bar. It will look similar to: http://<UBUNTU_IP>:8080/projects/<YOUR_PROJECT_UUID>. Copy this UUID.
Step 3: Upload the SBOM
Run the command below within the virtual environment in $HOME/python-app to upload the SBOM:
curl -X POST http://<UBUNTU_IP>:8081/api/v1/bom \
  -H "X-API-Key: <YOUR_API_KEY>" \
  -F "project=<YOUR_PROJECT_UUID>" \
  -F "bom=@<SBOM_NAME>"
Where:
<UBUNTU_IP>is the IP address of your Dependency-Track API server.<YOUR_API_KEY>is your API Key.<YOUR_PROJECT_UUID>is your Project UUID copied in Step 2.<SBOM_NAME>is the name of your SBOM file.
The output of the command should be similar to the following:
{"token":"uuid-token"}
The token indicates that the SBOM has been successfully uploaded and is now being processed by Dependency-Track’s background tasks. Confirm by checking in the Components tab.
Option 2. Upload using the GUI
Perform the steps below to upload the bom.json file to Dependency-Track:
1. Access the Dependency-Track UI. Open your web browser and navigate to http://<UBUNTU_IP>:8080.
2. Navigate to the Projects tab. Click Create Project. Enter a project name and a version (optional). In this blog post, we use Python-App and 1.0.0 for name and version, respectively.
3. Once the project is created, click on its name to enter the project details. Navigate to Components and click Upload BOM. A dialog will appear. Click Choose File and upload the bom.json file you generated.
4. Click Upload.
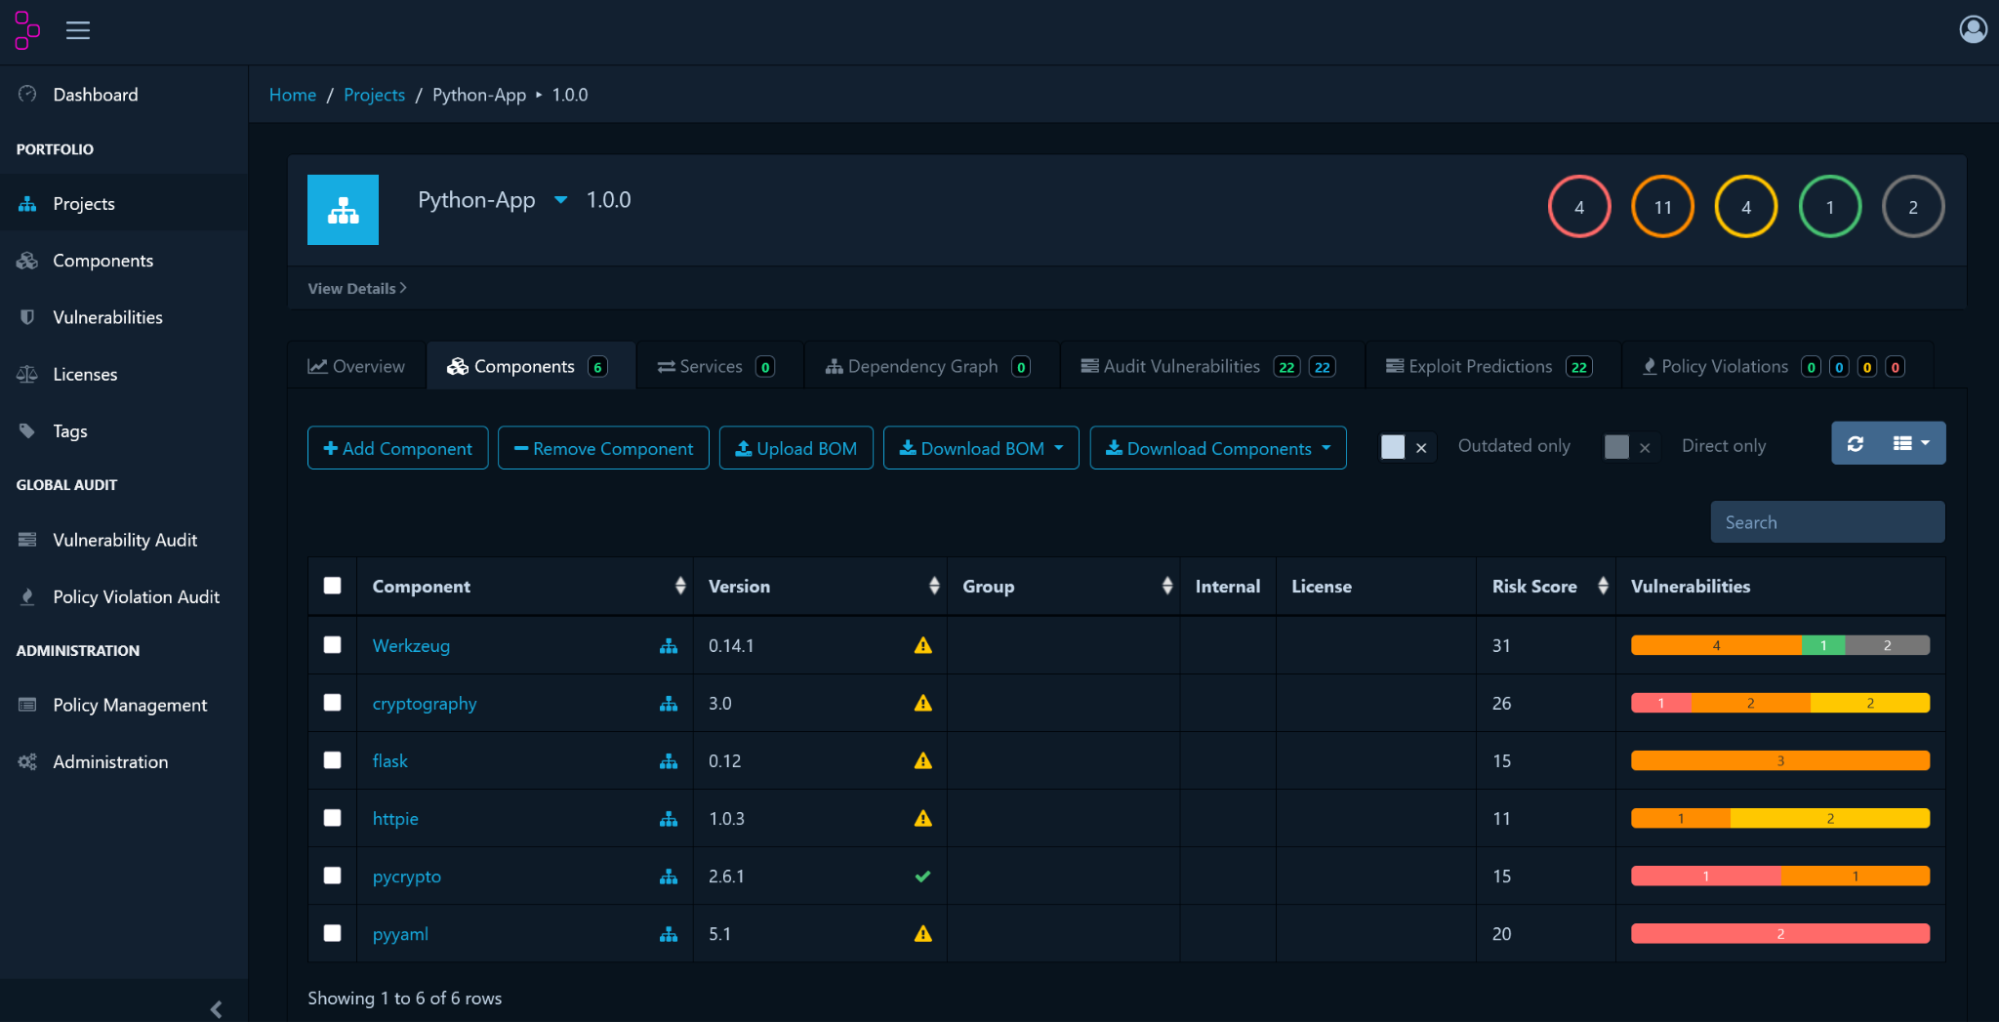
After a few minutes, Dependency-Track will process the SBOM, and you should see the components listed with their associated vulnerabilities.
Create a custom bash script and configure the Wazuh Command module
Follow the steps below to create a bash script and configure the Wazuh Command module on the Ubuntu endpoint. This script acts as a monitor that periodically pulls vulnerability data from a specific project within your Dependency-Track instance. It connects to the Dependency-Track API using an API key and a project’s unique ID, retrieves known vulnerabilities for the specified project, and then formats this information. Each detected vulnerability is then sent as a structured log message to the system’s syslog, tagged specifically for Wazuh to easily identify and process.
1. Create a custom script directory /var/ossec/custom-script/ and create a new file dependency_track_monitor.sh using the following command:
# mkdir /var/ossec/custom-script/ && touch /var/ossec/custom-script/dependency_track_monitor.sh
2. Copy and paste the code below into the /var/ossec/custom-script/dependency_track_monitor.sh file:
#!/bin/bash
# File: /var/ossec/custom-script/dependency_track_monitor.sh

# Configuration
DT_API_URL="http://<UBUNTU_IP>:8081/api/v1"
DT_API_KEY="<API_KEY>"
PROJECT_UUID="<PROJECT_UUID>"
LOG_FILE="/var/log/dependency_track.log"

# Function to log messages
log_message() {
    	echo "$(date '+%Y-%m-%d %H:%M:%S') - $1" >> "$LOG_FILE"
}

# Function to query vulnerabilities
get_vulnerabilities() {
    	local response
    	response=$(curl -s -H "X-API-Key: $DT_API_KEY" \
    	"$DT_API_URL/vulnerability/project/$PROJECT_UUID")

    	if [ $? -eq 0 ] && [ -n "$response" ]; then
    	echo "$response" | jq -c '.[] | {
            	vulnId: .vulnId,
            	severity: .severity,
            	cvssScore: (.cvssV3BaseScore // .cvssV2BaseScore),
            	component: .components[0].name,
            	version: .components[0].version,
            	project: .components[0].project.name,
            	description: .description,
            	published: .published
    	}' 2>/dev/null
    	else
    	log_message "ERROR: Failed to fetch vulnerabilities from Dependency-Track"
    	return 1
    	fi
}

# Function to send to Wazuh
send_to_wazuh() {
    	local vuln_data="$1"

    	# Format for Wazuh logging
    	echo "dependency_track: $vuln_data" | logger -t dependency_track -p local0.info
    	log_message "Sent vulnerability data to Wazuh: $(echo "$vuln_data" | jq -r '.vulnId // "unknown"')"
}

# Main execution
main() {
    	log_message "Starting Dependency-Track vulnerability scan"

    	# Check if jq is installed
    	if ! command -v jq &> /dev/null; then
    	log_message "ERROR: jq is not installed. Please install it with: apt install jq"
    	exit 1
    	fi

    	# Get vulnerabilities and process them
    	while IFS= read -r vuln; do
    	if [ -n "$vuln" ]; then
            	send_to_wazuh "$vuln"
    	fi
    	done < <(get_vulnerabilities)

    	log_message "Dependency-Track vulnerability scan completed"
}

# Execute main function
main "$@"
Replace:
<UBUNTU_IP>with the IP address of your Dependency-Track API server.<API_KEY>with your Dependency-Track API Key.<PROJECT_UUID>with your project UUID.
3. Add the executable permission for the owner and group to the /var/ossec/custom-script/dependency_track_monitor.sh file:
# chmod 750 /var/ossec/custom-script/dependency_track_monitor.sh
4. Change the ownership of the /var/ossec/custom-script/dependency_track_monitor.sh file and the directory where it is located:
# chown root:wazuh /var/ossec/custom-script/ -R
5. Create a log file /var/log/dependency_track.log:
# touch /var/log/dependency_track.log
6. Edit the Wazuh agent /var/ossec/etc/ossec.conf file and append the following configuration:
<ossec_config>
<!-- Dependency-Track monitor script -->
  <wodle name="command">
    <disabled>no</disabled>
    <tag>dependency-track</tag>
    <command>/var/ossec/custom-script/dependency_track_monitor.sh</command>
    <interval>1d</interval> <!-- Run every day-->
    <ignore_output>no</ignore_output>
    <run_on_start>yes</run_on_start>
    <timeout>0</timeout>
  </wodle>
</ossec_config>
Where:
disabledspecifies that the command is set to active.commandspecifies the location of thedependency_track_monitor.shscript to be executed.intervalspecifies the time interval for the execution of the configured script. In this blog post, the set value executes thedependency_track_monitor.shevery day. Set this value to your preferred time interval.ignore_outputdetermines whether the output of the command execution should be ignored. Setting it tonomeans that the output will be processed and logged by Wazuh.run_on_startspecifies that the Wazuh Command module configuration for thedependency_track_monitor.shscript runs immediately after the Wazuh agent service starts.timeoutsets the timeout option to 0. This means thedependency_track_monitor.shprocess will execute without any imposed time restrictions to halt it.
7. Restart the Wazuh agent to apply the above changes:
# systemctl restart wazuh-agent
Wazuh server
Create custom decoders and rules
Perform the steps below on the Wazuh server to create and configure custom decoders and rules for processing and monitoring logs generated from Dependency-Track.
Note
You need root user privileges to execute all the commands described below.
1. Create a file dependency_track_decoders.xml in the /var/ossec/etc/decoders/ directory:
# touch /var/ossec/etc/decoders/dependency_track_decoders.xml
2. Add the following decoder to the /var/ossec/etc/decoders/dependency_track_decoders.xml file to parse the Dependency-Track logs received from the Wazuh agent. This decoder processes logs from the dependency_track program, using a prematch string, and then delegates the parsing to the out-of-the-box Wazuh JSON Decoder.
<decoder name="dependency_track">
  <program_name>dependency_track</program_name>
  <prematch>dependency_track: </prematch>
  <plugin_decoder offset="after_prematch">JSON_Decoder</plugin_decoder>
</decoder>
3. Create a file dependency_track_rules.xml in the /var/ossec/etc/rules/ directory:
# touch /var/ossec/etc/rules/dependency_track_rules.xml
4. Add the following Wazuh rules to the /var/ossec/etc/rules/dependency_track_rules.xml file to detect the Dependency-Track results:
<group name="dependency_track,">
  <!-- Parent Rule -->
  <rule id="100810" level="3">
	<decoded_as>dependency_track</decoded_as>
    <description>Dependency-Track alerts</description>
  </rule>

  <!-- Critical Severity Rule -->
  <rule id="100811" level="12">
    <if_sid>100810</if_sid>
    <field name="severity">CRITICAL</field>
    <description>[Dependency-Track] CRITICAL severity vulnerability detected: $(vulnId) in Component: $(component) of Project: $(project)</description>
  </rule>

  <!-- High Severity Rule -->
  <rule id="100812" level="10">
    <if_sid>100810</if_sid>
    <field name="severity">HIGH</field>
    <description>[Dependency-Track] HIGH severity vulnerability detected: $(vulnId) in Component: $(component) of Project: $(project)</description>
  </rule>

  <!-- Medium Severity Rule -->
  <rule id="100813" level="8">
    <if_sid>100810</if_sid>
    <field name="severity">MEDIUM</field>
    <description>[Dependency-Track] MEDIUM severity vulnerability detected: $(vulnId) in Component: $(component) of Project: $(project)</description>
  </rule>

  <!-- Low Severity Rule -->
  <rule id="100814" level="6">
    <if_sid>100810</if_sid>
    <field name="severity">LOW</field>
    <description>[Dependency-Track] LOW severity vulnerability detected: $(vulnId) in Component: $(component) of Project: $(project)</description>
  </rule>

  <!-- Unassigned Severity Rule -->
  <rule id="100815" level="6">
    <if_sid>100810</if_sid>
    <field name="severity">UNASSIGNED</field>
    <description>[Dependency-Track] UNASSIGNED severity vulnerability detected: $(vulnId) in Component: $(component) of Project: $(project)</description>
  </rule>
</group>
Where:
- Rule ID
100811detects critical severity vulnerabilities from Dependency-Track. - Rule ID
100812detects high severity vulnerabilities from Dependency-Track. - Rule ID
100813detects medium severity vulnerabilities from Dependency-Track. - Rule ID
100814detects low severity vulnerabilities from Dependency-Track. - Rule ID
100815detects unassigned severity vulnerabilities from Dependency-Track.
5. Modify the ownership and permissions for the dependency_track_decoders.xml and dependency_track_rules.xml files:
# chown wazuh:wazuh /var/ossec/etc/rules/dependency_track_rules.xml /var/ossec/etc/decoders/dependency_track_decoders.xml
# chmod 660 /var/ossec/etc/rules/dependency_track_rules.xml /var/ossec/etc/decoders/dependency_track_decoders.xml
6. Restart the Wazuh manager to apply the above changes:
# systemctl restart wazuh-manager
Wazuh dashboard
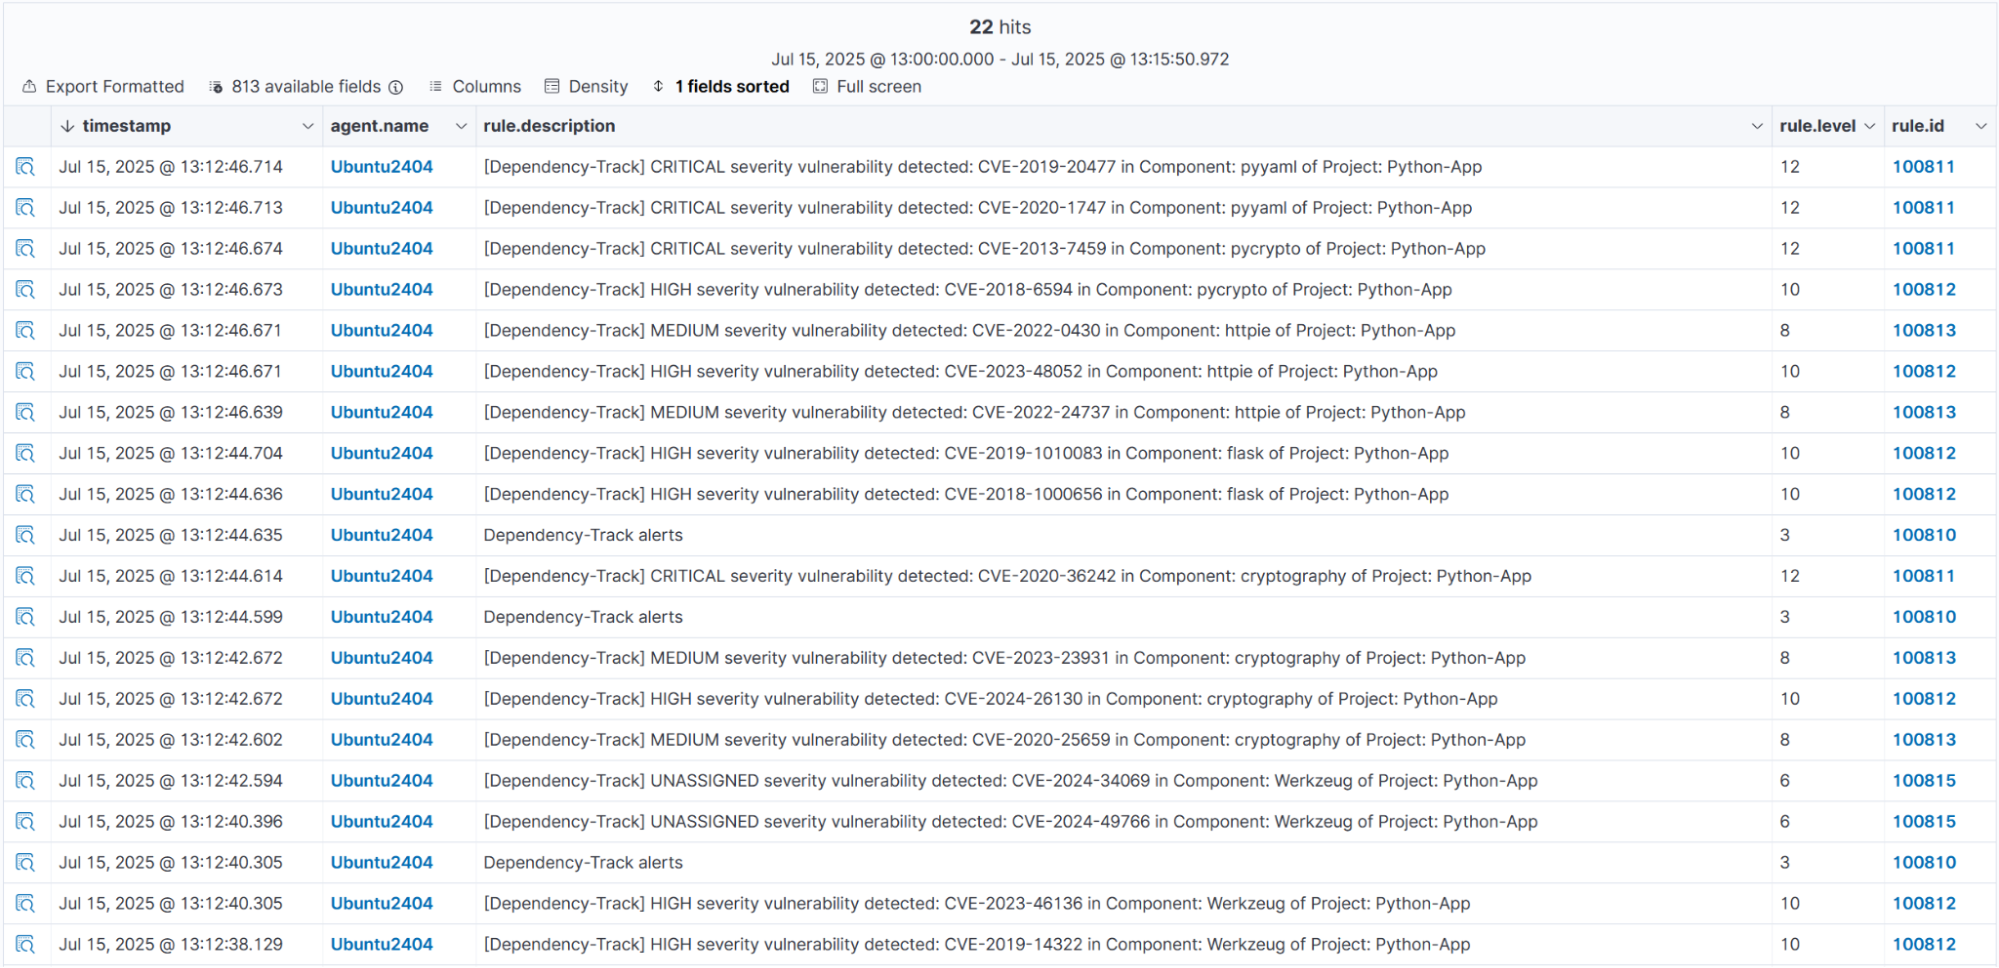
Perform the following steps to confirm alerts are generated on the Wazuh dashboard:
- Restart the Wazuh agent on the Ubuntu endpoint to generate alerts:
# systemctl restart wazuh-agent
- Navigate to Threat intelligence > Threat Hunting and click the Events tab.
- Click + Add filter. Then filter by
rule.groups. - In the Operator field, select
is. - Search and select
dependency_trackin the Values field. - Click Save.
Next, we perform the following to create visualizations and a custom dashboard for the Dependency-Track alerts on the Wazuh dashboard:
Create a saved search on the Wazuh dashboard
Perform the following steps to view the Dependency-Track alerts and create a saved search on the Wazuh dashboard.
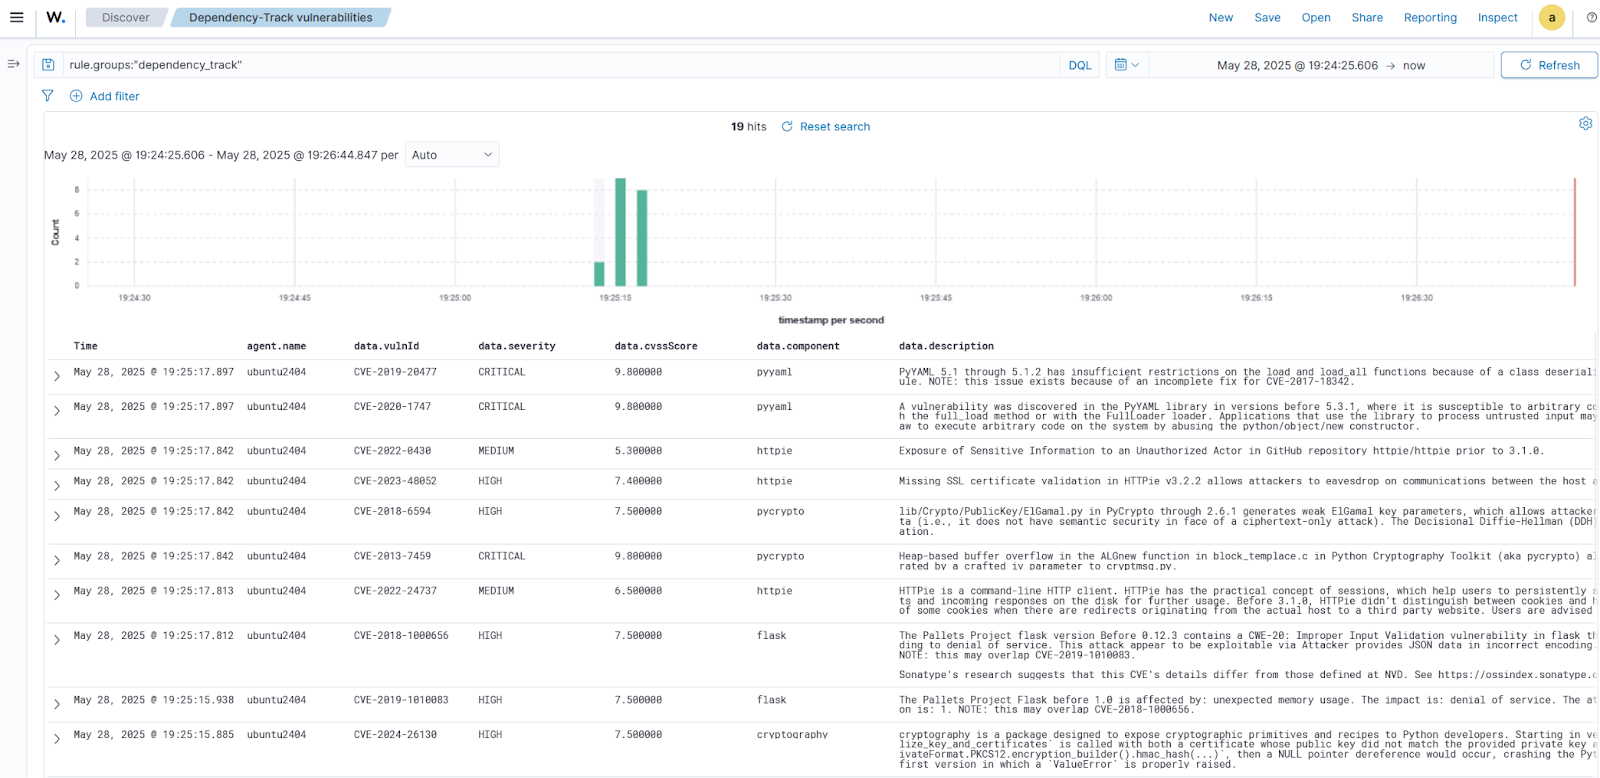
1. Navigate to Explore > Discover.
2. Type rule.groups:"dependency_track" in the search bar and hit the Enter button on your keyboard.
3. Under Available fields on the left pane, add the following fields as columns by hovering over each field and clicking the + icon beside it: agent.name, data.vulnId, data.severity, data.cvssScore, data.component, and data.description.
Note
If you do not see the fields under Available fields, refresh the fields list from the Index Patterns page. To do this, navigate to Dashboard management > Dashboards Management > Index Patterns. Select wazuh-alerts-* from the list, then click the refresh icon ⟳.
4. Click Save in the top right to save the query and enter “Dependency-Track vulnerabilities” in the Title textbox.
Create visualizations
Perform the following steps to create visualizations that will be used to create custom dashboards. We create a data table visualization and a pie chart visualization for the Dependency-Track alerts.
Data table
1. Navigate to Explore > Visualize.
2. Click Create visualization and select the Data table visualization format. Select Dependency-Track vulnerabilities.
3. Set the following value in the Data section, in Metrics:
- Aggregation =
Count
4. Click + Add under Buckets, select Split rows and use the following settings:
- Aggregation =
Terms - Field =
data.component - Order by =
Metric: Count - Order =
Descending - Size =
10
5. Customize the data tale by toggling on Show total in the Options section.
6. Click the Update button.
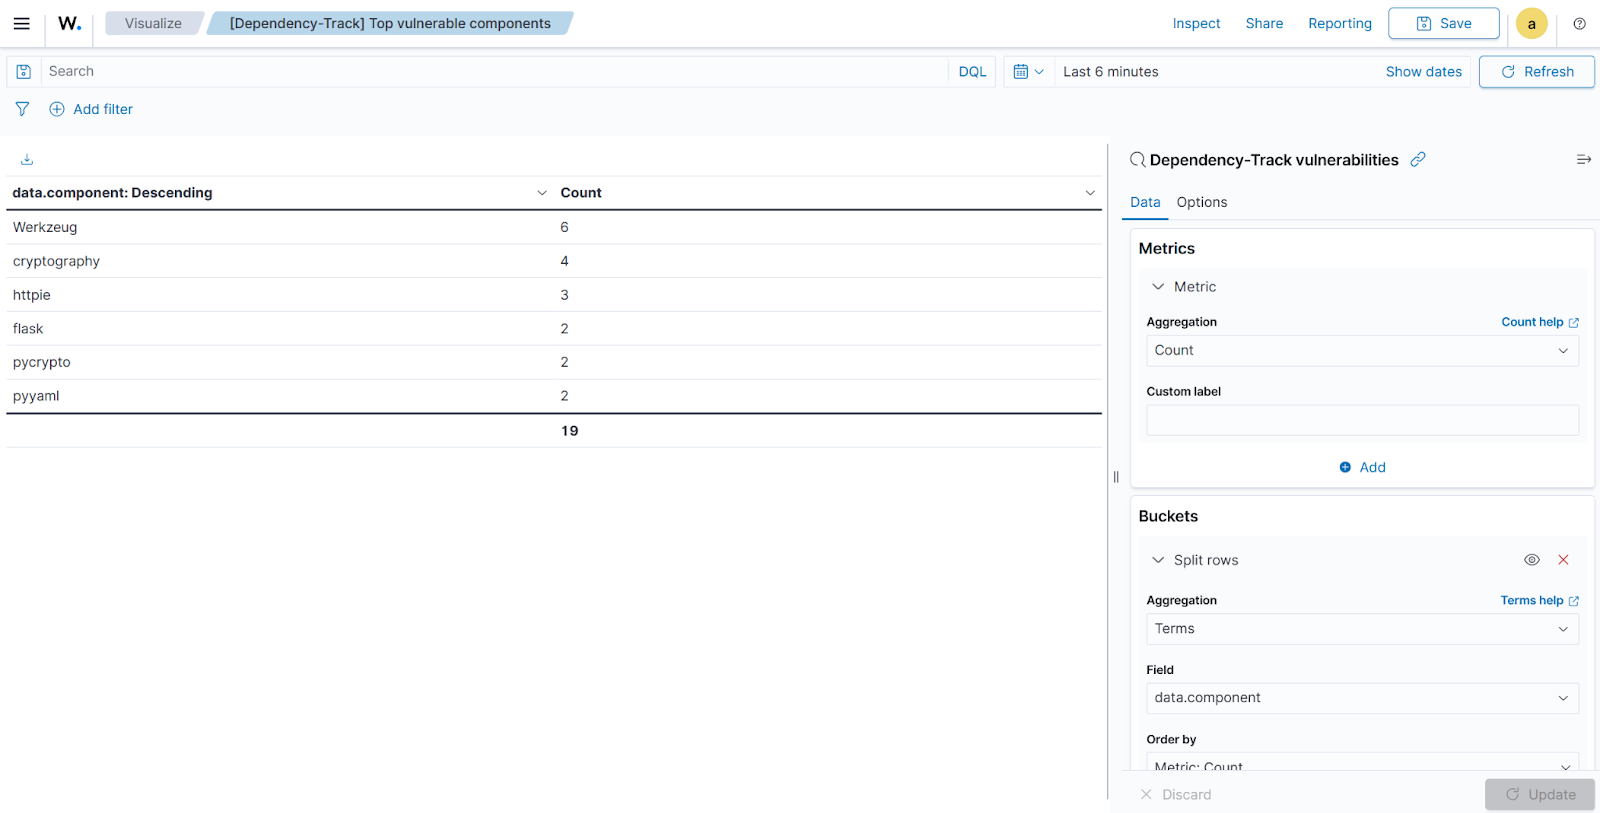
7. Click Save and save as “[Dependency-Track] Top vulnerable components”.
The image below displays a data table visualization showing the count of vulnerabilities per component based on alerts generated by Dependency-Track.
Pie chart
1. Navigate to Explore > Visualize.
2. Click Create new visualization or Create visualization and select the Pie visualization format. Select Dependency-Track vulnerabilities.
3. Set the following value in the Data section, on the Slice size, in Metrics:
- Aggregation =
Count
4. Add a Split slices in Bucket and set the following values:
- Aggregation =
Terms - Field =
data.severity - Order by =
Metric: Count - Order =
Descending - Size =
10
5. Customize the pie chart by toggling on show label in the Options section.
6. Click the Update button.
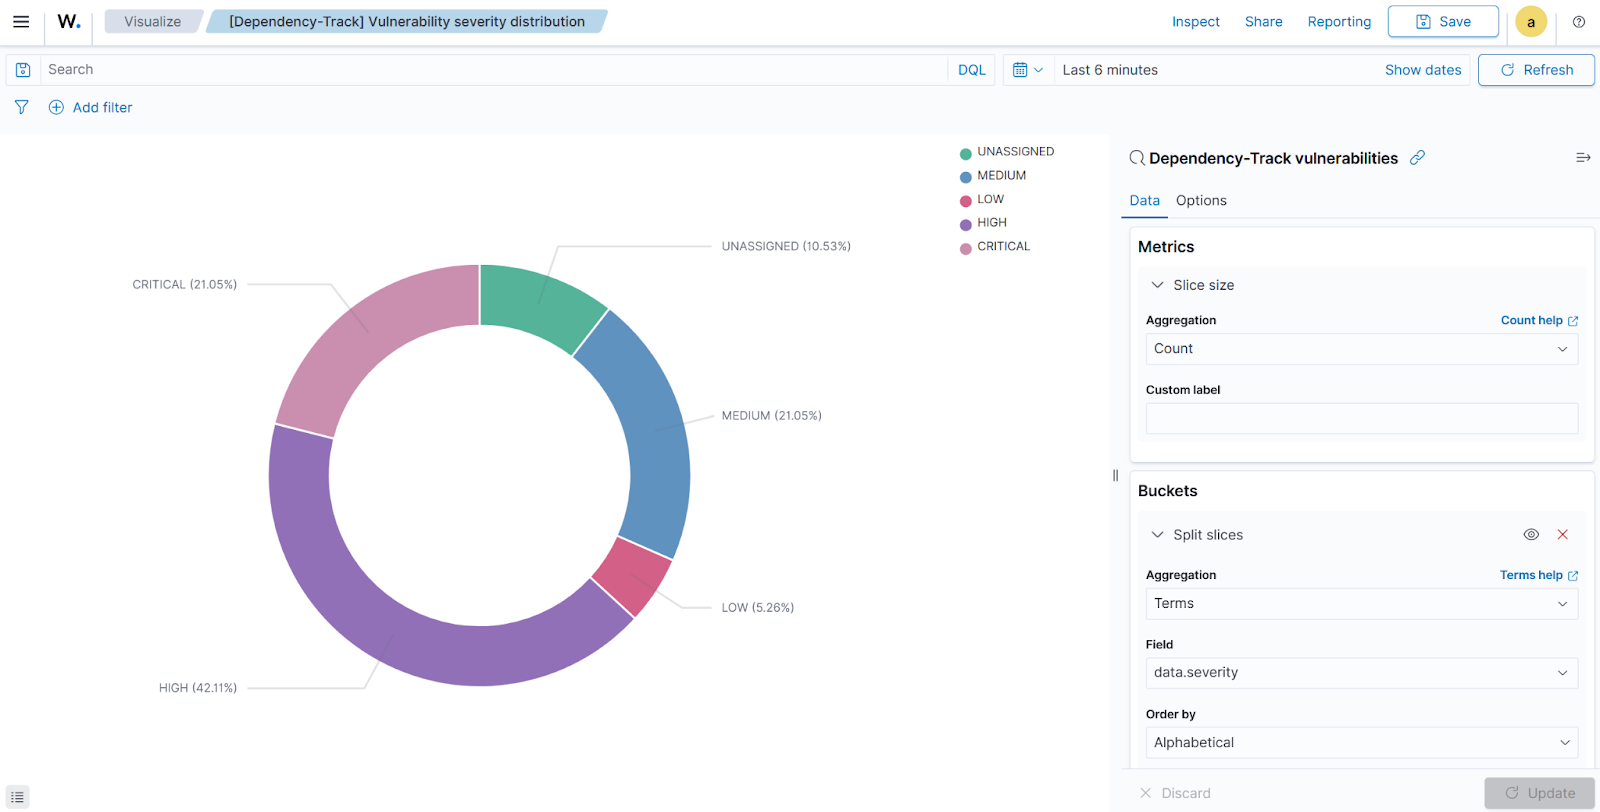
7. Click save and save as “[Dependency-Track] Vulnerability severity distribution”.
The image below displays a pie chart visualization showing the percentage of vulnerabilities by severity based on alerts generated by Dependency-Track
Create a custom dashboard
Create a custom dashboard using the data table and pie chart visualizations created earlier.
1. Navigate to Explore > Dashboards > Create New Dashboard.
2. Select Add an existing link and click the saved visualizations ([Dependency-Track] Top vulnerable components and [Dependency-Track] Vulnerability severity distribution). This will add the visualizations to the new dashboard.
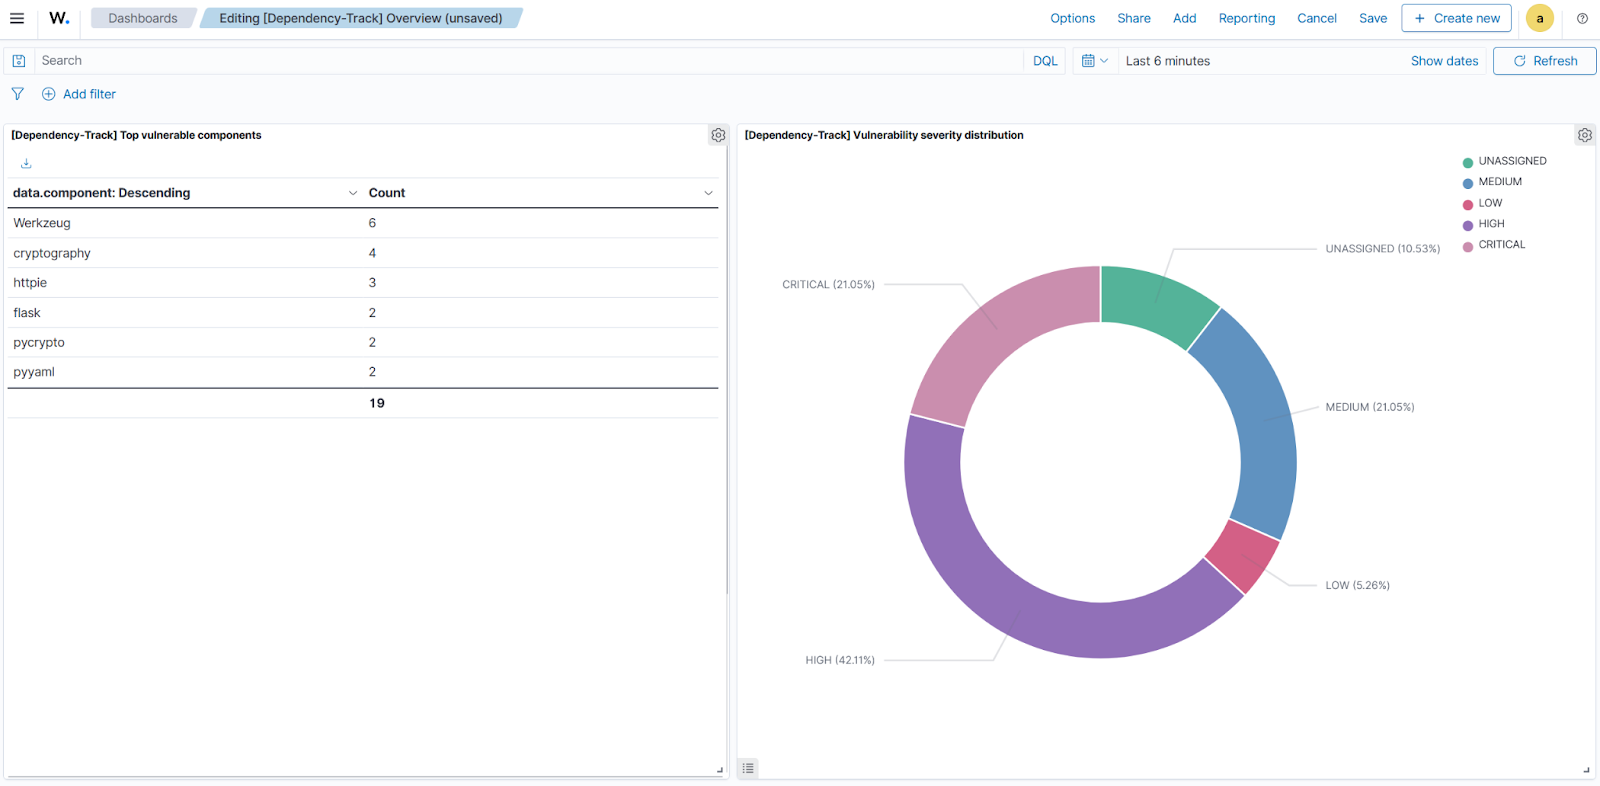
3. Save the dashboard as “[Dependency-Track] Overview”.
The image below displays a custom dashboard showing the previously created visualizations.
Conclusion
Integrating Dependency-Track with Wazuh provides visibility into software supply chain risks, resulting in a stronger overall security posture. By centralizing software supply chain vulnerability intelligence directly within the SOC, organizations gain visibility into potential risks within application dependencies. This integration enables proactive monitoring and prompt alerting, allowing teams to quickly identify and address vulnerabilities before they can be exploited.
You can further enhance this integration by configuring the Wazuh Active Response module to take automated actions when vulnerabilities are detected. This empowers teams to promptly address vulnerabilities, contributing to improved security and overall positive IT hygiene.
To learn more about Wazuh, explore our other blog posts and join the growing community.