SentinelOne XDR is designed to provide comprehensive protection against advanced threats and cyberattacks. By leveraging sophisticated behavioral analysis and threat intelligence, SentinelOne XDR delivers a robust defense mechanism to ensure a proactive and adaptive approach to cybersecurity.
By integrating SentinelOne XDR with Wazuh, a unified XDR and SIEM platform, security analysts and administrators can benefit from having a single pane of view for security logs from various sources.
Requirements
We use the following infrastructure to demonstrate the integration of SentinelOne with Wazuh:
- Wazuh 4.7.2 central components (Wazuh server, Wazuh indexer, Wazuh dashboard) installed using the Quickstart guide on an Ubuntu 22.04 server.
- A SentinelOne account.
- A Windows 11 endpoint with a SentineOne agent installed, to test the integration.
Configuration
SentinelOne provides various methods of exporting logs from the SentinelOne cloud console. In this blog, we highlight two of these methods:
- Exporting logs via syslog. This method requires that the destination syslog server is reachable over the internet (i.e. a public IP address).
- Exporting logs via SentinelOne API. This method requires the initiating endpoint to have internet connectivity.
The following section demonstrates how to use these methods to integrate SentinelOne with Wazuh.
Using syslog with TLS
Events from SentinelOne are sent over the internet to a destination syslog server. It is important that the connection is established securely to avoid the possibility of eavesdropping or leakage of sensitive data from SentinelOne. In this blog post, we use the Wazuh server as the syslog server however any other server can be used.
While the Wazuh remote service does not support Transport Layer Security (TLS), we can however utilize syslog-ng to establish a secure connection with the SentinelOne cloud console. The syslog-ng server receives the syslog messages from the SentinelOne cloud console and writes them to a log file. We can then configure a Wazuh agent (the Wazuh manager in this case) to monitor the log file and send retrieved logs to the Wazuh manager for analysis.
Wazuh server
Perform the following steps on the Wazuh server to set up syslog-ng and log collection from a log file.
1. Install syslog-ng:
# apt update
# apt install syslog-ng -y
2. Execute the commands to generate self-signed TLS certificates. Fill in your preferred details in the interactive prompt:
# cd /etc/syslog-ng/
# openssl req -newkey rsa:2048 -nodes -keyout key.pem -out request.csr
# openssl x509 -req -days 365 -in request.csr -signkey key.pem -out server-cert.pem
This generates a server certificate (server-cert.pem) and a key file (key.pem) which is required to configure TLS on syslog-ng.
Note: Skip this step if you already have your own self-signed or CA signed certificates. The certificates will be required in a future step.
The generated certificates have a validity of 365 days after which they will be required to be regenerated. You can customize the validity by increasing or decreasing the value of -days in the command.
3. Create a log file sentinelone.log in the /var/log/ directory to store logs received from the SentinelOne cloud console:
# touch /var/log/sentinelone.log
4. Append the following configuration to the /etc/syslog-ng/syslog-ng.conf configuration file:
# TLS Config
source s_network_tls {
    network(
        transport("tls")
        port(514)  # Specify the port to listen on for TLS connections
        tls(
            key-file("/etc/syslog-ng/key.pem")
            cert-file("/etc/syslog-ng/server-cert.pem")
            peer-verify(optional-untrusted)
        )
    );
};

destination d_tls_logs {
    file("/var/log/sentinelone.log"); # Path to save the logs received over TLS
};

log { source(s_network_tls); destination(d_tls_logs); };
Note: Edit the highlighted port number to suit your taste. If you are using your already existing certificates, replace the key-file and cert-file values with the appropriate path to your certificates.
5. Enable and start the syslog-ng service for the changes to take effect:
# systemctl daemon-reload
# systemctl enable syslog-ng
# systemctl start syslog-ng
6. Add the configuration below to the <ossec_config> block of the /var/ossec/etc/ossec.conf local configuration file to collect SentinelOne logs:
<localfile>
    <log_format>syslog</log_format>
    <location>/var/log/sentinelone.log</location>
</localfile>
Custom decoders
Follow the steps below to add custom decoders required to decode the SentinelOne logs.
1. Create a file sentinelone.xml in the /var/ossec/etc/decoders/ directory:
# touch /var/ossec/etc/decoders/sentinelone.xml
2. Add the following decoders to the sentinelone.xml file:
<decoder name="sentinelone">
    <prematch>sentinel -  CEF:\d\|SentinelOne\|</prematch>
</decoder>

<decoder name="sentinelone">
    <parent>sentinelone</parent>
    <regex>\|SentinelOne\|\w+\|\S+\|\d+\|(\.*) -</regex>
    <order>log_message1</order>
</decoder>

<decoder name="sentinelone">
    <parent>sentinelone</parent>
    <regex>\|SentinelOne\|\w+\|\S+\|\d+\|(\.*)\|\d+</regex>
    <order>log_message2</order>
</decoder>

<decoder name="sentinelone">
    <parent>sentinelone</parent>
    <regex>\|SentinelOne\|\w+\|\S+\|\d+\|\.* machine (\.*)\|\d+</regex>
    <order>endpoint</order>
</decoder>

<decoder name="sentinelone">
    <parent>sentinelone</parent>
    <regex>osName=(\w*)\s</regex>
    <order>operating_system</order>
</decoder>

<decoder name="sentinelone">
    <parent>sentinelone</parent>
    <regex>fileHash=(\S+)\s</regex>
    <order>file_hash</order>
</decoder>

<decoder name="sentinelone">
    <parent>sentinelone</parent>
    <regex>filePath=(\S+)\s</regex>
    <order>file_path</order>
</decoder>

<decoder name="sentinelone">
    <parent>sentinelone</parent>
    <regex>activityID=(\S+)</regex>
    <order>activity_id</order>
</decoder>

<decoder name="sentinelone">
  <parent>sentinelone</parent>
  <regex>suser=(\S+)</regex>
  <order>suser</order>
</decoder>
Custom rules
1. Create a file /var/ossec/etc/rules/sentinelone.xml:
# touch /var/ossec/etc/rules/sentinelone.xml
2. Add the following custom rules to the file:
<!-- Rules to detect SentinelOne events via syslog -->

<!-- SentinelOne logs grouped -->
<group name="sentinelone">
  <rule id="105000" level="2">
    <decoded_as>sentinelone</decoded_as>
    <description>Logs from SentinelOne.</description>
  </rule>

  <!-- Rule to detect successfully mitigated threat -->
  <rule id="105001" level="5">
    <if_sid>105000</if_sid>
    <field name="log_message2">Kill performed successfully</field>
    <description>SentinelOne: Threat $(file_path) successfully mitigated on $(suser).</description>
  </rule>

  <!-- Rule to detect active threat -->
  <rule id="105002" level="10">
    <if_sid>105000</if_sid>
    <field name="log_message1">New active threat</field>
    <description>SentinelOne: $(log_message1) $(file_path) detected on $(endpoint).</description>
  </rule>

  <!-- Rules to detect successful threat quarantine -->
  <rule id="105003" level="5">
    <if_sid>105000</if_sid>
    <field name="log_message2">Quarantine performed successfully</field>
    <description>SentinelOne: Threat file $(file_path) quarantined successfully on $(suser).</description>
  </rule>

</group>
Where:
- Rule ID
100500groups all SentinelOne events. - Rule ID
100501triggers when the process of a detected threat has been successfully killed. - Rule ID
100502triggers when a new threat is detected. - Rule ID
100503triggers when an identified threat is successfully mitigated.
3. Restart the Wazuh manager to apply the changes:
# systemctl restart wazuh-manager
SentinelOne UI
Perform the following steps on the SentinelOne cloud console to configure the Wazuh server as a syslog destination.
1. Navigate to SETTINGS > INTEGRATIONS > SYSLOG.
2. Click the enable syslog button. Fill in the IP address and port of the syslog-ng server:
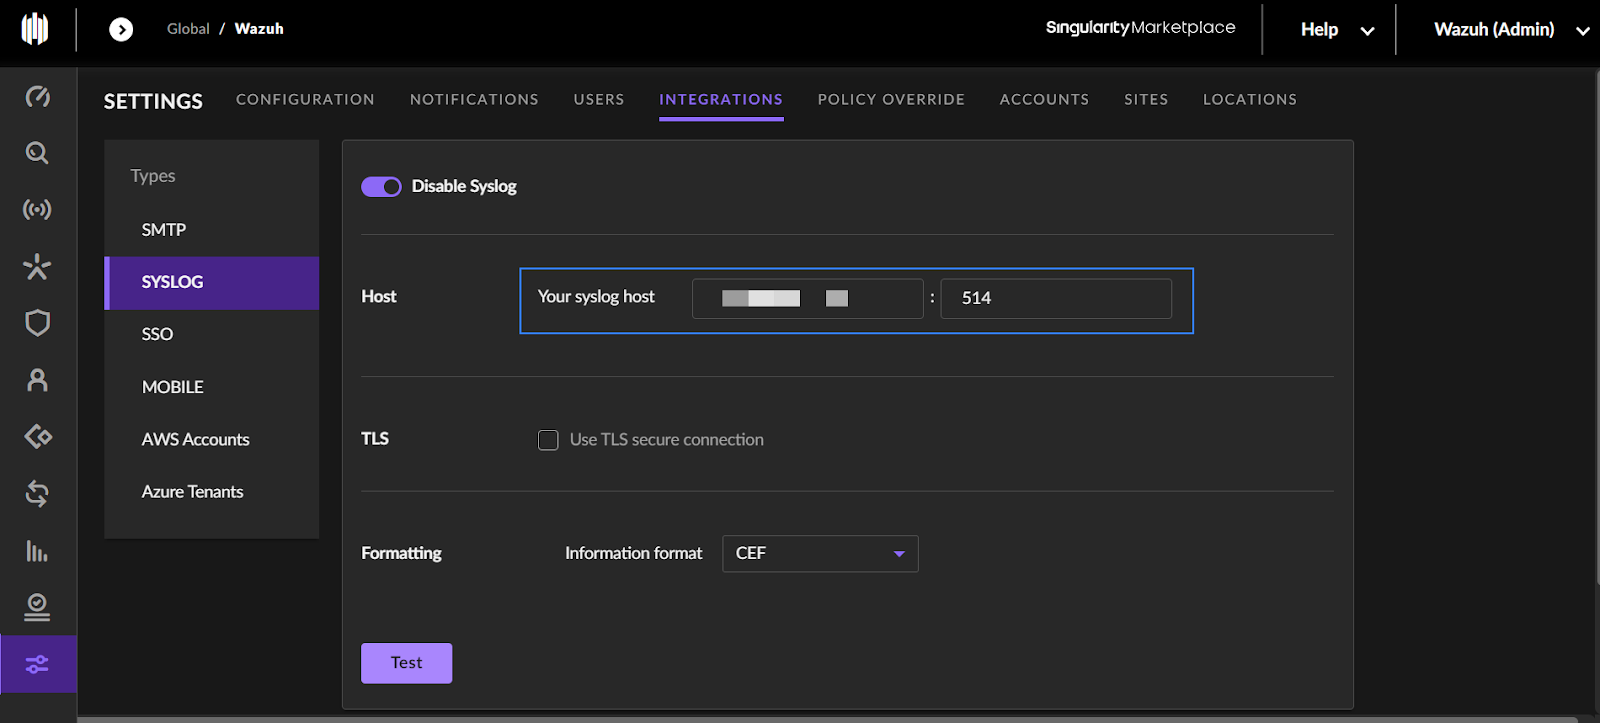
4. Select the Use TLS secure connection checkbox. This opens fields for TLS configuration.
5. Upload the server certificate (server-cert.pem) generated earlier.
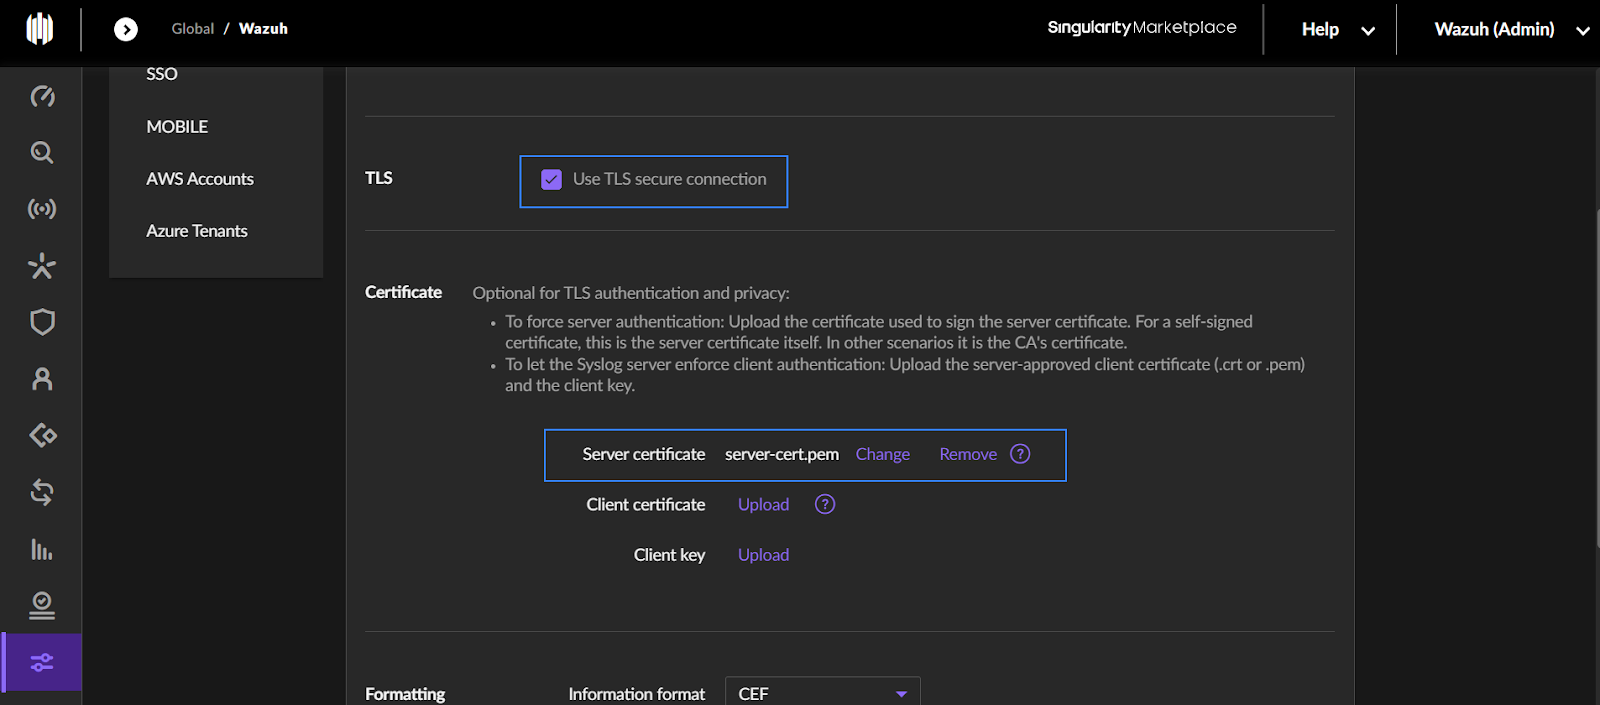
6. Click on Test to verify the connection.
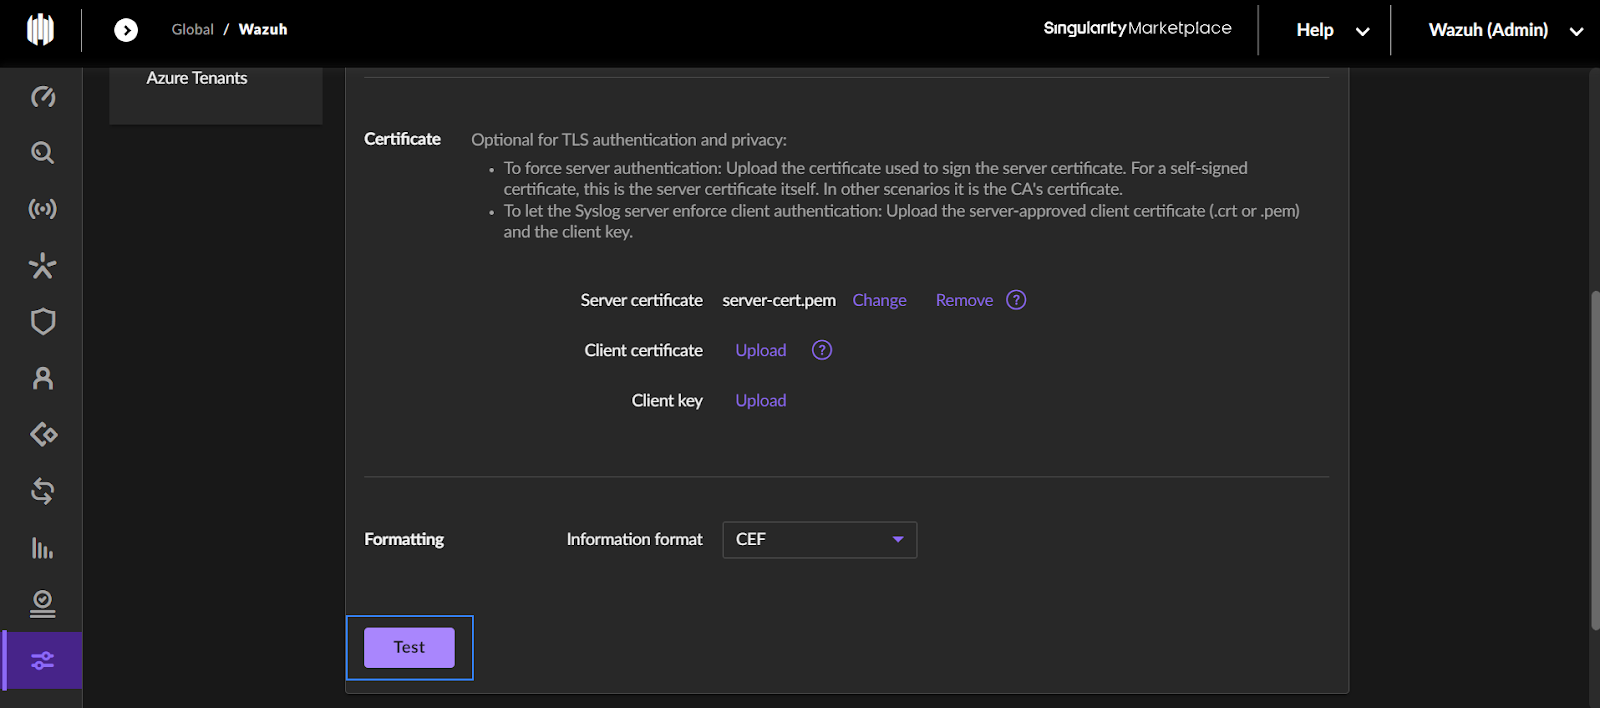
If the configuration is correct, Success is printed to the screen.
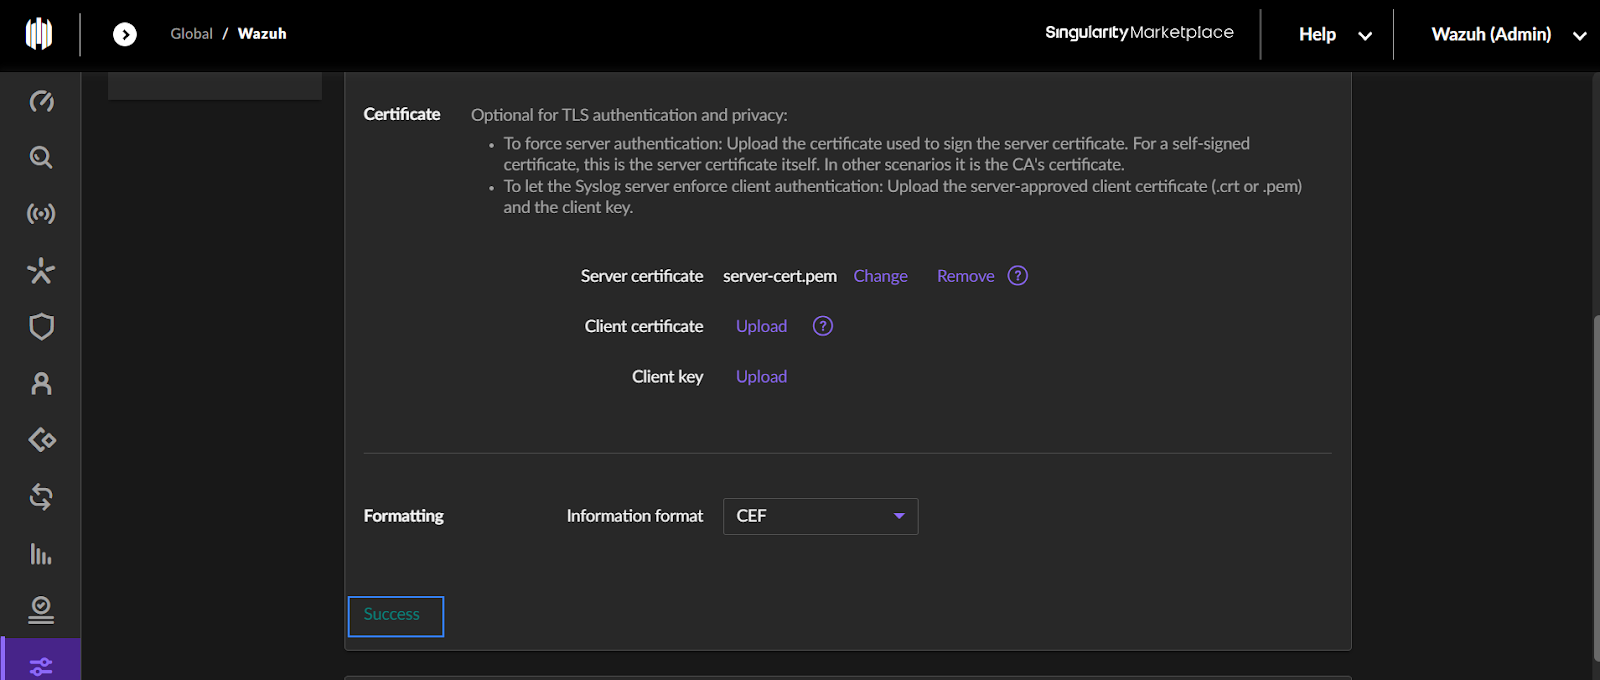
The /var/log/sentinelone.log file on the Wazuh server will also contain a message similar to the one shown below:
OUTPUTJan 31 01:21:35 0.0.0.0 2024-01-31 01:21:35,899 sentinel - SentinelOne Syslog connection established successfully! |
7. Click Save to save the configuration.
8. Configure which SentinelOne activities to trigger syslog messages. Navigate to Settings > Notifications and select your preferred activities under the Syslog column.
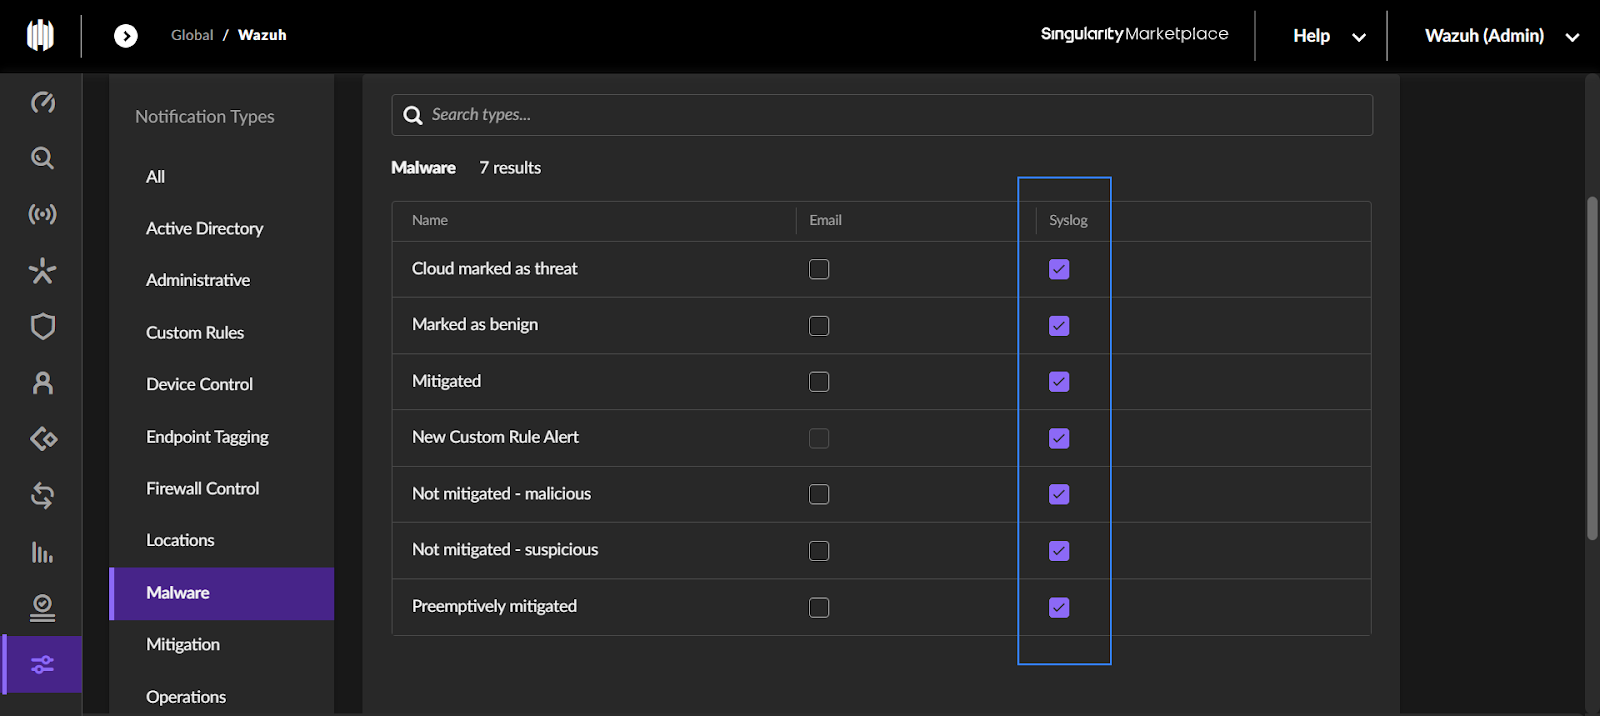
9. Click Save to save the configuration.
Testing the integration
To test the integration, download an anti malware test file on the Windows 11 endpoint running the SentinelOne agent:
> curl "https://secure.eicar.org/eicar.com.txt" -o eicar
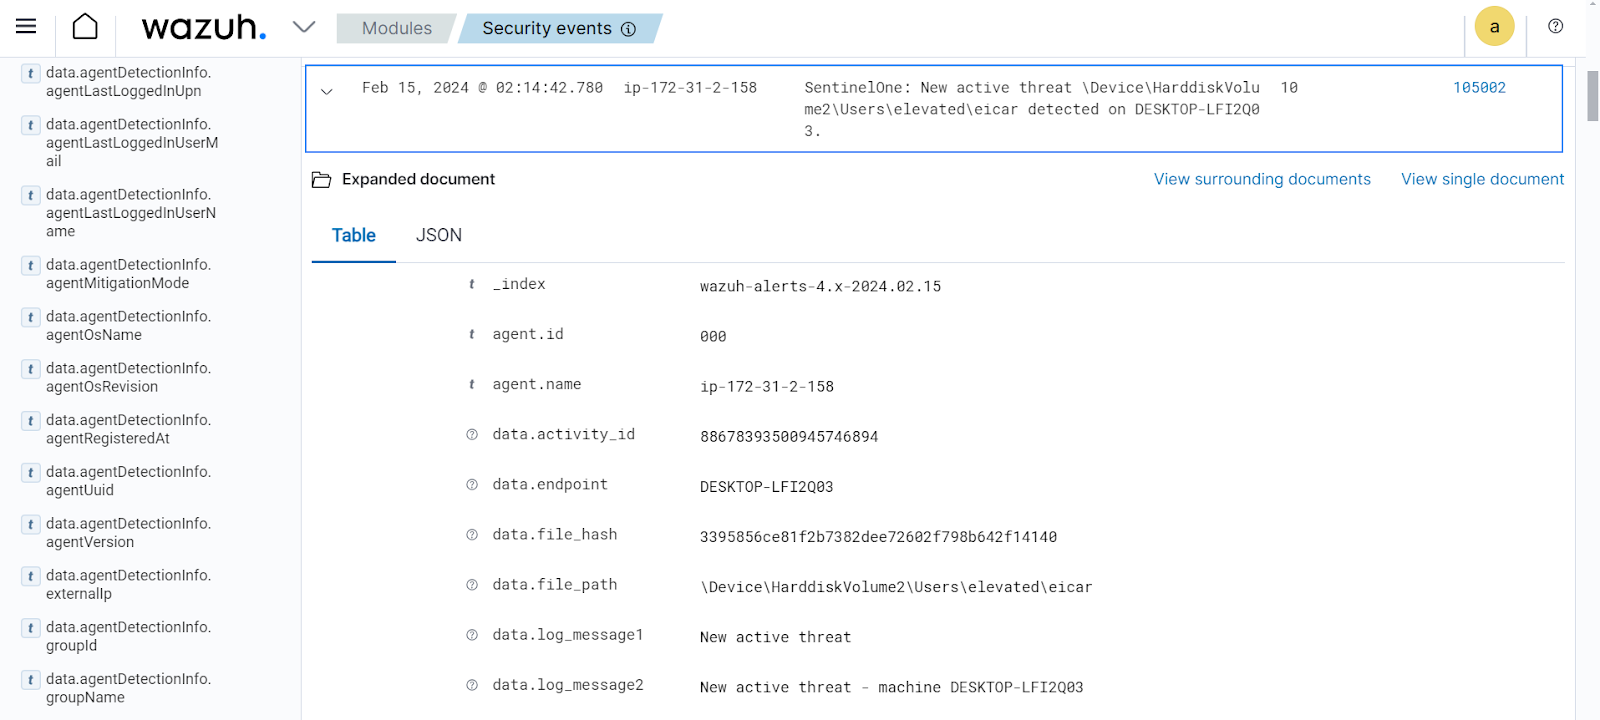
This will trigger an alert with rule ID 105002, navigate to the Modules > Security events to view the alert.
Using the SentinelOne API
The SentinelOne API provides an endpoint for retrieving logs. You can use this API endpoint to get logs from the SentinelOne cloud console if you do not have a publicly accessible server. The API provides logs in JSON format, which means the inbuilt Wazuh JSON decoder can easily decode the logs without the need for custom decoders. Another advantage of the API method is that it provides richer logs than that provided by the syslog alerts.
Follow the steps below to configure log collection via the SentinelOne API.
SentinelOne UI
Generate an API key following the steps below.
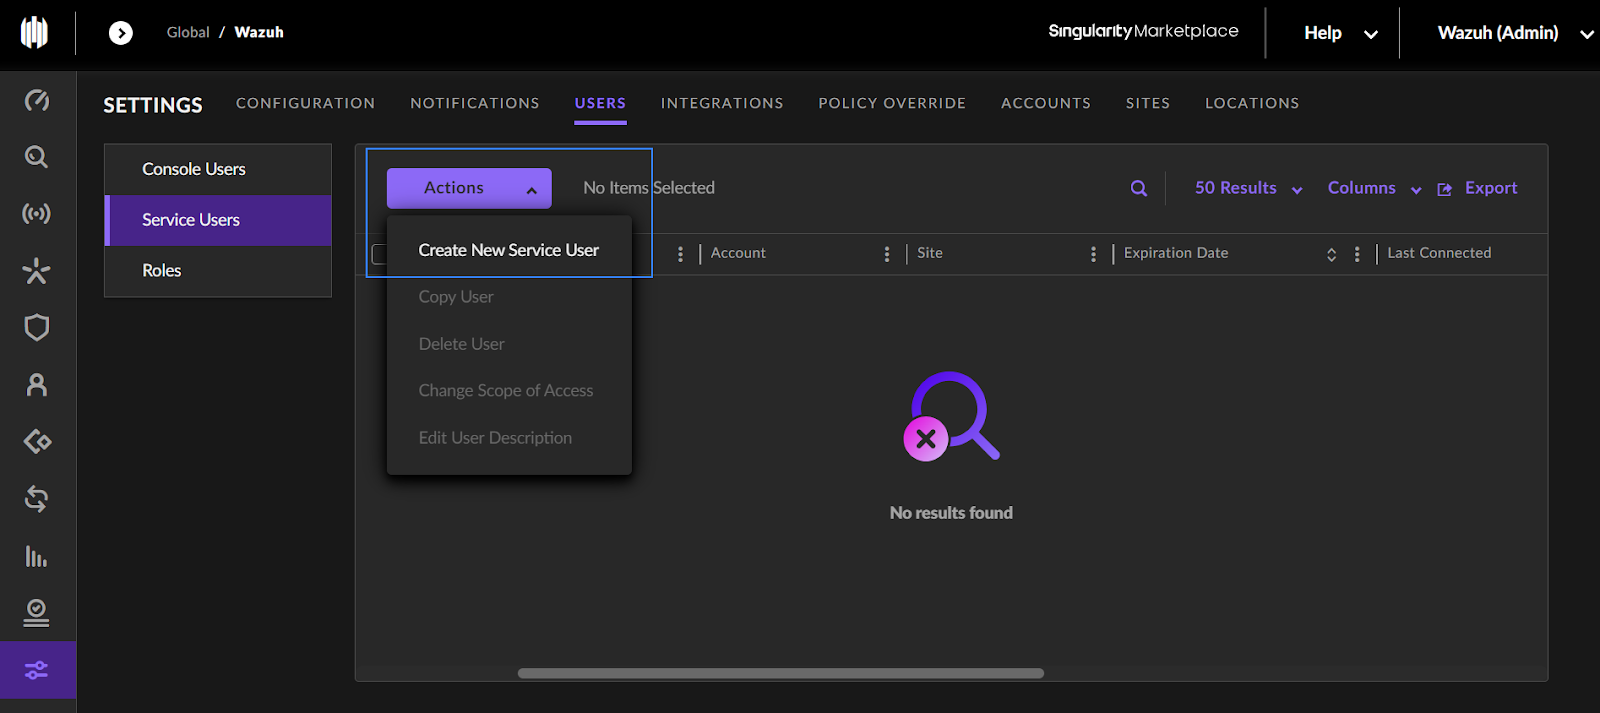
1. Navigate to SETTINGS > USERS > Service Users.
2. Click on the Actions dropdown menu and select Create New Service User.
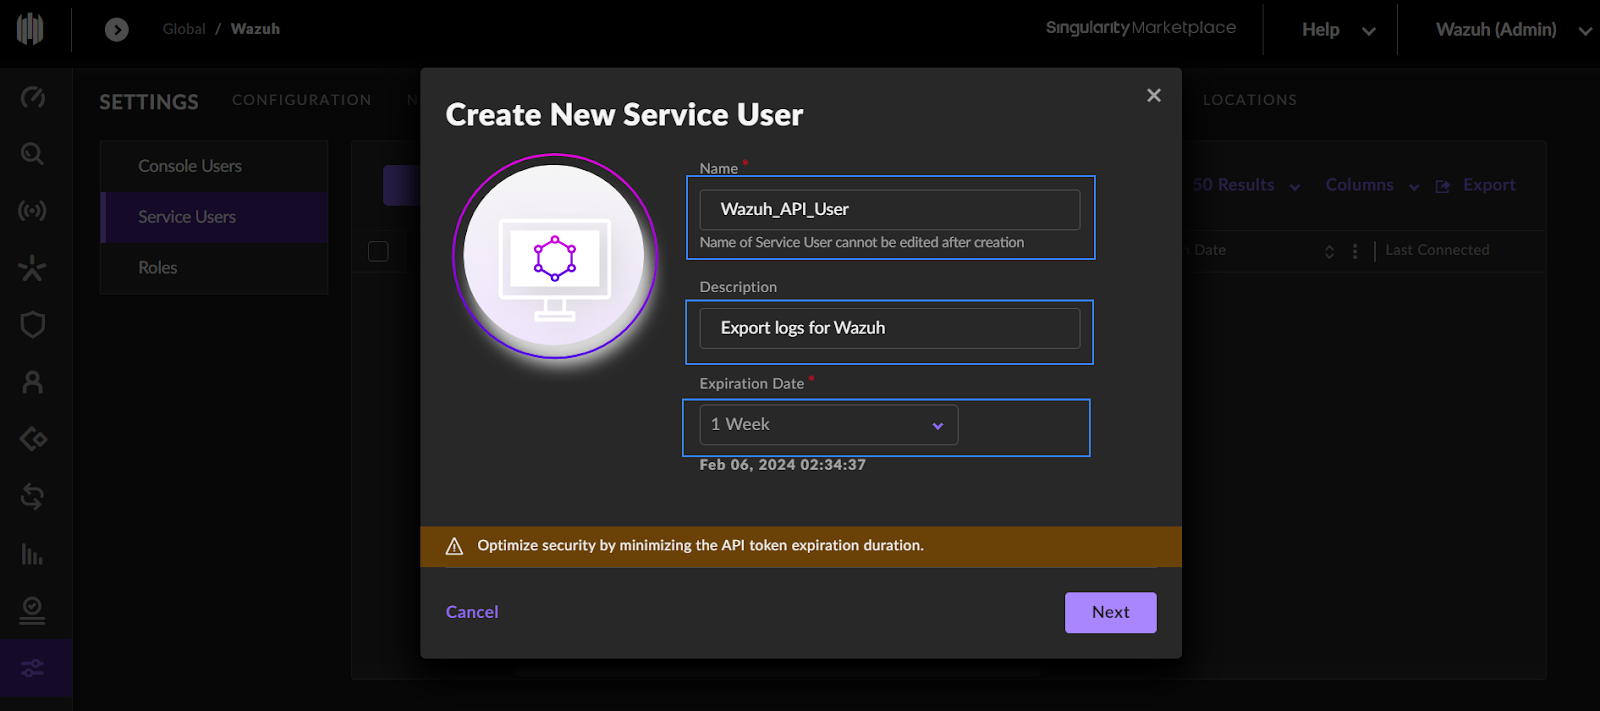
3. Set appropriate values for the Name, Description, and Expiration Date fields and click Next:
4. Select the Scope of Access for the user. The Account Scope of Access is valid for the entire SentinelOne cloud console account while the Site Scope of Access is only valid for a particular site under the SentinelOne cloud console account.
5. Select the Viewer permission then click Create User then input your 2FA code.
6. Copy the generated API token.
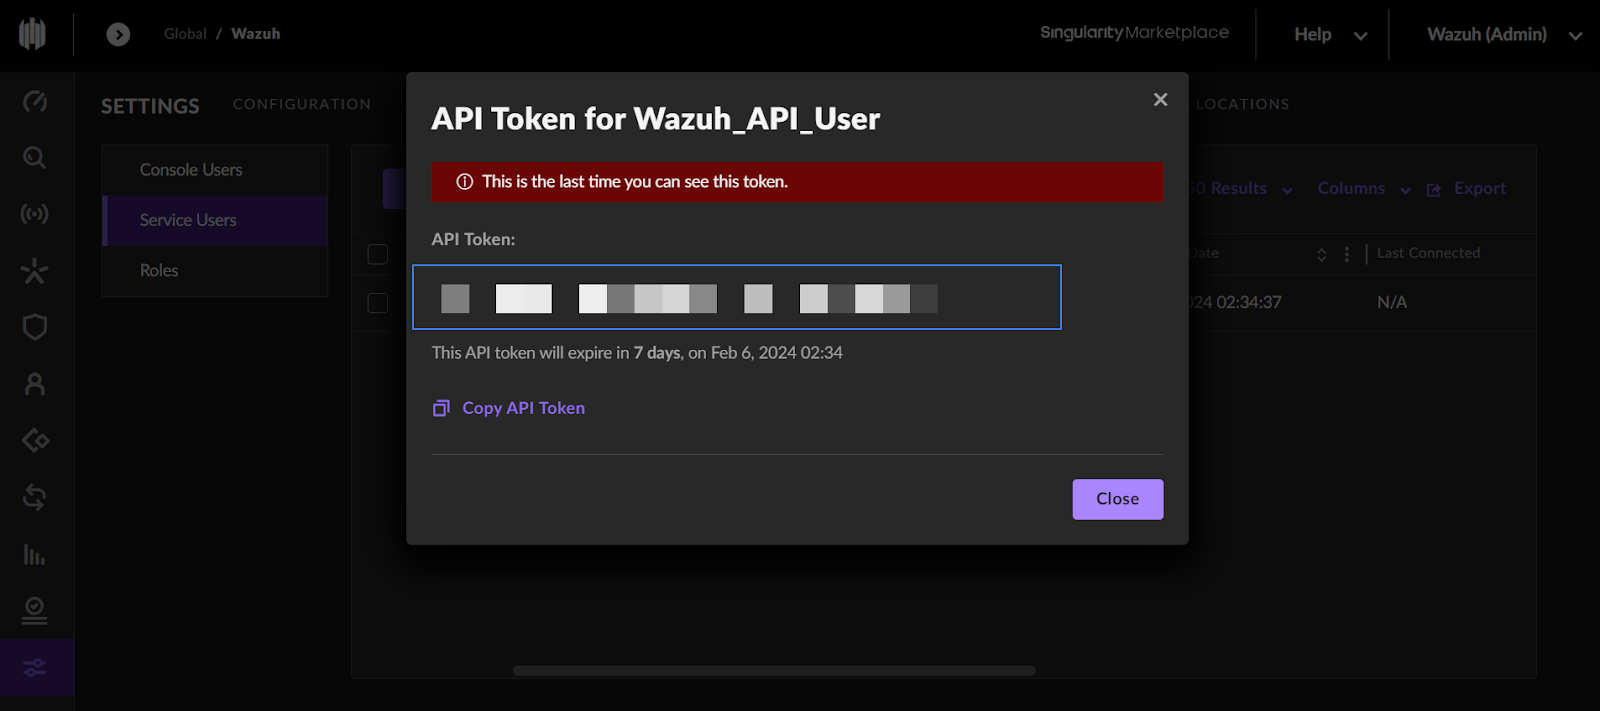
Wazuh server
In this section, we create a script that communicates with the SentinelOne cloud console to retrieve logs. We also create custom rules to trigger alerts when events of interest are captured by SentinelOne. Follow the steps below to configure the Wazuh server for log collection from SentinelOne API.
1. Create a Python script at /var/ossec/integrations/sentinel_one.py to connect to the SentinelOne API and retrieve alerts. Replace the <API_KEY> and <MANAGEMENT_CONSOLE_URL> variables with the appropriate values. The <MANAGEMENT_CONSOLE_URL> refers to your unique URL used to access the SentinelOne cloud console, for example, my-console.sentinelone.net.
Warning: We recommend you use a secret management solution to store the value of the <API_KEY> variable instead of hardcoding them in the script. Use the script as it is only for testing purposes. You can modify the script to extract the credentials from your secret management solution when using it in production. |
import os
import re
import requests
import json
from datetime import datetime

# User-defined variables
api_url = "https://<MANAGEMENT_CONSOLE_URL>/web/api/v2.1/threats?limit=10"
api_key = "<API_KEY>"
log_file_path = "/var/log/sentinelone.json"
custom_timestamp = "" #Enter your preferred timestamp within the quotes using the format 2023-01-01T00:00:00


def get_last_timestamp(log_file_path):
    try:
        with open(log_file_path, 'r') as file:
            lines = file.readlines()
            if lines:
                last_line = lines[-1].strip()
                match = re.search(r'"createdAt":\s*"([^"]+)"', last_line)
                if match:
                    last_created_at = match.group(1)
                    last_timestamp = datetime.strptime(last_created_at, "%Y-%m-%dT%H:%M:%S.%fZ").isoformat()
                    return last_timestamp
                else:
                    return None
            else:
                return None
    except FileNotFoundError:
        return None

def get_logs(start_timestamp):
    headers = {
        'Authorization': f'ApiToken {api_key}',
        'Content-Type': 'application/json'
    }

    # Construct query parameters
    params = {}
    if start_timestamp:
        params['createdAt__gt'] = start_timestamp

    response = requests.get(api_url, headers=headers, params=params)
    if response.status_code == 200:
        return response.json()
    else:
        print(f"Failed to fetch logs: {response.status_code}")
        return None

def main():
    # Get the last timestamp from the log file
    last_timestamp = get_last_timestamp(log_file_path)
    if last_timestamp:
        print(f"Last timestamp in log file: {last_timestamp}")
    else:
        print("Log file is empty or doesn't exist.")

    if custom_timestamp:
        # If custom timestamp is specified, check the log file first
        last_timestamp_from_file = get_last_timestamp(log_file_path)
        if last_timestamp_from_file:
            start_timestamp = last_timestamp_from_file
            print(f"Using last timestamp from log file: {start_timestamp}")
        else:
            start_timestamp = custom_timestamp
            print(f"Using custom timestamp: {start_timestamp}")
    else:
        start_timestamp = last_timestamp
        if last_timestamp:
            print(f"Using last timestamp from log file: {start_timestamp}")
        else:
            print("No last timestamp found in log file.")
            start_timestamp = None  # Reset start timestamp to None if neither custom nor file timestamp available

    # Query the SentinelOne API for logs since the start timestamp
    logs = get_logs(start_timestamp)

    if logs:
        # Write the logs to the local log file
        with open(log_file_path, 'a') as file:
            for log in logs['data']:
                file.write(json.dumps(log))
                file.write('\n')
        print(f"Logs written to {log_file_path}")
    else:
        print("No logs fetched.")

if __name__ == "__main__":
    main()
Note: On default, the script retrieves the earliest log available on your SentinelOne cloud account. If you prefer the logs to be retrieved from a specific time, set your preferred timestamp as the value of custom_timestamp.
2. Set the ownership and permissions of the /var/ossec/integrations/sentinel_one.py file. This ensures the script is only available to the root and wazuh users:
# chown root:wazuh /var/ossec/integrations/sentinel_one.py
# chmod 750 /var/ossec/integrations/sentinel_one.py
3. Add the following configuration to the <ossec_config> block of the /var/ossec/etc/ossec.conf local configuration file to automate the execution of the script. We also configure the Wazuh Logcollector module to monitor the SentinelOne log file for new logs:
Note: You can also automate the execution of the script using other utilities like cronjob.
<wodle name="command">
  <disabled>no</disabled>
  <command>/var/ossec/framework/python/bin/python3 /var/ossec/integrations/sentinel_one.py</command>
  <interval>1m</interval>
  <ignore_output>yes</ignore_output>
  <run_on_start>yes</run_on_start>
  <timeout>0</timeout>
</wodle>

<localfile>
  <log_format>json</log_format>
  <location>/var/log/sentinelone.json</location>
</localfile>
Note: The <interval> tag specifies the interval between the execution of the script.
The monitored /var/log/sentinelone.json file is created upon the execution of the /var/ossec/integrations/sentinel_one.py script. Logs retrieved from the SentinelOne API are stored in this file.
Custom rules
1. Create a rule file /var/ossec/etc/rules/sentinelone.xml and add the following rules:
<!-- Rules for SentinelOne via API -->

<!-- SentinelOne logs grouped -->
<group name="sentinelone_API">
  <rule id="100600" level="3">
    <decoded_as>json</decoded_as>
    <location>/var/log/sentinelone.json</location>
    <description>Logs from SentinelOne.</description>
  </rule>

  <!-- Rules to detect active threat -->
  <rule id="100601" level="10">
    <if_sid>100600</if_sid>
    <field name="agentDetectionInfo.agentMitigationMode">detect</field>
    <description>SentinelOne: New active threat $(threatInfo.threatName) detected on $(agentRealtimeInfo.agentComputerName).</description>
  </rule>

  <!-- Rules to detect successfully mitigated threat -->
  <rule id="100602" level="5">
    <if_sid>100600</if_sid>
    <field name="threatInfo.mitigationStatus">mitigated</field>
    <description>SentinelOne: Threat $(threatInfo.threatName) successfully mitigated on $(agentRealtimeInfo.agentComputerName).</description>
  </rule>

    <!-- Rules to detect multiple active threats -->
    <rule id="100603" level="12" ignore="120">
      <if_sid>100600</if_sid>
      <field name="agentRealtimeInfo.activeThreats">[4-9]\d*|\d{2,}</field>
      <description>SentinelOne: Multiple active threats detected on $(agentRealtimeInfo.agentComputerName).</description>
    </rule>

  <!-- Rules to detect reboot required -->
  <rule id="100604" level="7">
    <if_sid>100600</if_sid>
    <field name="agentRealtimeInfo.rebootRequired">true</field>
    <description>SentinelOne: System reboot required on $(agentRealtimeInfo.agentComputerName) to complete actions.</description>
  </rule>
</group>
Where:
- Rule ID
100600groups all SentinelOne events. - Rule ID
100601triggers when a new threat is detected. - Rule ID
100602triggers when an identified threat is successfully mitigated. - Rule ID
100603detects when there are multiple active threats (3 and above) on an endpoint. - Rule ID
100604triggers when an endpoint requires a reboot to complete actions.
2. Restart the Wazuh manager to apply the changes:
# systemctl restart wazuh-manager
Testing the integration
To test the integration, download an anti malware test file on a test endpoint where a SentinelOne agent is running.
> curl "https://secure.eicar.org/eicar.com.txt" -o eicar
This will trigger an alert with rule ID 106001, navigate to the Modules > Security events to view the alert.
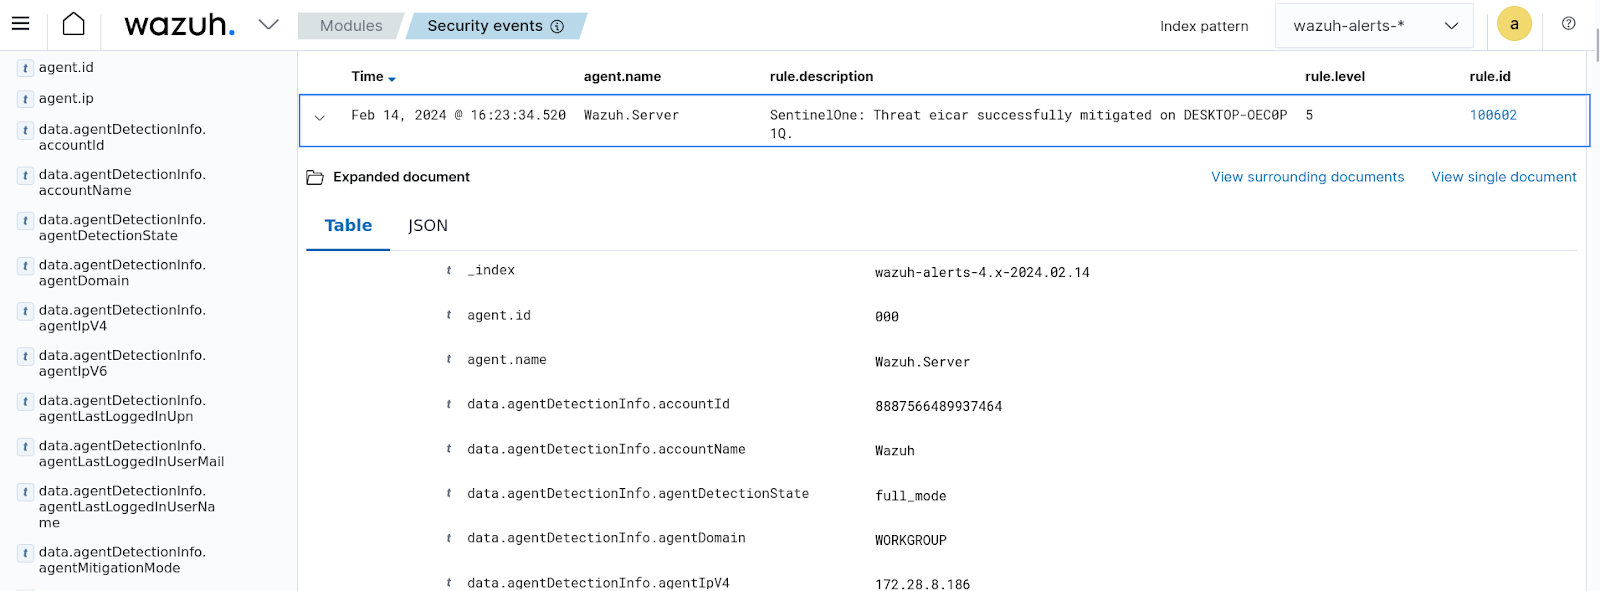
Note: The above rule is triggered due to the SentinelOne Protection Mode being set to Protect. If your SentinelOne policy is set to Detect, then rule ID 100601 will trigger instead.
Conclusion
In this blog post, we demonstrated how you can integrate SentinelOne XDR with Wazuh. This helps to streamline your security monitoring activities by offering a single pane of glass view of your security events.
Wazuh is a free and open source SIEM and XDR solution. Wazuh can be deployed and managed on-premises, or on the Wazuh cloud. Check out our community for support and updates.
References
