DevSecOps, which stands for Development, Security, and Operations, is a methodology that integrates security practices into the software development lifecycle. It emphasizes integrating security into every phase of the software development lifecycle rather than treating it as a separate or final step. By embedding security checks early, DevSecOps detects vulnerabilities sooner. Integrating security into Continuous Integration and Continuous Deployment (CI/CD) pipelines further reduces costs, accelerates remediation, and minimizes security risks.
Integrating Wazuh with DefectDojo for DevSecOps focuses on forwarding application security scan results from DefectDojo to Wazuh, unifying your security events for better management and response. DefectDojo is an open source application vulnerability management tool that collects security scan results from multiple application scanning solutions. On the other hand, Wazuh offers SIEM (Security Information and Event Management) and XDR (Extended Detection and Response) capabilities across IT environments.
Application security scan results from DefectDojo are pushed to Wazuh, while security events and vulnerabilities from endpoints within an IT environment are detected by Wazuh. Wazuh then serves as the central platform for aggregating and analyzing all security events from both applications and the IT environment. Together, Wazuh and DefectDojo offer improved visibility and control of security defects within a DevSecOps environment.
In this blog post, we demonstrate how to integrate Wazuh with cloud-native tools like DefectDojo for DevSecOps.
Infrastructure
The infrastructure below is used to illustrate the Wazuh integration with DefectDojo for DevSecOps:
- A pre-built, ready-to-use Wazuh OVA 4.9.2. Follow this guide to download the virtual machine.
- A GitLab account is used for Continuous Integration and Continuous Deployment (CI/CD).
- An Ubuntu 24.04 endpoint with:
- Docker Engine and Docker Compose installed.
- The Wazuh agent 4.9.2 installed.
- A self-managed GitLab runner 17.6.0 installed.
We will install the DefectDojo application on this endpoint.
The diagram below provides an architectural overview of our infrastructure workflow.
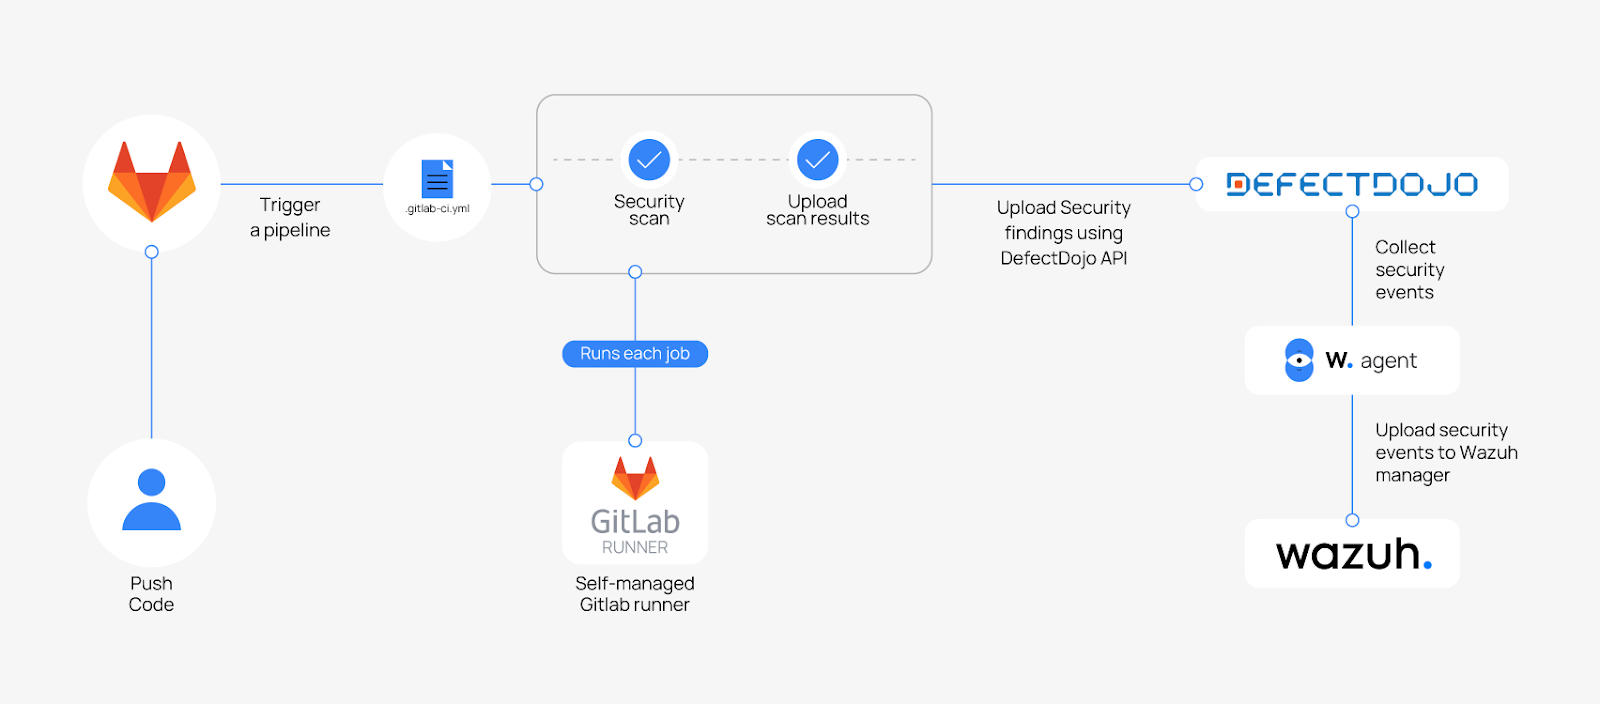
Configuration
This section outlines the steps to set up DefectDojo and configure a CI/CD pipeline with security scans. It also explains how to push scan results to DefectDojo and integrate the findings into Wazuh for comprehensive analysis.
Ubuntu endpoint
We use Docker Engine and Docker Compose preinstalled in Ubuntu 24.04 to deploy the DefectDojo application. In this section, we show how to set up DefectDojo for our integration.
Perform the following steps to install DefectDojo on the Ubuntu endpoint:
1. Clone the DefectDojo 2.40.1 release repository and navigate into its directory:
# git clone -b release/2.40.1 https://github.com/DefectDojo/django-DefectDojo
# cd django-DefectDojo
2. Replace the content of the docker-compose.yml file with the below configuration to enforce HTTPS only:
# This docker-compose.yml file  is fully functional to evaluate DefectDojo
# in your local environment.
#
# Although Docker Compose is one of the supported installation methods to
# deploy a containerized DefectDojo in a production environment, the
# docker-compose.yml file is not intended for production use without first
# customizing it to your particular situation.
---
services:
  nginx:
    build:
      context: ./
      dockerfile: "Dockerfile.nginx-${DEFECT_DOJO_OS:-debian}"
    image: "defectdojo/defectdojo-nginx:${NGINX_VERSION:-latest}"
    depends_on:
      - uwsgi
    environment:
      NGINX_METRICS_ENABLED: "${NGINX_METRICS_ENABLED:-false}"
      USE_TLS: 'true'
      GENERATE_TLS_CERTIFICATE: 'true'
    volumes:
      - defectdojo_media:/usr/share/nginx/html/media
    ports:
      - target: 8443
        published: 443
        protocol: tcp
        mode: host
  uwsgi:
    build:
      context: ./
      dockerfile: "Dockerfile.django-${DEFECT_DOJO_OS:-debian}"
      target: django
    image: "defectdojo/defectdojo-django:${DJANGO_VERSION:-latest}"
    depends_on:
      - postgres
    entrypoint: ['/wait-for-it.sh', '${DD_DATABASE_HOST:-postgres}:${DD_DATABASE_PORT:-5432}', '-t', '30', '--', '/entrypoint-uwsgi.sh']
    environment:
      DD_SESSION_COOKIE_SECURE: 'True'
      DD_CSRF_COOKIE_SECURE: 'True'
      DD_DEBUG: 'False'
      DD_DJANGO_METRICS_ENABLED: "${DD_DJANGO_METRICS_ENABLED:-False}"
      DD_ALLOWED_HOSTS: "${DD_ALLOWED_HOSTS:-*}"
      DD_DATABASE_URL: ${DD_DATABASE_URL:-postgresql://defectdojo:defectdojo@postgres:5432/defectdojo}
      DD_CELERY_BROKER_URL: ${DD_CELERY_BROKER_URL:-redis://redis:6379/0}
      DD_SECRET_KEY: "${DD_SECRET_KEY:-hhZCp@D28z!n@NED*yB!ROMt+WzsY*iq}"
      DD_CREDENTIAL_AES_256_KEY: "${DD_CREDENTIAL_AES_256_KEY:-&91a*agLqesc*0DJ+2*bAbsUZfR*4nLw}"
      DD_DATABASE_READINESS_TIMEOUT: "${DD_DATABASE_READINESS_TIMEOUT:-30}"
    volumes:
        - type: bind
          source: ./docker/extra_settings
          target: /app/docker/extra_settings
        - "defectdojo_media:${DD_MEDIA_ROOT:-/app/media}"
  celerybeat:
    image: "defectdojo/defectdojo-django:${DJANGO_VERSION:-latest}"
    depends_on:
      - postgres
      - redis
    entrypoint: ['/wait-for-it.sh', '${DD_DATABASE_HOST:-postgres}:${DD_DATABASE_PORT:-5432}', '-t', '30', '--', '/entrypoint-celery-beat.sh']
    environment:
      DD_DATABASE_URL: ${DD_DATABASE_URL:-postgresql://defectdojo:defectdojo@postgres:5432/defectdojo}
      DD_CELERY_BROKER_URL: ${DD_CELERY_BROKER_URL:-redis://redis:6379/0}
      DD_SECRET_KEY: "${DD_SECRET_KEY:-hhZCp@D28z!n@NED*yB!ROMt+WzsY*iq}"
      DD_CREDENTIAL_AES_256_KEY: "${DD_CREDENTIAL_AES_256_KEY:-&91a*agLqesc*0DJ+2*bAbsUZfR*4nLw}"
      DD_DATABASE_READINESS_TIMEOUT: "${DD_DATABASE_READINESS_TIMEOUT:-30}"
    volumes:
        - type: bind
          source: ./docker/extra_settings
          target: /app/docker/extra_settings
  celeryworker:
    image: "defectdojo/defectdojo-django:${DJANGO_VERSION:-latest}"
    depends_on:
      - postgres
      - redis
    entrypoint: ['/wait-for-it.sh', '${DD_DATABASE_HOST:-postgres}:${DD_DATABASE_PORT:-5432}', '-t', '30', '--', '/entrypoint-celery-worker.sh']
    environment:
      DD_DATABASE_URL: ${DD_DATABASE_URL:-postgresql://defectdojo:defectdojo@postgres:5432/defectdojo}
      DD_CELERY_BROKER_URL: ${DD_CELERY_BROKER_URL:-redis://redis:6379/0}
      DD_SECRET_KEY: "${DD_SECRET_KEY:-hhZCp@D28z!n@NED*yB!ROMt+WzsY*iq}"
      DD_CREDENTIAL_AES_256_KEY: "${DD_CREDENTIAL_AES_256_KEY:-&91a*agLqesc*0DJ+2*bAbsUZfR*4nLw}"
      DD_DATABASE_READINESS_TIMEOUT: "${DD_DATABASE_READINESS_TIMEOUT:-30}"
    volumes:
        - type: bind
          source: ./docker/extra_settings
          target: /app/docker/extra_settings
        - "defectdojo_media:${DD_MEDIA_ROOT:-/app/media}"
  initializer:
    image: "defectdojo/defectdojo-django:${DJANGO_VERSION:-latest}"
    depends_on:
      - postgres
    entrypoint: ['/wait-for-it.sh', '${DD_DATABASE_HOST:-postgres}:${DD_DATABASE_PORT:-5432}', '--', '/entrypoint-initializer.sh']
    environment:
      DD_DATABASE_URL: ${DD_DATABASE_URL:-postgresql://defectdojo:defectdojo@postgres:5432/defectdojo}
      DD_ADMIN_USER: "${DD_ADMIN_USER:-admin}"
      DD_ADMIN_MAIL: "${DD_ADMIN_USER:-admin@defectdojo.local}"
      DD_ADMIN_FIRST_NAME: "${DD_ADMIN_FIRST_NAME:-Admin}"
      DD_ADMIN_LAST_NAME: "${DD_ADMIN_LAST_NAME:-User}"
      DD_INITIALIZE: "${DD_INITIALIZE:-true}"
      DD_SECRET_KEY: "${DD_SECRET_KEY:-hhZCp@D28z!n@NED*yB!ROMt+WzsY*iq}"
      DD_CREDENTIAL_AES_256_KEY: "${DD_CREDENTIAL_AES_256_KEY:-&91a*agLqesc*0DJ+2*bAbsUZfR*4nLw}"
      DD_DATABASE_READINESS_TIMEOUT: "${DD_DATABASE_READINESS_TIMEOUT:-30}"
    volumes:
        - type: bind
          source: ./docker/extra_settings
          target: /app/docker/extra_settings
  postgres:
    image: postgres:17.0-alpine@sha256:14195b0729fce792f47ae3c3704d6fd04305826d57af3b01d5b4d004667df174
    environment:
      POSTGRES_DB: ${DD_DATABASE_NAME:-defectdojo}
      POSTGRES_USER: ${DD_DATABASE_USER:-defectdojo}
      POSTGRES_PASSWORD: ${DD_DATABASE_PASSWORD:-defectdojo}
    volumes:
      - defectdojo_postgres:/var/lib/postgresql/data
  redis:
    image: redis:7.2.5-alpine@sha256:6aaf3f5e6bc8a592fbfe2cccf19eb36d27c39d12dab4f4b01556b7449e7b1f44
    volumes:
      - defectdojo_redis:/data
volumes:
  defectdojo_postgres: {}
  defectdojo_media: {}
  defectdojo_redis: {}
By default, DefectDojo serves HTTP traffic on port 8080. The configuration above disables HTTP and enables HTTPS, exposing the application to port 443. The options are explained below.
USE_TLS: Set totrueto enable TLS/SSL, ensuring encrypted communication within the DefectDojo application.GENERATE_TLS_CERTIFICATE: Set totrueto automatically generate TLS/SSL certificates.published: Configured as443to expose this port outside of the container, making it accessible to external endpoints.DD_SESSION_COOKIE_SECURE: Set totrueto enforce that session cookies are transmitted only over secure HTTPS connections.DD_CSRF_COOKIE_SECURE: Set totrueto make sure the CSRF (Cross-Site Request Forgery) cookies are transmitted only over secure HTTPS connections.
3. Run the commands below to build the DefectDojo Docker images and start the containers:
# ./dc-build.sh
# ./dc-up-d.sh
Note: Wait for about 10 minutes for the containers to come up before proceeding. To check that the containers are up, run the following command: docker ps. |
DefectDojo dashboard
Perform the following steps after successfully deploying the DefectDojo containers.
1. Login to the DefectDojo dashboard on your browser using the admin:<ADMIN_PASSWORD> credential:
https://<DEFECTDOJO_HOST_IP_ADDRESS>
Note: To obtain the ADMIN_PASSWORD, run the following command: |
# docker-compose logs initializer | grep "Admin password:"
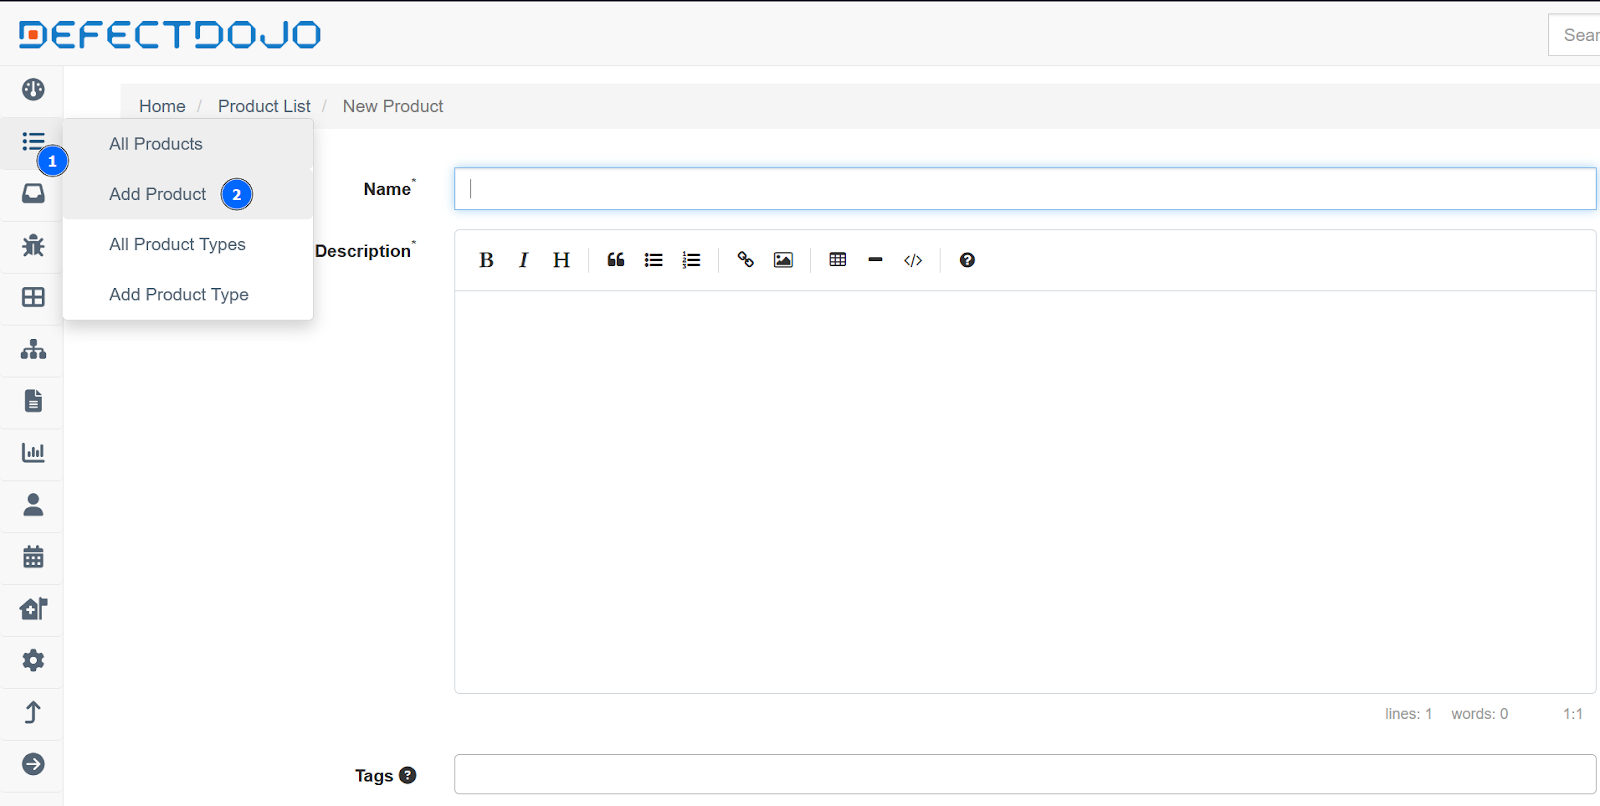
2. Select Add Product and enter PyGoat in the Name field to create a new product. A product represents the project, or application you are testing. Defining this product helps organize your security findings within each application.

3. Select Add New CI/CD Engagement under the newly added product. This engagement links your CI/CD pipeline or session to the product, creating a clear pathway for managing results.
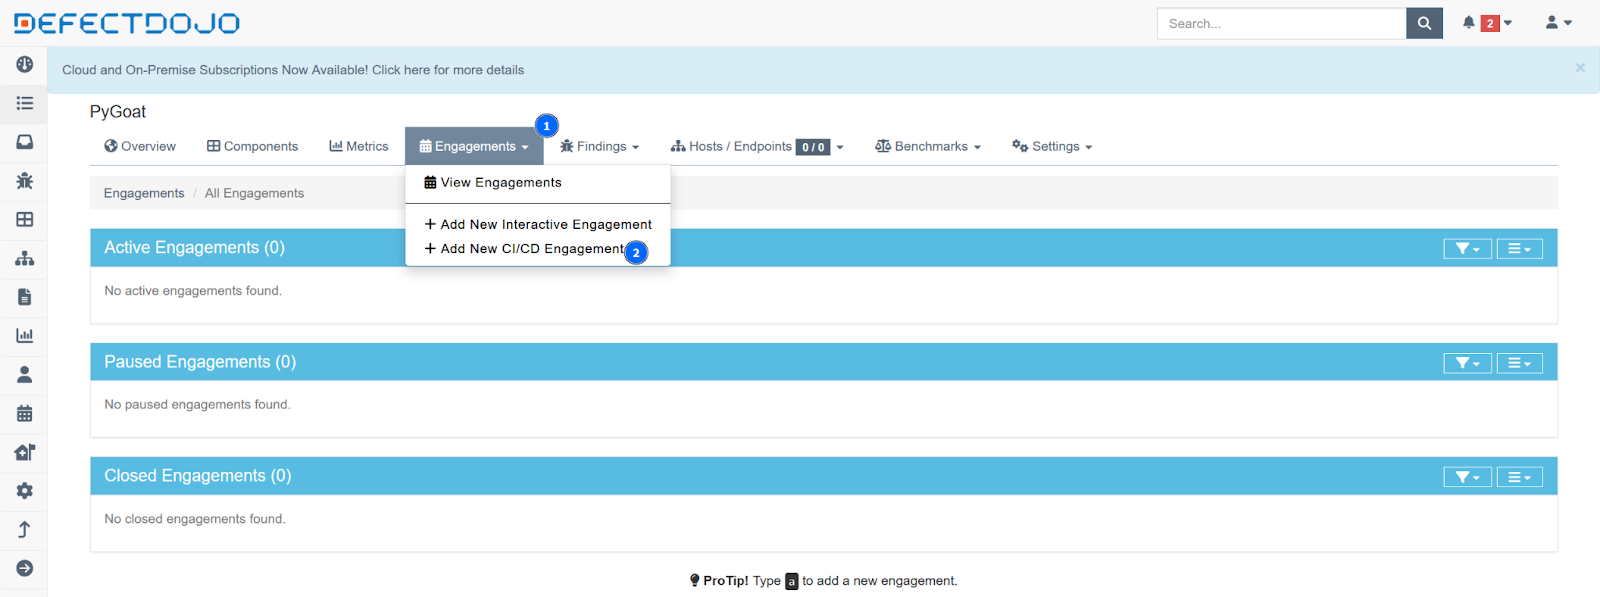
Set your engagement name as beta. With this engagement defined, you can configure your CI/CD pipeline to scan your application and push the results to DefectDojo.
| Note: Repeat steps 2 and 3 to create the DVWA product and its engagement. |
4. Click the user icon on the top right and select the API v2 Key to obtain the API key for the logged user.

GitLab
The GitLab CI/CD platform is used to automate tasks like building, testing, and deploying applications. It integrates security tools for static and dynamic security analysis, dependency scanning, and secret management, ensuring vulnerabilities are detected early in DevSecOps pipelines.
This section demonstrates how to use PyGoat and DVWA, two intentionally vulnerable applications in a DevSecOps pipeline within GitLab CI/CD. These applications act as practical targets, simulating real-world vulnerabilities to test and evaluate the effectiveness of integrated security scans.
Follow the steps below to create the CI/CD pipeline:
1. Log in to GitLab and click + Create new > New group > Create group on the upper left pane of the GitLab dashboard to create a new group.

Fill in the Group name (for example, Wazuh for DevSecOps) and click Create group.
2. Click New project > Create blank project and enter PyGoat in the Project name form. Disable the option Initialize repository with a README then click Create project. Repeat this step to create a new project for DVWA.
3. Click Settings > CICD > Variables on the left pane of the GitLab group created. Set your GitLab CI/CD variables as shown in the image below:
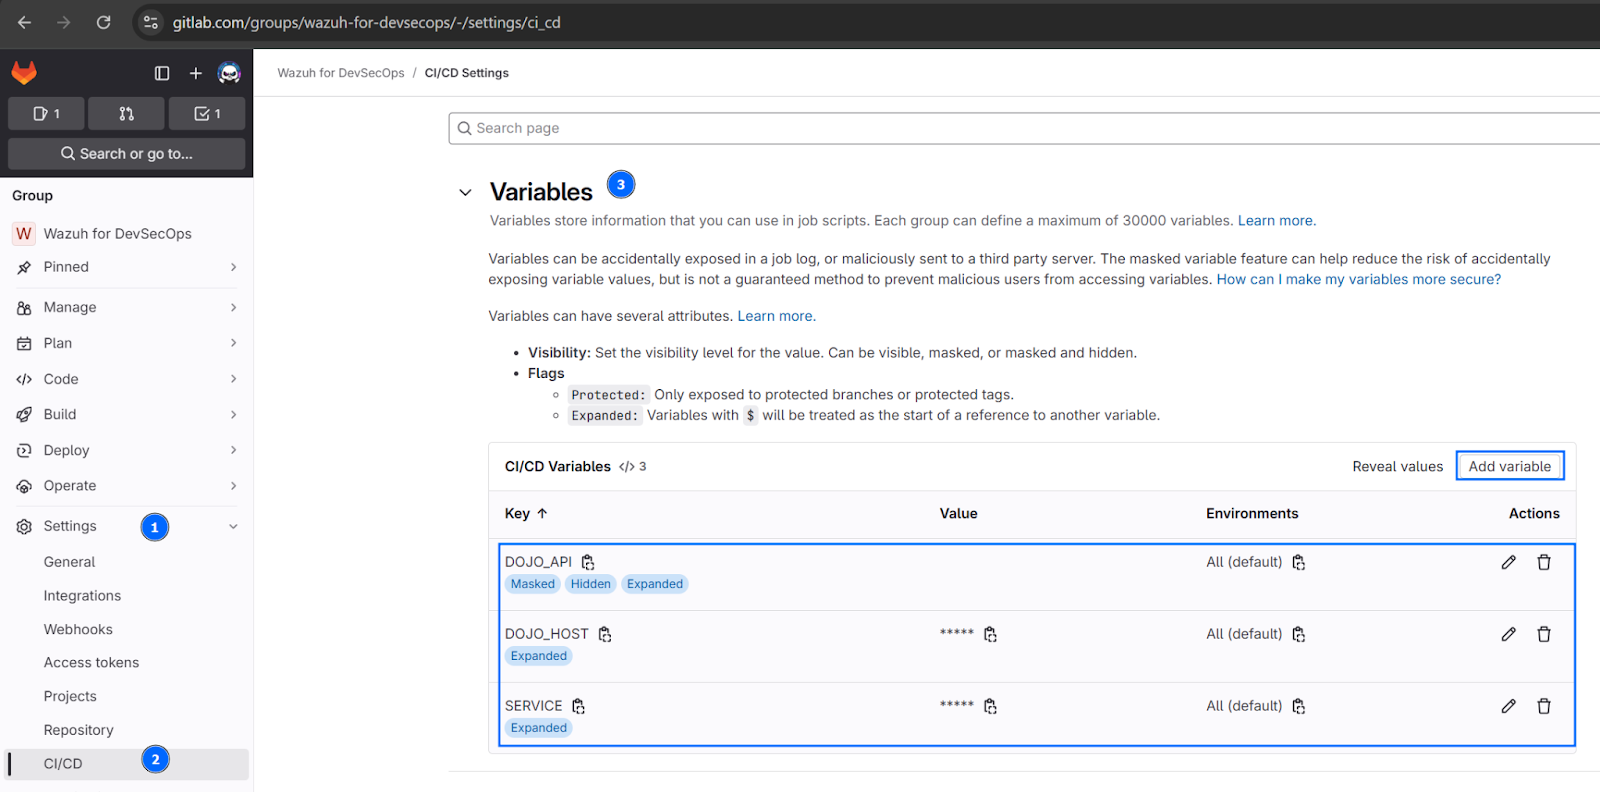
GitLab CI/CD variables allow you to securely manage environment-specific values and configuration details in a centralized way.
DOJO_API: The value of your DefectDojo API key saved in the obtain API key step.DOJO_HOST: The URL of the DefectDojo instance, formatted ashttps://<DEFECTDOJO_HOST IP_ADDRESS>.SERVICE: This field’s value will be used in Wazuh to trigger alerts (current value:wazuh_devsecops).
4. Click Build > Runners > New group runner on the left pane of the GitLab group created. Fill in the Tags form as wazuh, then click Create runner to create a group runner for your projects.
5. Follow the steps provided on the next page. Enter the commands on your Ubuntu endpoint. You will be prompted to enter the following information:
| Information required | Value |
| GitLab instance URL | https://gitlab.com |
| name for the runner | wazuh (can be customized) |
| executor | docker |
| default Docker image | python |
# gitlab-runner register  --url https://gitlab.com  --token my-gitlab-runner-token
Runtime platform                                	arch=amd64 os=linux pid=28134 revision=374d34fd version=17.6.0
Running in system-mode.
Enter the GitLab instance URL (for example, https://gitlab.com/):
[https://gitlab.com]:
Verifying runner... is valid                    	runner=t3_7***
Enter a name for the runner. This is stored only in the local config.toml file:
[ubuntu]: wazuh
Enter an executor: parallels, virtualbox, docker, docker+machine, docker-autoscaler, instance, custom, shell, kubernetes, ssh, docker-windows:
docker
Enter the default Docker image (for example, ruby:2.7):
python
Runner registered successfully. Feel free to start it, but if it's running already the config should be automatically reloaded!

Configuration (with the authentication token) was saved in "/etc/gitlab-runner/config.toml"
6. Restart the gitlab-runner service and confirm the new runner’s status by executing the following commands:
# systemctl restart gitlab-runner
# gitlab-runner verify
7. Clone the PyGoat and DVWA repositories provided here into the respective PyGoat and DVWA projects created earlier. This contains the source code of the vulnerable applications and the CI/CD pipeline script (.gitlab-ci.yml file).
Before proceeding, ensure you have configured your SSH keys to enable secure communication with your GitLab projects. Follow the instructions in this guide to set up your SSH keys.
- To clone PyGoat:
# git clone https://gitlab.com/wazuh-for-devsecops/pygoat.git
# cd pygoat
# git remote rename origin old-origin
# git remote add origin git@gitlab.com:<YOUR_GITLAB_GROUP>/pygoat.git
# git push --set-upstream origin main
- To clone DVWA:
# git clone https://gitlab.com/wazuh-for-devsecops/dvwa.git
# cd dvwa
# git remote rename origin old-origin
# git remote add origin git@gitlab.com:<YOUR_GITLAB_GROUP>/dvwa.git
# git push --set-upstream origin main
Note: To integrate the security scanning for a different application, copy the .gitlab-ci.yml file into your application repository. Make sure to set the values of the variables PRODUCT_NAME and ENGAGEMENT_NAME in the .gitlab-ci.yml file to those created in DefectDojo. |

8. After cloning the respective repositories containing the .gitlab-ci.yml file into your projects, the CI/CD pipeline will be triggered automatically.
| Note: You can verify the status of the triggered CI/CD pipeline by clicking Build > Pipelines on the left pane of each project. |
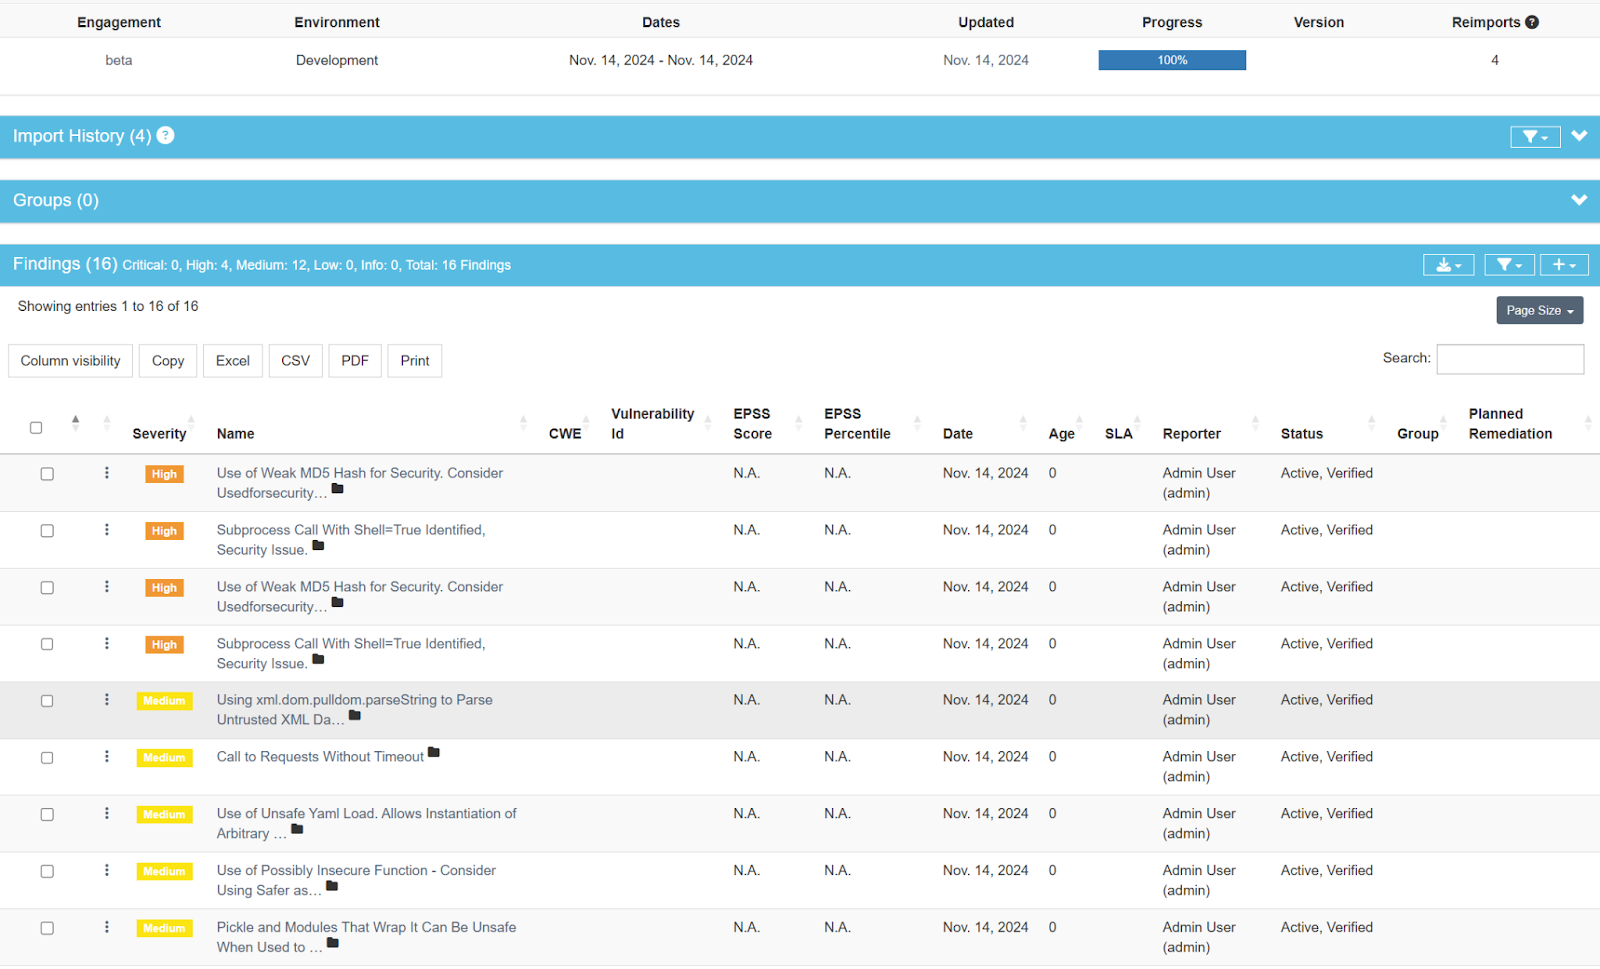
Click Findings > All Findings on the left pane of DefectDojo user interface to visualize the security findings added after running the CI/CD pipeline.
Wazuh agent
Follow these steps to configure the Wazuh agent to collect detected vulnerabilities from DefectDojo:
1. Create a script file /var/ossec/bin/defectdojo-integration with the following content to get security findings from DefectDojo:
import requests
import json
import os
import urllib3

urllib3.disable_warnings(urllib3.exceptions.InsecureRequestWarning)

# Replace these with your actual values
base_url = "https://<IP_ADDRESS>/api/v2"
products_url = f"{base_url}/products/"
findings_url = f"{base_url}/findings/"
api_key = "<API_KEY>"
headers = {"accept": "application/json", "Authorization": f"Token {api_key}"}

# This parameter sets the maximum number of findings you can fetch per request
params = {"active": "true", "limit": "1000"}

output_file = "/var/log/defectdojo.json"

def fetch_products():
    """
    Fetch products data and extract findings_list and name.
    """
    try:
        response = requests.get(products_url, headers=headers, verify=False)
        response.raise_for_status()
        json_data = response.json()
        # Extract findings_list and name for each product
        return [
            {
            "findings_list": product.get("findings_list", []),
            "name": product.get("name")
            }
            for product in json_data.get("results", [])
        ]
    except requests.exceptions.RequestException as e:
        print("Error fetching products:", e)
        return []

def fetch_findings():
    """
    Fetch findings data and extract only the required fields.
    """
    required_fields = [
    "id", "display_status", "title", "date", "cwe",
    "cvssv3_score", "url", "severity", "description",
    "impact", "references", "numerical_severity",
    "hash_code", "line", "file_path", "service"
    ]
    try:
        response = requests.get(findings_url, headers=headers, params=params, verify=False)
        response.raise_for_status()
        json_data = response.json()

        # Extract only the required fields from each finding
        return [
            {field: finding.get(field) for field in required_fields}
            for finding in json_data.get("results", [])
        ]
    except requests.exceptions.RequestException as e:
        print("Error fetching findings:", e)
        return []

def load_existing_data(file_path):
    """
    Load existing data from the file to avoid duplicates.
    """
    if not os.path.exists(file_path):
        return []

    with open(file_path, "r") as file:
        return [json.loads(line) for line in file]

def integrate_data(findings, products, existing_data):
    """
    Integrate findings with product data and avoid duplicates.
    """
    existing_ids = {entry["id"] for entry in existing_data}
    new_entries = []

    for finding in findings:
        if finding["id"] not in existing_ids:
            matched_name = None

            # Check if the finding id matches any findings_list in products
            for product in products:
                if finding["id"] in product["findings_list"]:
                    matched_name = product["name"]
                    break
            # Add the matched name to the finding
            finding_with_product = finding.copy()
            finding_with_product["product_name"] = matched_name
            new_entries.append(finding_with_product)

    return new_entries

def save_new_data(file_path, existing_data, new_entries):
    """
    Save new data to the file only if there are new entries
    """
    if not new_entries:
        print("No new findings to add. Files remains unchanged.")
        return

    updated_data = existing_data + new_entries
    with open(file_path, "w") as file:
        for entry in updated_data:
            file.write(json.dumps(entry) + "\n")
    print(f"{len(new_entries)} new findings added to {file_path}")

# Main Execution
try:
    # Fetch data
    products = fetch_products()
    findings = fetch_findings()

    # Load existing data
    existing_data = load_existing_data(output_file)

    # Integrate findings with products
    new_entries = integrate_data(findings, products, existing_data)

    # Save integrated data to the file
    save_new_data(output_file, existing_data, new_entries)

except Exception as e:
    print("An error occurred during processing:", e)
Where:
base_urlis the value of the DefectDojo API endpoint. Replace<IP_ADDRESS>with your DefectDojo IP address.api_keyis the value of your DefectDojo API key. Replace<API_KEY>with the API key saved in the obtain API key step.
2. Set the ownership and permission of the /var/ossec/bin/defectdojo-integration file to give the root user and the wazuh group access:
# chmod 750 /var/ossec/bin/defectdojo-integration
# chown root:wazuh /var/ossec/bin/defectdojo-integration
3. Create a defectdojo.json log file with the following command:
# touch /var/log/defectdojo.json
4. Append the following configuration to the /var/ossec/etc/ossec.conf file to forward all security findings collected from DefectDojo to the Wazuh server:
<ossec_config>
  <localfile>
    <location>/var/log/defectdojo.json</location>
    <log_format>json</log_format>
    <label key="@source">DefectDojo</label>
  </localfile>
</ossec_config>
5. Install Python3 and the requests module with the following commands. Skip this step if they are already installed.
# apt update
# apt install python3 python3-pip
# pip3 install requests
6. Set up a cron job to schedule the script to run at defined intervals, ensuring automated and timely execution. Enter the command sudo crontab -e to edit the crontab file for the root user. Insert the configuration below to make sure your script executes every 10 minutes:
*/10 * * * * /usr/bin/python3 /var/ossec/bin/defectdojo-integration
7. Verify the cron job logs using the command:
# journalctl -f _COMM=cron
8. Restart the Wazuh agent service to apply the configuration changes:
# systemctl restart wazuh-agent
Wazuh server
Follow these steps on the Wazuh server to configure rules that trigger alerts for the security findings. These findings must have the SERVICE field defined as wazuh_devsecops in the GitLab variables configuration step.
1. Add the following custom rules to the /var/ossec/etc/rules/defectdojo_rules.xml rule file:
<group name="defectdojo,">
  <rule id="100009" level="0">
    <decoded_as>json</decoded_as>
    <field name="service">wazuh_devsecops</field>
    <description>DefectDojo results.</description>
    <options>no_full_log</options>
  </rule>

  <rule id="100010" level="5">
    <if_sid>100009</if_sid>
    <field name="severity">Low</field>
    <description>DefectDojo: - $(title)</description>
    <options>no_full_log</options>
  </rule>

  <rule id="100011" level="7">
    <if_sid>100009</if_sid>
    <field name="severity">Medium</field>
    <description>DefectDojo: - $(title)</description>
    <options>no_full_log</options>
  </rule>

  <rule id="100012" level="12">
    <if_sid>100009</if_sid>
    <field name="severity">High</field>
    <description>DefectDojo: - $(title)</description>
    <options>no_full_log</options>
  </rule>

  <rule id="100013" level="14">
    <if_sid>100009</if_sid>
    <field name="severity">Critical</field>
    <description>DefectDojo: - $(title)</description>
    <options>no_full_log</options>
  </rule>
</group>
2. Restart the Wazuh manager to apply the configuration changes:
# systemctl restart wazuh-manager
Creating DevSecOps visualizations with Wazuh
In modern DevSecOps practices, visualizing data is necessary for translating complex security, development, and operational metrics into actionable insights. Wazuh dashboards provide a suite of visualization tools to streamline this process. By using visual elements such as charts, graphs, maps, and more, you can better understand high-volume data, identify trends, and support data-driven decision-making.
Visualizing the alerts
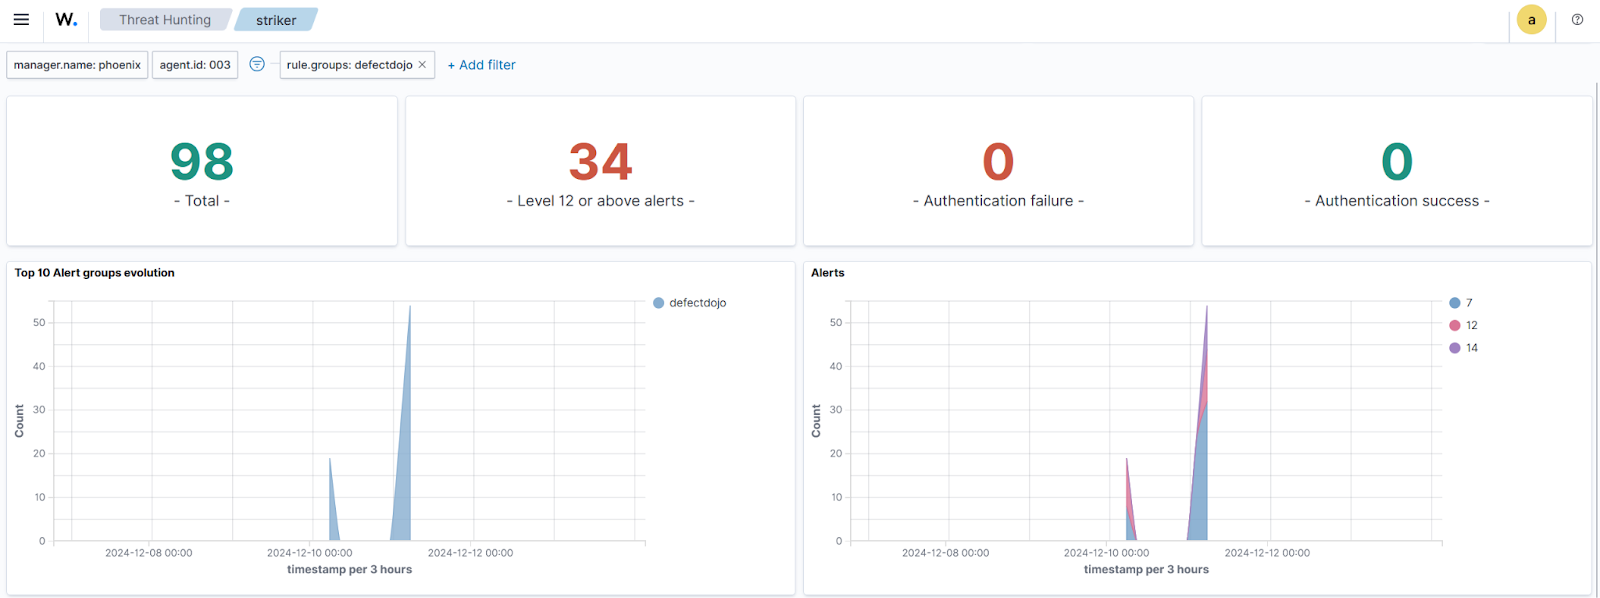
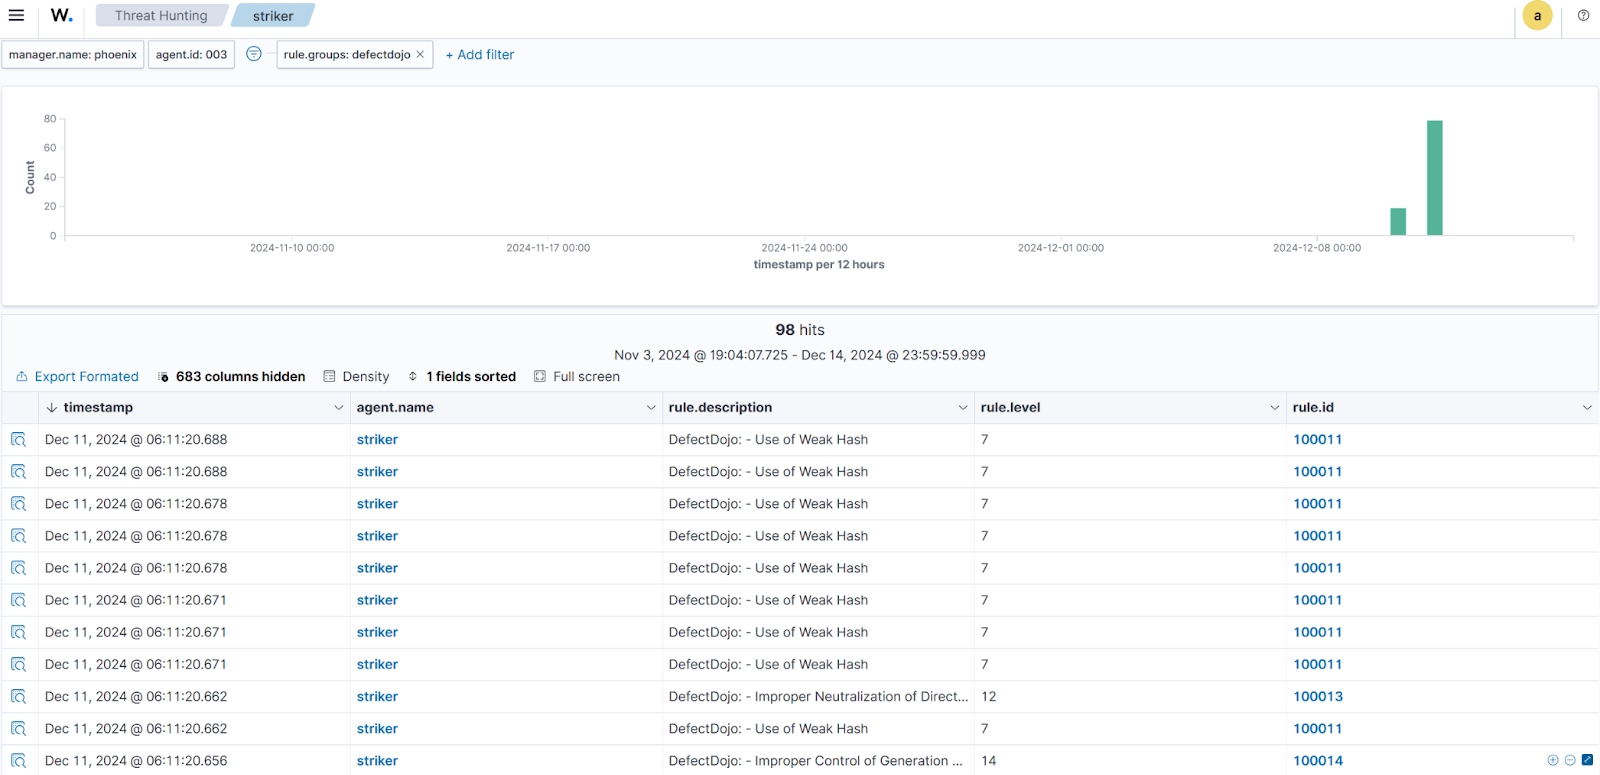
The alerts below are generated on the Wazuh dashboard when the security scan findings are sent to the Wazuh server. Perform the following steps to view the alerts on the Wazuh dashboard.
1. Navigate to Threat intelligence > Threat Hunting.
2. Click + Add filter. Filter for rule.groups in the Field field.
3. Filter for is in the Operator field.
4. Filter for defectdojo in the Value field.
5. Click Save to enable the filter.
Creating custom visualizations
On the Wazuh dashboard, click the upper-left menu icon ☰ and navigate to Explore > Dashboards > Create new Dashboard.
Findings visualization
a. Click Create new, select the Data Table visualization on the New Visualization tab, and use wazuh-alerts-* as the source.
b. Select Split rows in the Buckets section of the Data window, and set the following values:
Aggregation=TermsField=data.titleCustom label=Findings
c. Add a SUB-BUCKET with Split rows:
Sub aggregation=TermsField=data.cweCustom label=CWE Id
d. Add a SUB-BUCKET with the Split rows:
Sub aggregation=TermsField=data.severityCustom label=Severity
e. Add a SUB-BUCKET with Split table:
RowsSub aggregation=TermsField=data.product_nameCustom label=Product
f. Click Update.
g. Click Save in the upper right pane and assign a title to the visualization (for example, Findings table). Then click Save and return.
Total findings visualization
a. Click Create new, select the Metric visualization on the New Visualization tab, and use wazuh-alerts-* as the source.
b. Set the following values in the Metrics section of the Data window:
Aggregation=CountCustom label=Findings
c. Add a Split group in Buckets and set the following values:
Aggregation=TermsField=data.product_name
d. Click Update.
e. Click Save in the upper right pane and assign a title to the visualization (for example, Findings count). Then click Save and return.
Top findings visualization
a. Click Create new, select the Horizontal bar visualization on the New Visualization tab, and use wazuh-alerts-* as the source.
b. Add a Y-axis in the Metrics section of the Data window, and set the following values:
Aggregation=CountCustom label=Findings frequency
c. Add an X-axis in Buckets and set the following values:
Aggregation=TermsField=data.titleCustom label=Findings
d. Add a SUB-BUCKET with Split chart:
RowsSub aggregation=TermsField=data.product_nameCustom label=Product
e. Click Show values on chart in the Settings section of the Panel settings window.
f. Click Update.
g. Click Save in the upper right pane and assign a title to the visualization (for example, Top vulnerabilities). Then click Save and return.
Findings over time visualization
a. Click Create new, select the Vertical Bar visualization on the New Visualization tab, and use wazuh-alerts-* as the source.
b. Add an X-axis in the Buckets section of the Data window, and set the following values:
Aggregation=Date HistogramField=timestamp
c. Add a SUB-BUCKET with Split series:
Sub aggregation=TermsField=data.product_name
d. Click Update.
e. Click Save in the upper right pane and assign a title to the visualization (for example, Findings per day). Then click Save and return.
Severity pie visualization
a. Click Create new, select the Pie visualization on the New Visualization tab, and use wazuh-alerts-* as the source.
b. Select Split chart in the Buckets section of the Data window, and set the following values:
- Columns
Aggregation=TermsField=data.product_nameCustom label=Product
c. Add a SUB-BUCKET with Split slices:
Sub aggregation=TermsField=data.severityCustom label=Severity
d. Click Show labels in the Labels settings section of the Options window.
e. Click Update.
f. Click Save in the upper right pane and assign a title to the visualization (for example, Severity trends). Then click Save and return.
Severity bar visualization
a. Click Create new, select the Vertical Bar visualization on the New Visualization tab, and use wazuh-alerts-* as the source.
b. Add a Y-axis in the Metrics section of the Data window, and set the following values:
Aggregation=CountCustom label=Severity
c. Add an X-axis in Buckets and set the following values:
Aggregation=TermsField=data.severityCustom label=Severity
d. Add a SUB-BUCKET with Split chart:
RowsSub aggregation=TermsField=data.product_nameCustom label=Product
e. Click Show values on chart in the Settings of the Panel settings window.
f. Click Update.
g. Click Save in the upper right pane and assign a title to the visualization (for example, Severity distribution). Then click Save and return.
Common Weakness Enumeration (CWE) visualization
a. Click Create new, select the Vertical Bar visualization on the New Visualization tab, and use wazuh-alerts-* as the source.
b. Add an X-axis in the Buckets section of the Data window, and set the following values:
Aggregation=TermsField=data.cweCustom label=CWE Id
c. Add a SUB-BUCKET with Split series:
Sub aggregation=TermsField=data.product_nameCustom label=Product
d. Click Update.
e. Click Save in the upper right pane and assign a title to the visualization (for example, CWE distribution). Then click Save and return.
Click Save in the upper right pane of the Dashboards menu, and assign a title to the dashboard (for example, Security findings).
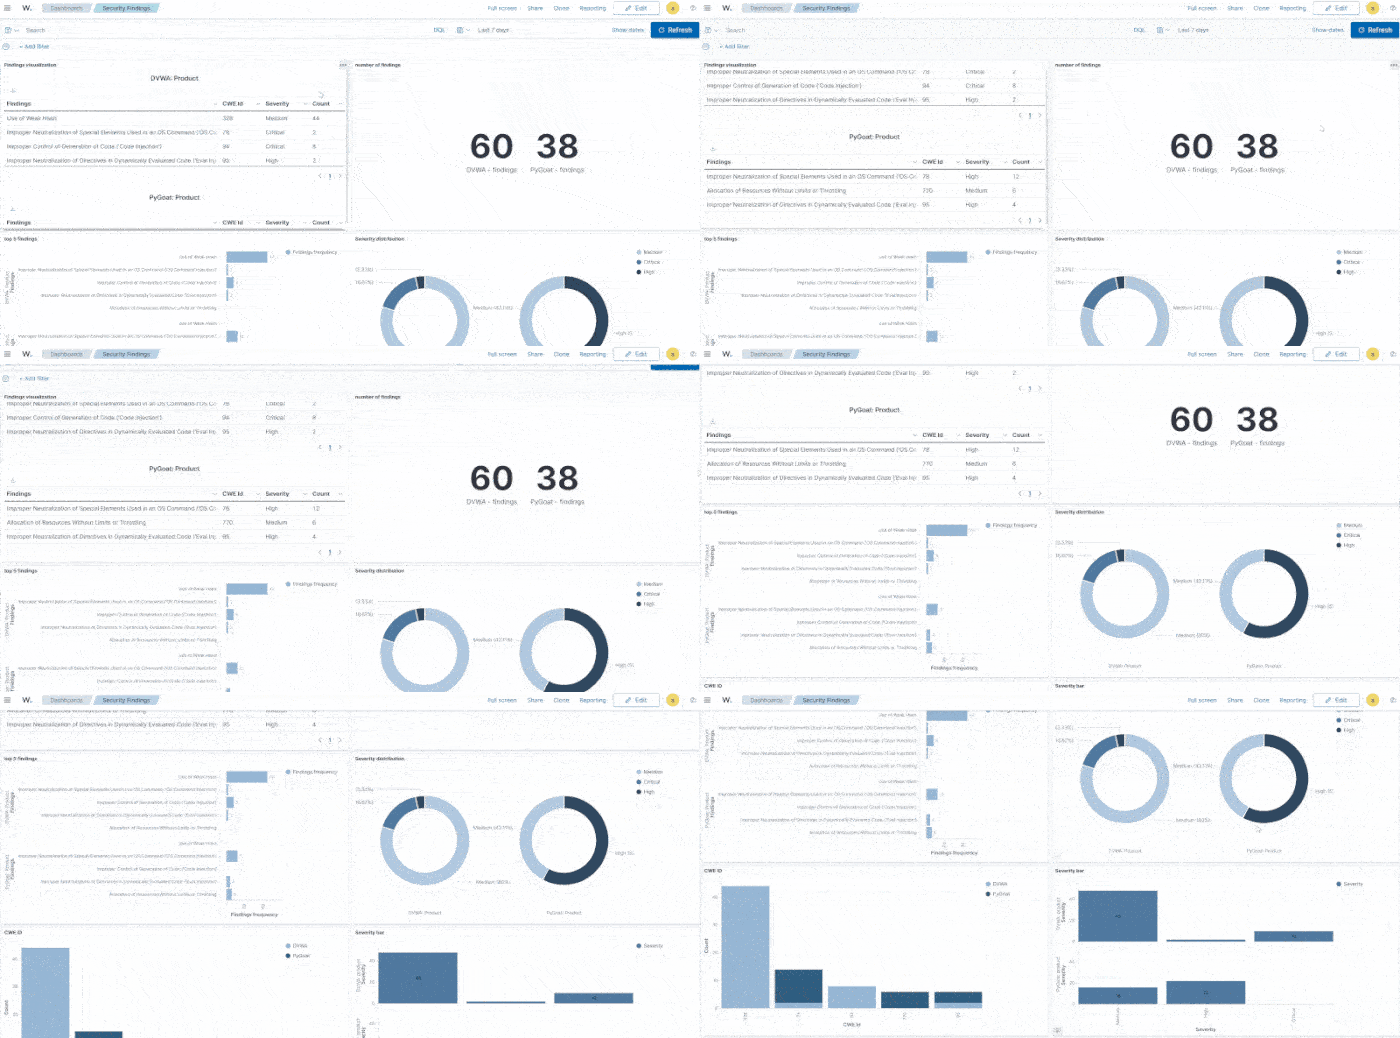
The GIF below illustrates visualizations on the dashboard, including top vulnerable applications, CWE trends, severity trends, severity distribution, a findings table, and a findings count summary.
Conclusion
This blog post demonstrates how a DevSecOps pipeline can integrate security events into Wazuh. Integrated with DefectDojo, Wazuh generates visualizations like severity distributions, CWE trends, and detailed tables of findings, streamlining defect tracking and analysis. These insights help teams to detect, prioritize, and address defects early, improving response times and overall security.
