Measuring performance and operational efficiency of your XDR/SIEM ensures that it runs reliably, scales effectively, and delivers timely security insights. Monitoring metrics like resource usage, connection times, and log processing helps identify bottlenecks, optimize configurations, and prevent downtime. It also ensures that threat detection and intelligence coverage remain consistent, even under high workloads.
The Wazuh SIEM/XDR is a cybersecurity platform that collects, correlates, and analyzes security data across networks, endpoints, and applications to detect, investigate, and respond to threats in real-time. It is a unified platform that comprises three central components, which include the Wazuh server, the Wazuh indexer, and the Wazuh dashboard. Additionally, it has a universal agent that monitors and collects logs from Windows, UNIX, macOS, Solaris, AIX, or HP-UX endpoints.
Wazuh is designed and built to operate efficiently, optimize system resource usage, minimize false positives, and process log data in real-time. We use the following metrics to measure the performance and operational efficiency of the Wazuh SIEM/XDR platform:
- Wazuh agent connection time
- CPU & memory usage
- Indexing latency
- Log rotation and compression
- CTI coverage
Infrastructure
We used the following infrastructure for measuring the metrics mentioned above:
- Wazuh 4.12.0 central components (Wazuh server, Wazuh indexer, Wazuh dashboard) installed using the Quickstart guide on an Ubuntu 24.04 server with the following hardware:
- CPU: 5 cores (Intel i7‑10750H at 2.60 GHz)
- RAM: 20 GB total
- Storage: 79 GB total
- 40 Ubuntu 24.04 container endpoints with a Wazuh agent installed and enrolled to the Wazuh server. The hardware below is for the Docker host used in this blog post and each container copies this same specification.
- CPU: 10 cores (Apple Silicon, 64‑bit)
- RAM: 7.7 GB
- Storage: 1007 GB
Measuring Wazuh efficiency
Wazuh agent connection time
This metric measures the time it takes for a Wazuh agent to connect with the Wazuh server for the first time registration and after a disconnection. This metric is useful when onboarding Wazuh agents at scale, especially during automated deployments or disaster recovery scenarios.
Wazuh agent enrollment time
The Wazuh agent registration time refers to how long it takes for new endpoints to connect, authenticate, and be enrolled by the Wazuh manager.
After installing our Wazuh agent, we ran the command below on one of our Ubuntu endpoints to test the Wazuh agent enrollment time. This command starts the Wazuh agent service in the foreground, and lets us know how much time it takes for the Wazuh agent to be enrolled with a Wazuh server:
# /var/ossec/bin/wazuh-agentd -f
2025/07/29 11:33:01 wazuh-agentd: INFO: (1410): Reading authentication keys file.
2025/07/29 11:33:01 wazuh-agentd: INFO: Using notify time: 10 and max time to reconnect: 60
2025/07/29 11:33:01 wazuh-agentd: INFO: Version detected -> Linux |Ubuntu24 |6.14.0-24-generic |#24~24.04.3-Ubuntu SMP PREEMPT_DYNAMIC Mon Jul  7 16:39:17 UTC 2 |x86_64 [Ubuntu|ubuntu: 24.04.2 LTS (Noble Numbat)] - Wazuh v4.13.0
2025/07/29 11:33:01 wazuh-agentd: INFO: Started (pid: 9292).
2025/07/29 11:33:01 wazuh-agentd: INFO: Unable to connect to the active response queue (disabled).
2025/07/29 11:33:01 wazuh-agentd: INFO: Requesting a key from server: 10.0.2.15
2025/07/29 11:33:01 wazuh-agentd: INFO: No authentication password provided
2025/07/29 11:33:01 wazuh-agentd: INFO: Using agent name as: Ubuntu24
2025/07/29 11:33:01 wazuh-agentd: INFO: Waiting for server reply
2025/07/29 11:33:01 wazuh-agentd: INFO: Valid key received
2025/07/29 11:33:01 wazuh-agentd: INFO: Waiting 20 seconds before server connection
2025/07/29 11:33:21 wazuh-agentd: INFO: (1410): Reading authentication keys file.
2025/07/29 11:33:21 wazuh-agentd: INFO: Using AES as encryption method.
2025/07/29 11:33:21 wazuh-agentd: INFO: Trying to connect to server ([10.0.2.15]:1514/tcp).
2025/07/29 11:33:21 wazuh-agentd: INFO: (4102): Connected to the server ([10.0.2.15]:1514/tcp).
The timestamp from the above output shows that it takes 20 seconds for Wazuh agent enrollment with the Wazuh manager to complete.
Wazuh agent reconnection time
The Wazuh agent establishes a persistent TCP connection to the Wazuh manager. Once the handshake and authentication are completed, the connection remains open, enabling continuous, low-latency communication for event forwarding, log collection, and remote commands. Connection resets or reconnections are rare, typically occurring only when the agent is restarted, its configuration is changed, or in the event of network interruptions.
For this use case, we stopped the Wazuh agent service using the command below:
# /var/ossec/bin/wazuh-control stop
Then, we ran the following command to start the Wazuh agent service in the foreground:
# /var/ossec/bin/wazuh-agentd -f
2025/07/29 11:37:52 wazuh-agentd: INFO: (1410): Reading authentication keys file.
2025/07/29 11:37:52 wazuh-agentd: INFO: Using notify time: 10 and max time to reconnect: 60
2025/07/29 11:37:52 wazuh-agentd: INFO: Version detected -> Linux |Ubuntu24 |6.14.0-24-generic |#24~24.04.3-Ubuntu SMP PREEMPT_DYNAMIC Mon Jul  7 16:39:17 UTC 2 |x86_64 [Ubuntu|ubuntu: 24.04.2 LTS (Noble Numbat)] - Wazuh v4.13.0
2025/07/29 11:37:52 wazuh-agentd: INFO: Started (pid: 9313).
2025/07/29 11:37:52 wazuh-agentd: INFO: Unable to connect to the active response queue (disabled).
2025/07/29 11:37:52 wazuh-agentd: INFO: Using AES as encryption method.
2025/07/29 11:37:52 wazuh-agentd: INFO: Trying to connect to server ([10.0.2.15]:1514/tcp).
2025/07/29 11:37:52 wazuh-agentd: INFO: (4102): Connected to the server ([10.0.2.15]:1514/tcp).
The timestamp from the above output shows it takes less than 1 second for the Wazuh agent to reconnect with the Wazuh server.
CPU and memory usage
Central components like the Wazuh manager, Wazuh indexer, and Wazuh dashboard services utilize resources, especially during high event traffic periods. In the example below, we monitor the CPU and memory usage for the Wazuh central components within a 5-minute 20-second time frame, during which 54547 events were received.
You can find the number of events ingested by the Wazuh manager using the Wazuh daemon stats API query.
In the image below, we ran the GET /manager/daemons/stats query in the Wazuh Server management > Dev Tools tab of the Wazuh dashboard to get the event’s metrics for our Wazuh server.
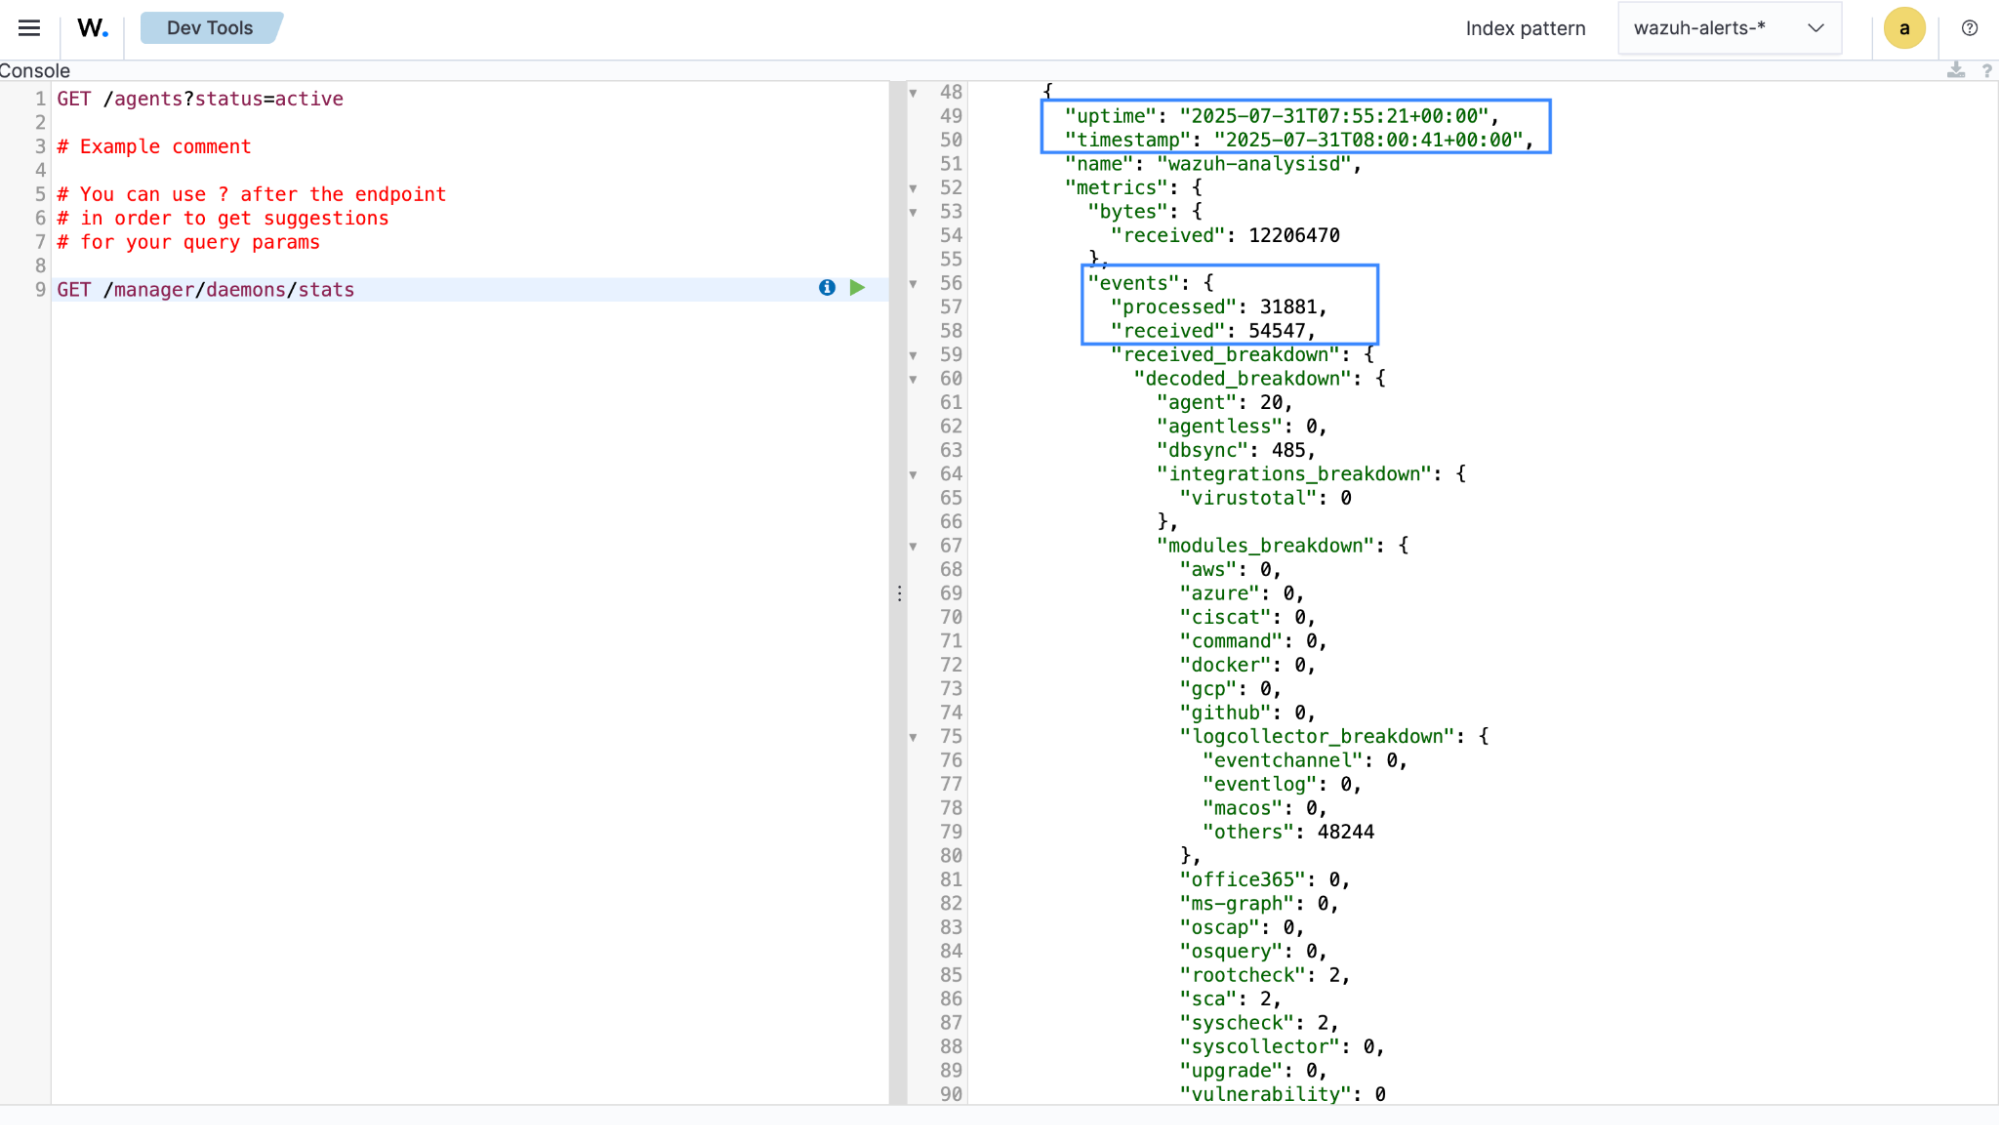
The output shows a total of 5 minutes, 20 seconds between "uptime": "2025-07-31T07:55:21+00:00" and "timestamp": "2025-07-31T08:00:41+00:00", which is equal to 320 seconds. It also shows a total of 54547 events received within that time range.
CPU usage
We calculate the CPU usage using the pidstat tool.
We ran the command below on the server where the Wazuh central components were installed to get the CPU usage. This command measures the average CPU of the Wazuh server, indexer, and dashboard processes over a 320-second period, then reports the results once:
# pidstat -p $(pgrep -d, -f "wazuh-|filebeat|java|node") 320 1
Linux 6.14.0-24-generic (Ubuntu24m)     07/31/2025      _x86_64_        (5 CPU)

11:55:31 AM   UID       PID    %usr %system  %guest   %wait    %CPU   CPU  Command
11:56:31 AM   124       776    8.73    6.35    0.00    9.62   15.08     3  node
11:56:31 AM   997      1238   46.81   23.16    0.00    0.00   69.97     2  java
11:56:31 AM   120      1391    0.00    0.00    0.00    0.00    0.00     4  fusermount3
11:56:31 AM  1000      3074    0.00    0.00    0.00    0.00    0.00     4  fusermount3
11:56:31 AM     0     12435    4.73    4.75    0.00    1.82    9.48     1  filebeat
11:56:31 AM   123     24966    0.52    0.23    0.00    0.72    0.75     4  wazuh-integrato
11:56:31 AM     0     24987    0.00    0.07    0.00    0.00    0.07     1  wazuh-authd
11:56:31 AM   123     25000    0.65    1.40    0.00    0.00    2.05     1  wazuh-db
11:56:31 AM     0     25015    0.00    0.00    0.00    0.10    0.00     2  wazuh-execd
11:56:31 AM   123     25051  157.96   87.34    0.00    0.10  245.29     4  wazuh-analysisd
11:56:31 AM     0     25063    0.00    0.03    0.00    0.18    0.03     3  wazuh-syscheckd
11:56:31 AM   123     25076    3.42   11.00    0.00    8.98   14.41     2  wazuh-remoted
11:56:31 AM     0     25110    0.55    0.00    0.00    0.08    0.55     2  wazuh-logcollec
11:56:31 AM   123     25130    0.02    0.00    0.00    0.13    0.02     4  wazuh-monitord
11:56:31 AM     0     25139    0.60    0.52    0.00    0.00    1.12     1  wazuh-modulesd

Average:      UID       PID    %usr %system  %guest   %wait    %CPU   CPU  Command
Average:      124       776    8.73    6.35    0.00    9.62   15.08     -  node
Average:      997      1238   46.81   23.16    0.00    0.00   69.97     -  java
Average:      120      1391    0.00    0.00    0.00    0.00    0.00     -  fusermount3
Average:     1000      3074    0.00    0.00    0.00    0.00    0.00     -  fusermount3
Average:        0     12435    4.73    4.75    0.00    1.82    9.48     -  filebeat
Average:      123     24966    0.52    0.23    0.00    0.72    0.75     -  wazuh-integrato
Average:        0     24987    0.00    0.07    0.00    0.00    0.07     -  wazuh-authd
Average:      123     25000    0.65    1.40    0.00    0.00    2.05     -  wazuh-db
Average:        0     25015    0.00    0.00    0.00    0.10    0.00     -  wazuh-execd
Average:      123     25051  157.96   87.34    0.00    0.10  245.29     -  wazuh-analysisd
Average:        0     25063    0.00    0.03    0.00    0.18    0.03     -  wazuh-syscheckd
Average:      123     25076    3.42   11.00    0.00    8.98   14.41     -  wazuh-remoted
Average:        0     25110    0.55    0.00    0.00    0.08    0.55     -  wazuh-logcollec
Average:      123     25130    0.02    0.00    0.00    0.13    0.02     -  wazuh-monitord
Average:        0     25139    0.60    0.52    0.00    0.00    1.12     -  wazuh-modulesd
In summary:
The table below shows the average CPU usage for the Wazuh central components within a 320-second time frame.
| Process | CPU usage (5 cores) |
| wazuh-analysisd | 2.45 |
| Java (Wazuh indexer) | 0.7 |
| Node (Wazuh dashboard) | 0.3 |
| wazuh-remoted | 0.14 |
| filebeat | 0.09 |
| wazuh-db | 0.04 |
| wazuh-integratord | 0.01 |
| wazuh-logcollector | 0.01 |
| wazuh-authd | 0.01 |
| wazuh-syscheckd | 0.0 |
| wazuh-monitord | 0.0 |
| wazuh-execd | 0.0 |
| Total | 3.75 |
The Wazuh central components utilized an average of 3.75 out of 5 cores within the 320-second time frame, where 54547 events were received.
Memory usage
We calculate the RAM usage using the pidstat tool.
We ran the command below on the server where the Wazuh central components were installed to get the memory usage. This command measures the average memory usage of the Wazuh server, indexer, and dashboard processes over a 320-second period, then reports the results once:
# pidstat -r -p $(pgrep -d, -f "wazuh-|filebeat|java|node") 320 1
11:55:31 AM   UID       PID  minflt/s  majflt/s     VSZ     RSS   %MEM  Command
11:56:31 AM   124       776    239.56      0.00 11571216  256332   1.23  node
11:56:31 AM   997      1238     22.18      0.00 5722672 1976856   9.51  java
11:56:31 AM   120      1391      0.00      0.00    2704    1872   0.01  fusermount3
11:56:31 AM  1000      3074      0.00      0.00    2704    1876   0.01  fusermount3
11:56:31 AM     0     12435      0.03      0.00 1653472   87304   0.42  filebeat
11:56:31 AM   123     24966      0.00      0.00   25964    4400   0.02  wazuh-integrato
11:56:31 AM     0     24987      0.00      0.00  181876    9104   0.04  wazuh-authd
11:56:31 AM   123     25000      0.00      0.00 1429416   74024   0.36  wazuh-db
11:56:31 AM     0     25015      0.00      0.00   26024    3844   0.02  wazuh-execd
11:56:31 AM   123     25051     21.16      0.00 3074092  154500   0.74  wazuh-analysisd
11:56:31 AM     0     25063      0.00      0.00  216304   13900   0.07  wazuh-syscheckd
11:56:31 AM   123     25076      0.00      0.00 1373536   16432   0.08  wazuh-remoted
11:56:31 AM     0     25110      0.15      0.00  815060   23464   0.11  wazuh-logcollec
11:56:31 AM   123     25130      0.00      0.00   25988    4364   0.02  wazuh-monitord
11:56:31 AM     0     25139      0.17      0.00 1129500   86520   0.42  wazuh-modulesd


Average:      UID       PID  minflt/s  majflt/s     VSZ     RSS   %MEM  Command
Average:      124       776    239.56      0.00 11571216  256332   1.23  node
Average:      997      1238     22.18      0.00 5722672 1976856   9.51  java
Average:      120      1391      0.00      0.00    2704    1872   0.01  fusermount3
Average:     1000      3074      0.00      0.00    2704    1876   0.01  fusermount3
Average:        0     12435      0.03      0.00 1653472   87304   0.42  filebeat
Average:      123     24966      0.00      0.00   25964    4400   0.02  wazuh-integrato
Average:        0     24987      0.00      0.00  181876    9104   0.04  wazuh-authd
Average:      123     25000      0.00      0.00 1429416   74024   0.36  wazuh-db
Average:        0     25015      0.00      0.00   26024    3844   0.02  wazuh-execd
Average:      123     25051     21.16      0.00 3074092  154500   0.74  wazuh-analysisd
Average:        0     25063      0.00      0.00  216304   13900   0.07  wazuh-syscheckd
Average:      123     25076      0.00      0.00 1373536   16432   0.08  wazuh-remoted
Average:        0     25110      0.15      0.00  815060   23464   0.11  wazuh-logcollec
Average:      123     25130      0.00      0.00   25988    4364   0.02  wazuh-monitord
Average:        0     25139      0.17      0.00 1129500   86520   0.42  wazuh-modulesd
root@Ubuntu24m:/home/vboxuser#
In summary:
The table below shows the average memory usage for the Wazuh central components within the 320-second time frame.
| Process | RSS (MB) |
| java (Wazuh indexer) | 1930.5 |
| node (Wazuh dashboard) | 250.3 |
| wazuh-analysisd | 150.9 |
| filebeat | 85.3 |
| wazuh-modulesd | 84.5 |
| wazuh-db | 72.3 |
| wazuh-logcollec | 22.9 |
| wazuh-syscheckd | 16.0 |
| wazuh-authd | 13.6 |
| wazuh-remoted | 8.9 |
| wazuh-integratord | 4.3 |
| wazuh-monitord | 4.3 |
| wazuh-execd | 3.8 |
| Total | 2651.2 |
The Wazuh central components utilized an average of 2.7GB of RAM out of 20GB within the 320-second time frame, where 54547 events were received.
Indexing latency
Indexing latency measures the time between the Wazuh server log ingestion and indexing in the Wazuh indexer. Minimizing indexing latency is important for real-time threat detection, alerting, and alert visibility using the dashboard.
In the example below, we ran the following command to write an event to a Wazuh agent monitored log file /var/log/syslog.
# echo "$(date '+%b %d %H:%M:%S') 056f5a174943 gdm-password][15647]: pam_unix(gdm-password:auth): authentication failure; logname=test uid=0 euid=0 tty=/dev/tty1 ruser= rhost= user=fakeuser1" >> /var/log/syslog
Then, we used the Discover dashboard to search for the event using the string fakeuser1.
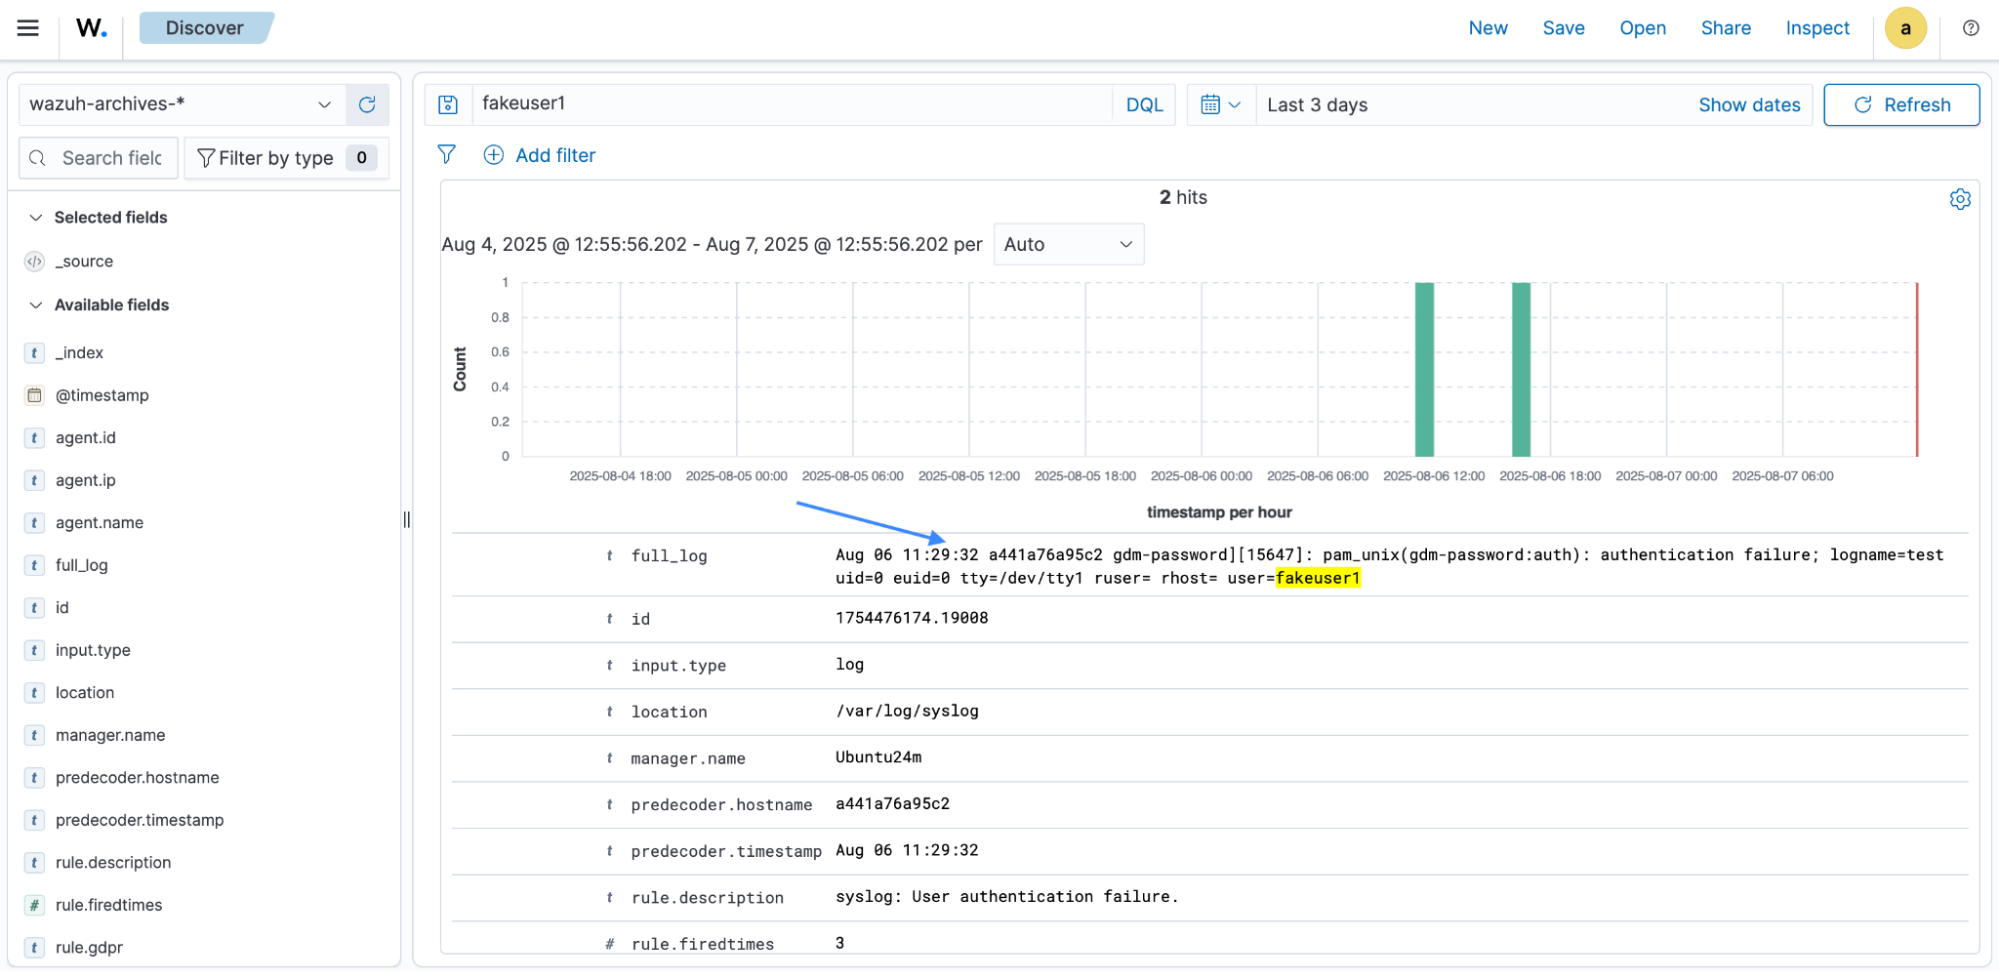
The full_log field shows the time the event was generated using the command in step 1.
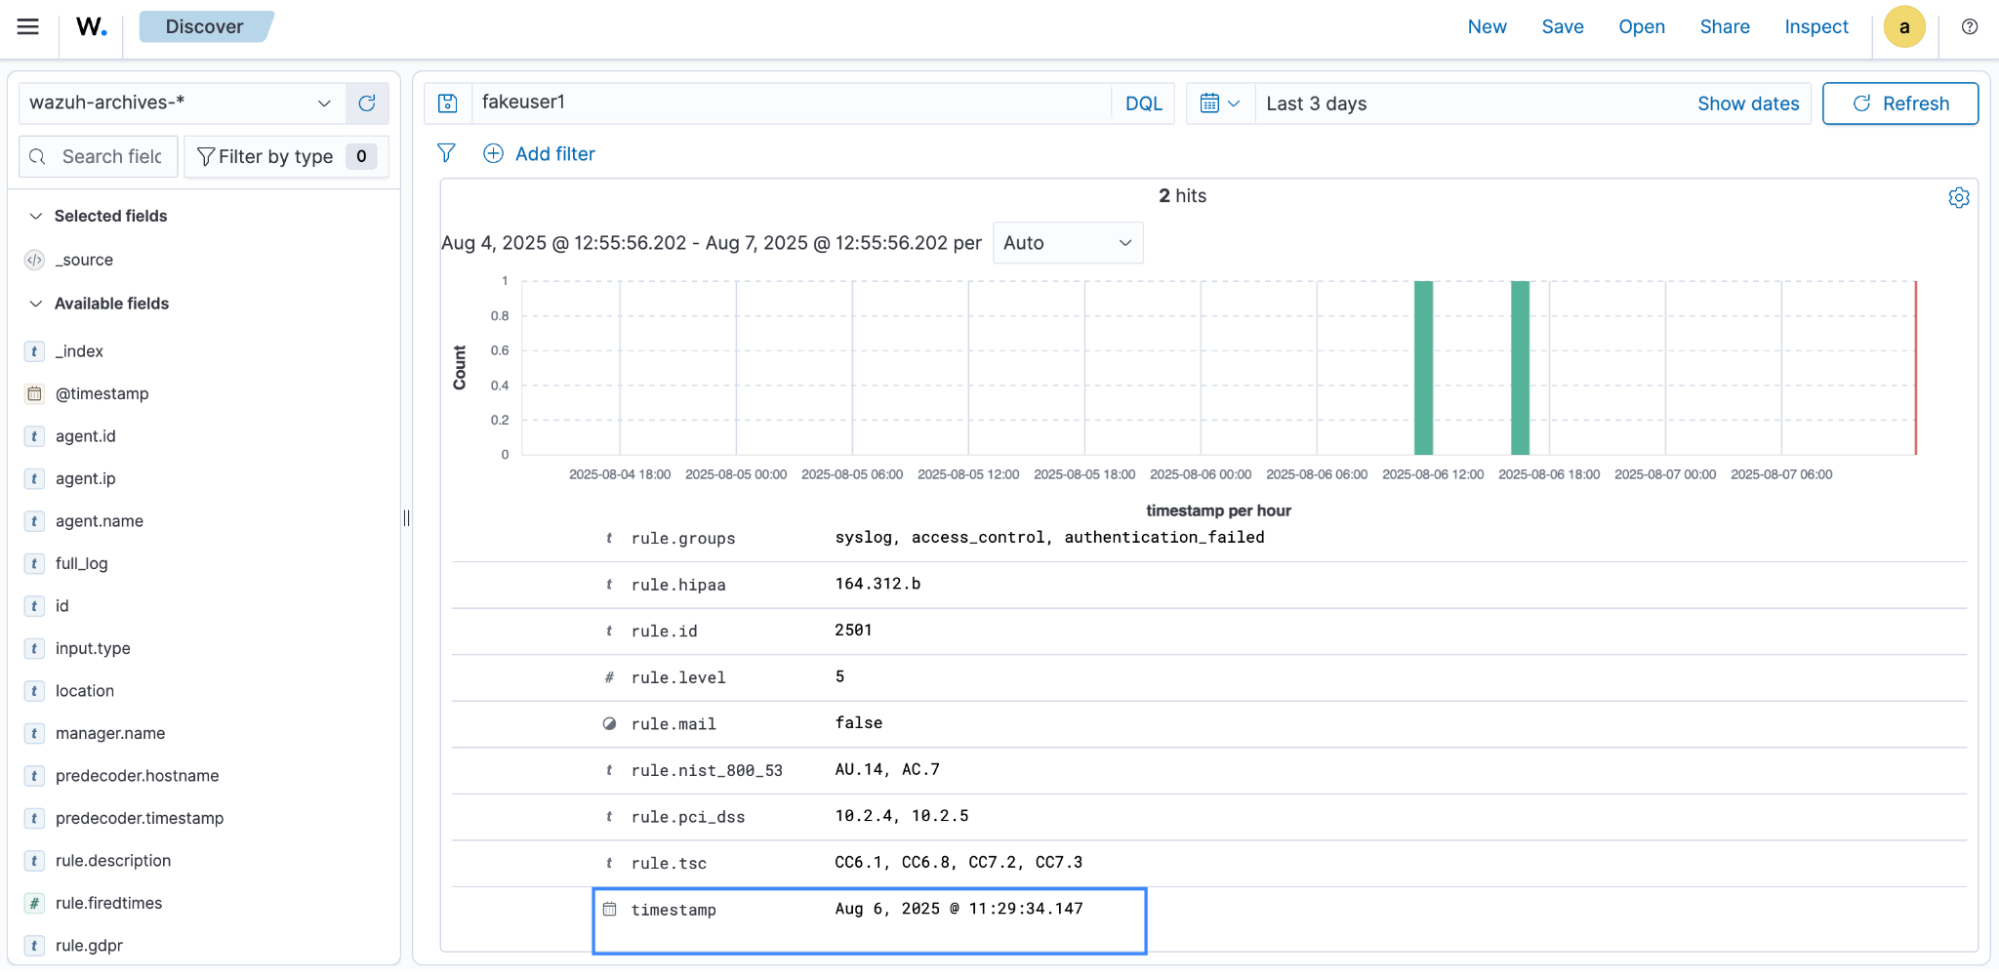
Indexing latency = 11:29:34 – 11:29:32 = 2 seconds.
The timestamp field in Wazuh represents the date and time when the log entry or event was processed by the Wazuh manager and recorded by the Wazuh indexer. Subtracting the time the event was generated, as shown in the full_log field, from the time in the timestamp field equals an indexing latency of 2 seconds.
Log rotation and compression
Wazuh uses configurable log rotation to compress, archive, and clear old logs from disk based on size and retention settings. The wazuh-monitord service automatically triggers log compression and archiving daily or when logs reach a specific limit, such as file size. Measuring this metric lets us know how much disk space is needed while maintaining the historical data necessary for compliance.
In the use case below, we note the log size before and after the daily log rotation and compression.
We ran the command below on our Wazuh server by 11:59 pm to get the log file size before log rotation.
# ls -lh --time-style=full-iso /var/ossec/logs/alerts/$(date +%Y)/$(date +%b)
-rw-r----- 2 wazuh wazuh 753M 2025-08-01 23:59:28.691209643 +0000 ossec-alerts-01.json
-rw-r----- 2 wazuh wazuh 493M 2025-08-01 23:59:28.691209643 +0000 ossec-alerts-01.log
Next, we ran the command below on our Wazuh server by 12:10 am to get the compressed file size after log rotation.
# ls -lh --time-style=full-iso /var/ossec/logs/alerts/$(date +%Y)/$(date +%b)
-rw-r----- 1 wazuh wazuh  25M 2025-08-02 00:04:32.102881279 +0000 ossec-alerts-01.json.gz
-rw-r----- 1 wazuh wazuh  623 2025-08-02 00:04:07.186093621 +0000 ossec-alerts-01.json.sum
-rw-r----- 1 wazuh wazuh  16M 2025-08-02 00:03:57.313262921 +0000 ossec-alerts-01.log.gz
-rw-r----- 1 wazuh wazuh  620 2025-08-02 00:03:23.024941249 +0000 ossec-alerts-01.log.sum
In summary:
| File | File size before compression | File size after compression | Compression percentage (%) |
ossec-alerts-01.json | 753MB | 25MB | 96.68% |
ossec-alerts-01.log | 493MB | 16MB | 96.75% |
CTI coverage
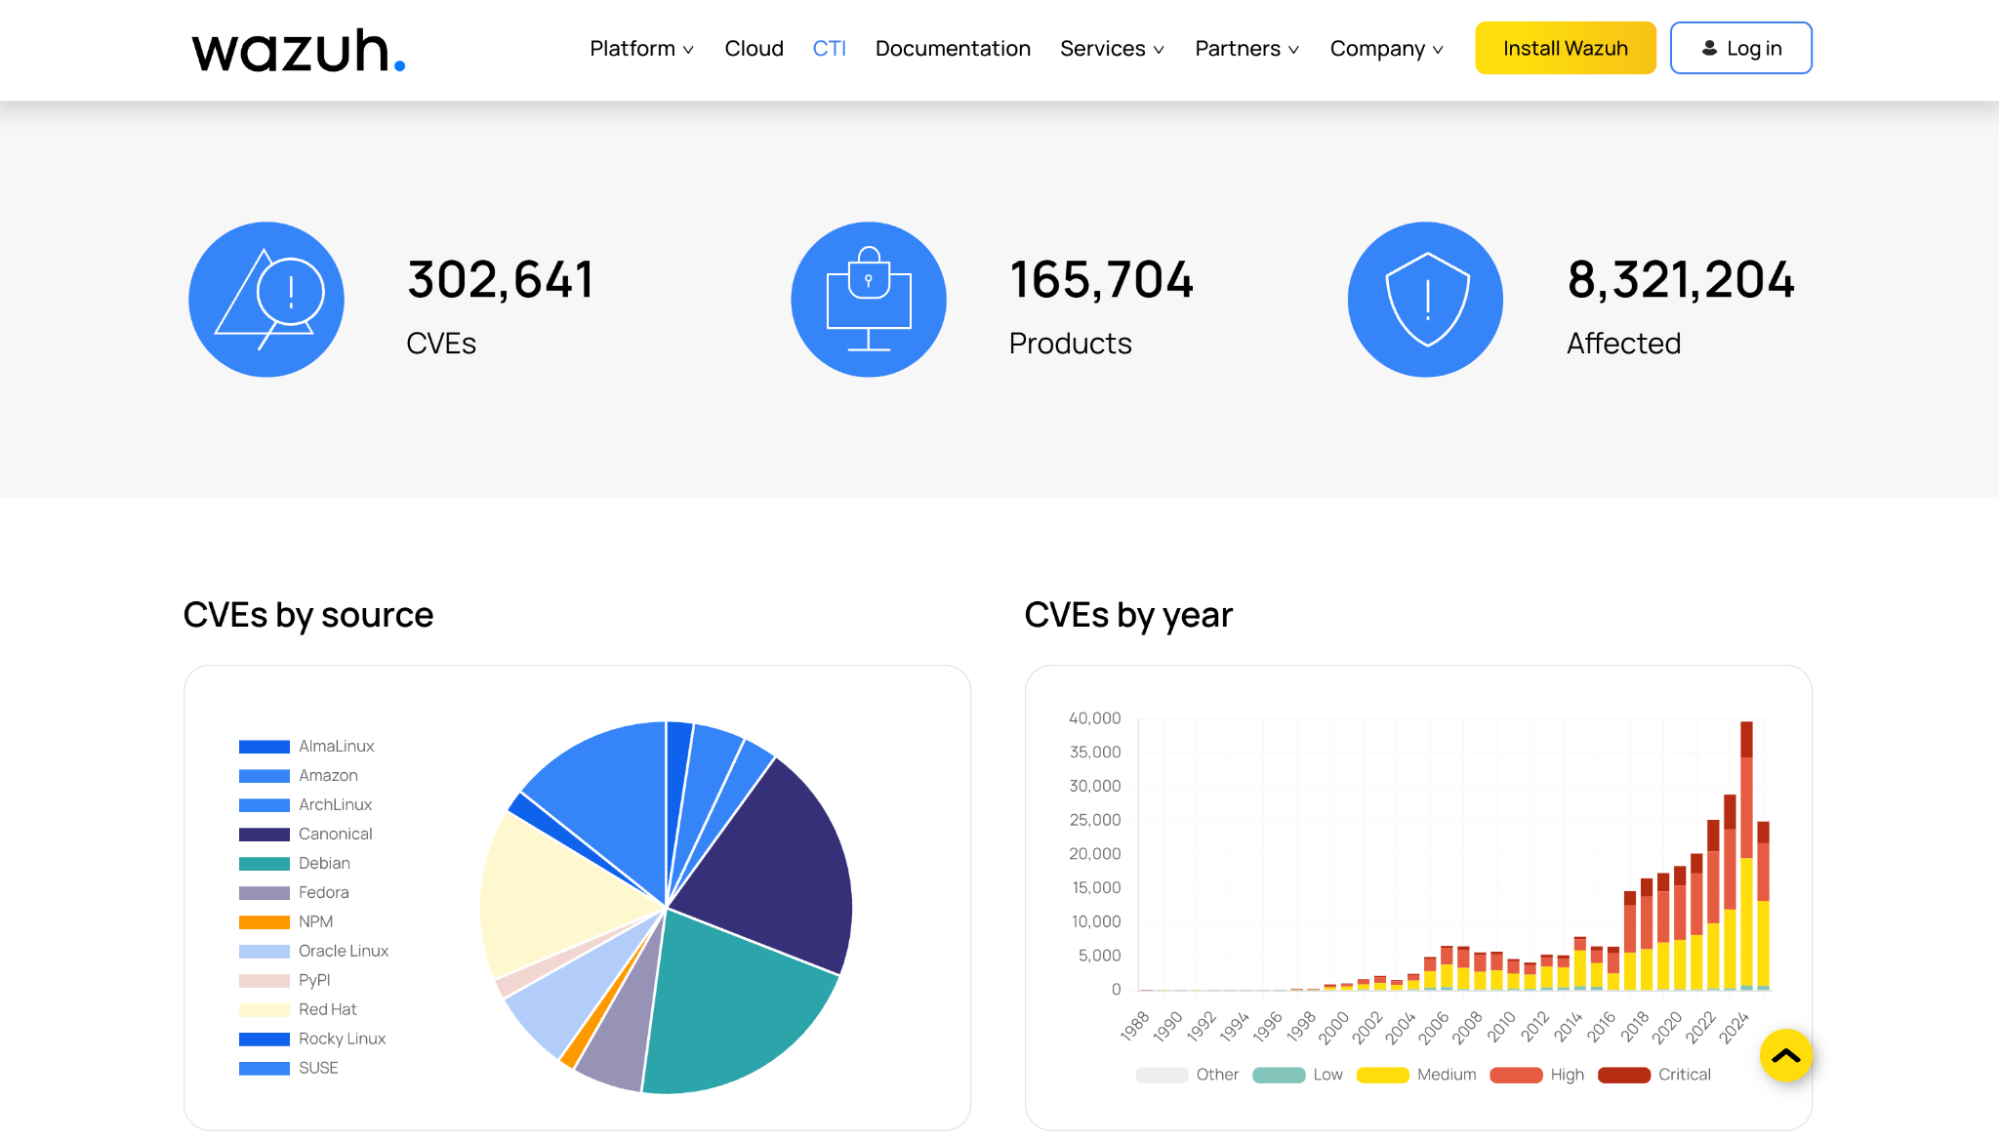
Wazuh Centralized Threat Intelligence (CTI) offers access to an extensive vulnerability database that is soon expanding to contain IoCs, helping you quickly detect and remediate potential threats. You can access this service using the Wazuh CTI website or the Wazuh dashboard by navigating to the Vulnerability Detection section. The Wazuh CTI database is constantly growing and has over 300,000 documented CVEs.
Summary of the performance and operational metrics
The table below summarizes the performance and operational metrics measured for our use case.
| Metric | Value | Description |
| Wazuh agent enrollment time | 20 seconds | It takes approximately 20 seconds for the Wazuh agent to enrol with the Wazuh manager. |
| Wazuh agent reconnection time | <1 second | It takes less than a second for the Wazuh agent to reconnect with the Wazuh manager. |
| CPU usage (average) | 3.75 CPU cores | The value of CPU used amounts to 71% of 5 CPU cores within 320 seconds, when 54547 events were processed. |
| Memory usage (average) | 2.65 GB of RAM | The value of RAM used amounts to 13.06% of 20 GB of RAM within 320 seconds, when 54547 events were processed. |
| Indexing latency | <2 seconds | It takes less than 2 seconds for an event to get indexed. |
| Log compression (JSON) | 96.68% of the original file size compressed | The JSON log file was compressed from 753MB to 25MB. |
| Log compression (LOG) | 96.75% of the original file size compressed | The log file was compressed from 493MB to 16MB. |
| CTI coverage | 300,000+ documented CVEs | There are over 300,000 documented CVEs on the Wazuh CTI. |
Conclusion
Measuring metrics like agent connection time, resource usage, indexing latency, and log compression provides insight into Wazuh operational efficiency as a SIEM/XDR platform. Our tests show that Wazuh handles events with minimal indexing delay, compresses logs effectively to optimize storage, and efficiently utilizes CPU and memory resources. These findings highlight Wazuh ability to process, store, and index security data efficiently, making it a reliable solution for real-time threat detection and compliance-driven environments.Visit our website to find out more, or join our community of users and professionals to get answers to your questions.