Microsoft Hyper-V is a widely used virtualization platform in enterprise environments, powering everything from development labs to production workloads. Like any virtualization technology, it introduces a new layer of complexity and potential attack surface. Monitoring Hyper-V activity is essential for maintaining visibility, detecting misconfigurations, and responding to suspicious behavior.
Wazuh is an open source security platform that helps organizations meet monitoring needs by aggregating security events and analyzing system behavior. Wazuh also correlates data across endpoints and infrastructure, including virtual environments like Hyper-V. Its capabilities support compliance efforts aligned with internationally recognized standards, such as the Common Criteria for Information Technology Security Evaluation (ISO/IEC 15408).
In this blog post, we explain how to configure Wazuh to monitor Hyper-V. We identify relevant event sources, detection methods, and important security logs.
Infrastructure
- Wazuh central components: A pre-configured Wazuh OVA (version 4.12.0). Follow this guide to download and deploy the virtual machine.
- Windows 11 endpoint: We call this the Hyper-V server in further sections.
- Enable Hyper-V.
- Install Wazuh agent 4.12.0 and enroll it with the Wazuh server.
How to monitor Hyper-V with Wazuh
Wazuh provides the tools needed to collect and analyze both operations logs and performance metrics from Hyper-V hosts. This section explains how to monitor Hyper-V through Windows event log channels and how to collect performance metrics for real-time visibility.
Monitoring Hyper-V logs in the Windows event log channels
Microsoft outlines key Windows event channels for Hyper-V monitoring in its Common Criteria Evaluation: Hyper-V Security Target. These channels provide insight into critical components such as virtual machine management, networking, and runtime behavior. Wazuh already offers security coverage for the Windows host running the Hyper-V hypervisor. However, monitoring these Hyper-V-specific channels extends visibility into virtualization activity:
Microsoft-Windows-Hyper-V-VMMS/Admin: Records administrative actions and critical events from the Virtual Machine Management Service (VMMS), including VM lifecycle events and configuration issues.Microsoft-Windows-Hyper-V-VMMS/Networking: Logs events related to virtual network configuration, such as virtual switches, adapters, and connectivity errors.Microsoft-Windows-Hyper-V-VMMS/Analytic(if present): Captures detailed, low-level diagnostic events from VMMS, useful for in-depth troubleshooting and performance analysis.Microsoft-Windows-Hyper-V-Worker/Admin: Reports events from the Hyper-V worker process, including VM execution issues, state transitions, and integration service status.
These channels reflect the core auditing focus described in the Microsoft Common Criteria documentation. Depending on the use case, users can enable and monitor additional Hyper-V channels to track other aspects such as performance, storage, or guest OS behavior.
Configuring the Hyper-V server
Perform the following steps on the Hyper-V server to configure the Wazuh agent to collect logs from the Windows event channels that contain Hyper-V logs:
- Edit the Wazuh agent
C:\Program Files (x86)\ossec-agent\ossec.conffile and append the configuration below:
<ossec_config>

  <localfile>
    <log_format>eventchannel</log_format>
    <location>Microsoft-Windows-Hyper-V-VMMS-Admin</location>
  </localfile>

  <localfile>
    <log_format>eventchannel</log_format>
    <location>Microsoft-Windows-Hyper-V-VMMS-Networking</location>
  </localfile>

  <localfile>
    <log_format>eventchannel</log_format>
    <location>Microsoft-Windows-Hyper-V-VMMS-Analytic</location>
  </localfile>

  <localfile>
    <log_format>eventchannel</log_format>
    <location>Microsoft-Windows-Hyper-V-Worker-Admin</location>
  </localfile>

</ossec_config>
- Restart the Wazuh agent to apply the changes:
> Restart-Service -Name wazuh
Configuring the Wazuh server
Perform the following steps on the Wazuh server to create custom rules to trigger alerts for relevant Hyper-V events:
- Create a new rule file
hyper-v_rules.xmlin the/var/ossec/etc/rules/directory to save the Hyper-V rules:
# touch /var/ossec/etc/rules/hyper-v_rules.xml
- Modify the ownership and permissions of the
/var/ossec/etc/rules/hyper-v_rules.xmlfile:
# chown wazuh:wazuh /var/ossec/etc/rules/hyper-v_rules.xml
# chmod 660 /var/ossec/etc/rules/hyper-v_rules.xml
- Add the following rules to the
/var/ossec/etc/rules/hyper-v_rules.xmlfile:
<group name="hyper-v,windows,">

  <rule id="110070" level="0">
    <if_sid>60009,60010</if_sid>
    <field name="win.system.providerName" type="pcre2">^Microsoft-Windows-Hyper-V</field>
    <description>Base rule for Hyper-V events.</description>
  </rule>

  <rule id="110071" level="3">
    <if_sid>110070</if_sid>
    <field name="win.system.eventID" type="pcre2">^12140$|^12170$|^12180$|^12597$|^12598$|^12670$|^13002$|^13003$|^18500$|^18502$|^18504$|^18510$|^18516$|^18596$|^26000$|^26004$|^26012$|^26016$|^26074$</field>
    <description>Hyper-V: $(win.system.message).</description>
  </rule>

  <rule id="110072" level="5">
    <if_sid>60011</if_sid>
    <field name="win.system.providerName" type="pcre2">^Microsoft-Windows-Hyper-V</field>
    <description>Hyper-V: $(win.system.message).</description>
  </rule>

  <rule id="110073" level="10">
    <if_sid>60012</if_sid>
    <field name="win.system.providerName" type="pcre2">^Microsoft-Windows-Hyper-V</field>
    <description>Hyper-V: $(win.system.message).</description>
  </rule>

</group>
Where:
- Rule ID
110070detects Hyper-V events from the Windows events channel whose severity value isINFORMATIONorWARNING. - Rule ID
110071detects events highlighted by the Microsoft Windows Common Criteria Evaluation by using rule110070as its parent rule. - Rule ID
110072detects Hyper-V events from the Windows events channel whose severity value isWARNING. - Rule ID
110073detects Hyper-V events from the Windows events channel whose severity value isCRITICAL.
- Restart the Wazuh manager service to apply the changes:
# systemctl restart wazuh-manager
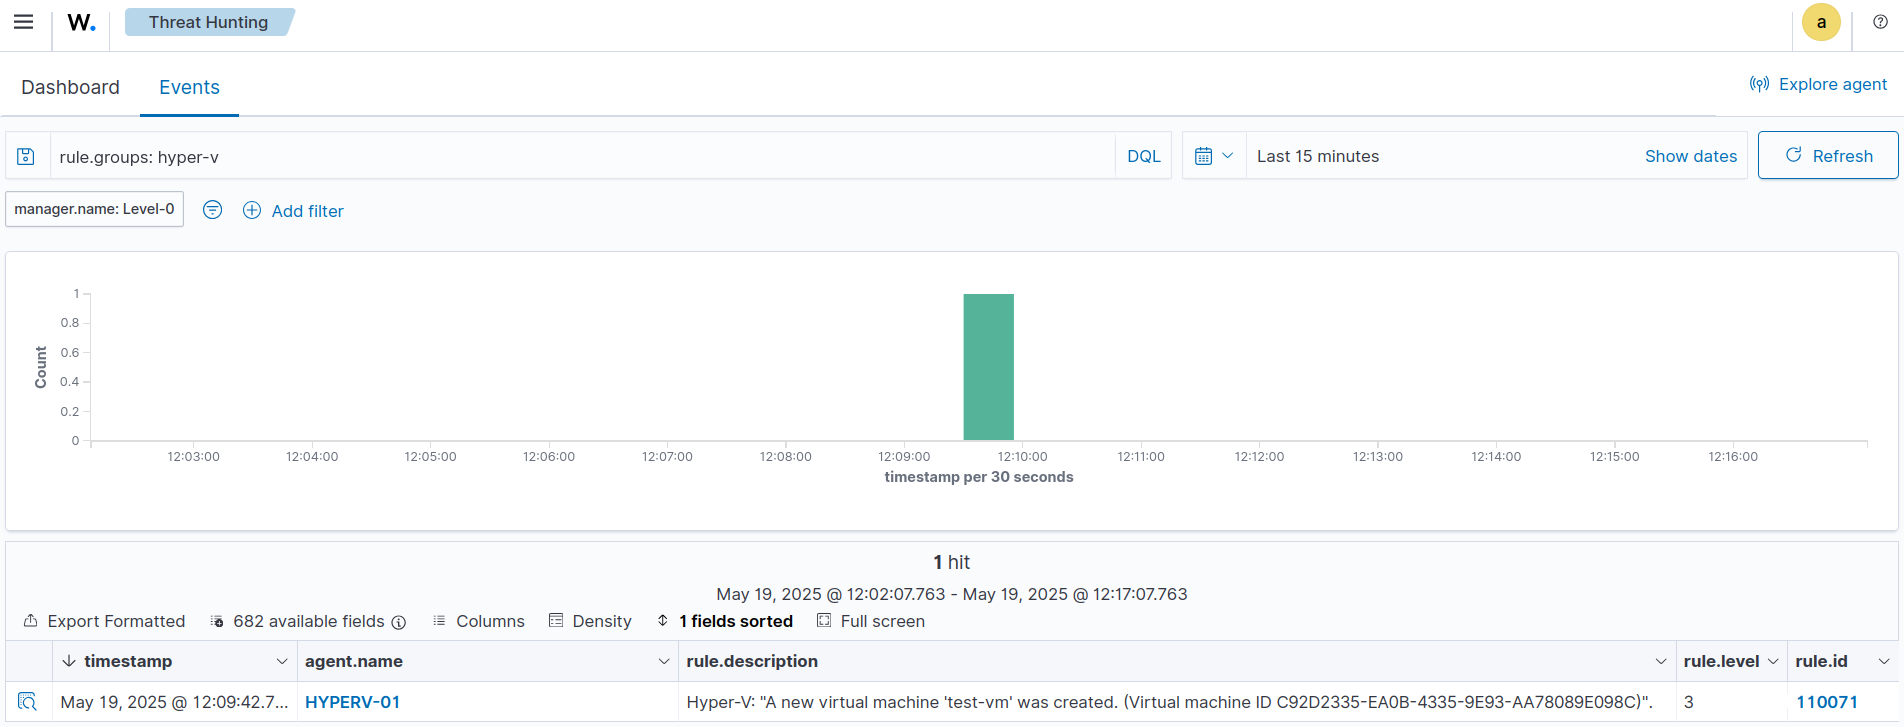
The image below shows alerts generated by Wazuh when a user attempts to create a new virtual machine on the monitored Hyper-V server.
Monitoring Hyper-V performance metrics
In addition to tracking Hyper-V event logs, it is important to monitor performance indicators to assess the health and efficiency of the virtualization environment. Metrics such as CPU usage, memory consumption, disk space utilization, and VM states provide real-time insights into both standalone and clustered Hyper-V setups. To achieve this, we create a PowerShell script that collects these metrics. The Wazuh agent periodically executes this script and ingests the data for further analysis, alerting, and visualization. This helps administrators proactively detect performance issues and maintain optimal system operation.
Configuring the Wazuh server
To enable monitoring and alerting for Hyper-V performance metrics, we need to configure the Wazuh server by defining custom rules. We also update the Filebeat template so that we can create visualizations out of the alert data.
Perform the following steps on the Wazuh server to create the custom rules and configure Filebeat:
- Add the following rules to the
/var/ossec/etc/rules/hyper-v_rules.xmlfile:
<group name="hyper-v,">

  <rule id="110074" level="0">
    <location>command_hyper-v_metrics</location>
    <decoded_as>json</decoded_as>
    <description>Base rule for Hyper-V metrics.</description>
    <options>no_full_log</options>
  </rule>

  <rule id="110075" level="3">
    <if_sid>110074</if_sid>
    <field name="hyper-v.metric">VM state</field>
    <description>Hyper-V metrics: State for the VM "$(hyper-v.vm_name)" is "$(hyper-v.state)".</description>
    <options>no_full_log</options>
  </rule>

  <rule id="110076" level="3">
    <if_sid>110074</if_sid>
    <field name="hyper-v.metric">Disk usage</field>
    <description>Hyper-V metrics: $(hyper-v.used_percent)% of drive "$(hyper-v.drive)" used on "$(hyper-v.host)".</description>
    <options>no_full_log</options>
  </rule>

  <rule id="110077" level="3">
    <if_sid>110074</if_sid>
    <field name="hyper-v.metric">Memory usage</field>
    <description>Hyper-V metrics: $(hyper-v.used_percent)% of memory used on "$(hyper-v.host)".</description>
    <options>no_full_log</options>
  </rule>

  <rule id="110078" level="3">
    <if_sid>110074</if_sid>
    <field name="hyper-v.metric">CPU usage</field>
    <description>Hyper-V metrics: $(hyper-v.used_percent)% of CPU used on "$(hyper-v.host)".</description>
    <options>no_full_log</options>
  </rule>

</group>
Where:
- Rule ID
110074is the base rule for detecting Hyper-V metrics event logs. - Rule ID
110075triggers alerts for VM states. - Rule ID
110076triggers alerts for disk usage metrics. - Rule ID
110077triggers alerts for memory usage metrics. - Rule ID
110078triggers alerts for CPU usage metrics.
- Restart the Wazuh manager service to apply the changes:
# systemctl restart wazuh-manager
- Update the Wazuh Filebeat template in the
/etc/filebeat/wazuh-template.jsonfile to ensure that custom Hyper-V fields are indexed correctly. Locate thedatasection and add the highlighted custom fields underproperties:
{
 "order": 0,
 "index_patterns": [
	"wazuh-alerts-4.x-*",
	"wazuh-archives-4.x-*"
  ],
 "settings": {
   ...
  },
 "mappings": {
	"dynamic_templates": [
  	{
   ...
      "data": {
        "properties": {
          "hyper-v.free_gb": {
            "type": "double"
          },
          "hyper-v.free_percent": {
            "type": "double"
          },
          "hyper-v.used_gb": {
            "type": "double"
          },
          "hyper-v.used_percent": {
            "type": "double"
          },
          "audit": {
            "properties": {
              "acct": {
                "type": "keyword"
- Run the following command to apply the changes to the Wazuh template:
# filebeat setup -index-management
An expected output is shown below:
ILM policy and write alias loading not enabled.

Index setup finished.
Configuring the Wazuh indexer
We configure the Wazuh indexer to properly format the data fields in the Hyper-V metrics. Perform the following steps on the Wazuh dashboard to initialize the data fields in the Wazuh alerts index using queries sent to the Wazuh indexer:
- Navigate to Indexer management > Dev Tools on the Wazuh dashboard. Execute the commands from steps 2 and 3 in the console on this page.
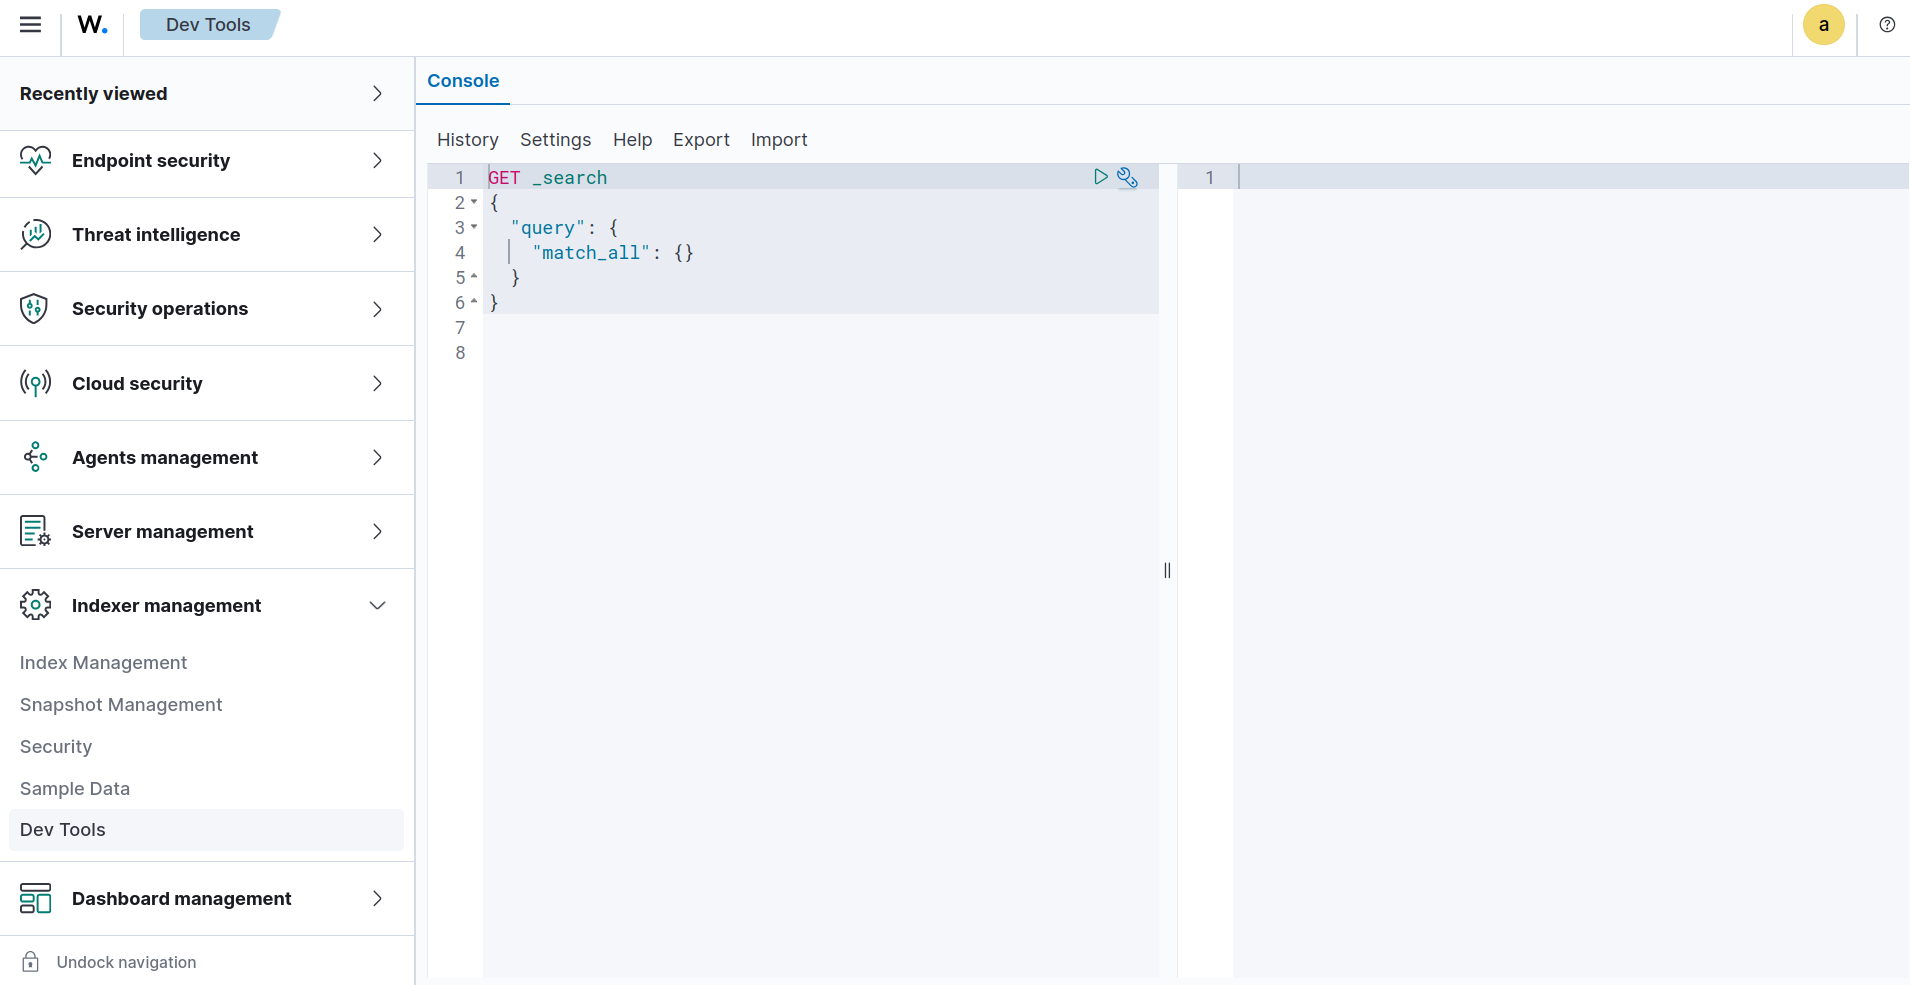
- Run the following command to view all existing indices:
GET _cat/indices/wazuh-alerts-*
In the sample output below, we provide a summary of the Wazuh alert indices:
green open wazuh-alerts-4.x-2025.04.20      	c8QA_rHoTdGhJgXqVaFG2w 3 0   15 0 154.8kb 154.8kb
green open wazuh-alerts-4.x-2025.04.21      	3vu1ZgBoS7m4YibXpA6_AA 3 0  409 0 564.7kb 564.7kb
green open wazuh-alerts-4.x-2025.04.16      	_7VUJ5O1T-WoJNVZgaV5Vw 3 0  625 0   1.9mb   1.9mb
green open wazuh-alerts-4.x-2025.04.28      	cnCLzjKKTCOeeWcohKUjhQ 3 0  309 0   1.2mb   1.2mb
green open wazuh-alerts-4.x-2025.04.17      	NxB5cQESTNe9EAC_eHyxaw 3 0  473 0   1.4mb   1.4mb
green open wazuh-alerts-4.x-2025.04.18      	xveKaLBMSk2Pj6Aqr-wKZg 3 0  132 0 747.4kb 747.4kb
green open wazuh-alerts-4.x-2025.04.22      	3JfGqHLPT5SNvJQK_iIB6g 3 0 1023 0   2.2mb   2.2mb
green open wazuh-alerts-4.x-2025.04.23      	Fr880VHBR-e175Ix-Ul0zw 3 0   18 0 111.1kb 111.1kb
Wazuh alert indices use the format wazuh-alerts-4.x-YYYY.MM.DD. Identify the most recent alerts index in your output and write down the name. The most recent index is typically the current date. For example, the most recent alerts index in the example output above is wazuh-alerts-4.x-2025.04.28
- Run the following command to initialize the fields with the expected data types. Replace
<RECENT_ALERTS_INDEX>with your most recent Wazuh alerts index:
POST <RECENT_ALERTS_INDEX>/_doc
{"timestamp":"2000-01-01T00:00:00.999-0300","data":{"hyper-v":{"free_gb":0.0,"free_percent":0.0,"used_gb":0.0,"used_percent":0.0}}}
For example, if your most recent alerts index is wazuh-alerts-4.x-2025.04.28, send the following request:
POST wazuh-alerts-4.x-2025.04.28/_doc
{"timestamp":"2000-01-01T00:00:00.999-0300","data":{"hyper-v":{"free_gb":0.0,"free_percent":0.0,"used_gb":0.0,"used_percent":0.0}}}
The Wazuh indexer returns a 201 – Created status code along with a JSON response that provides details about the operation.
- Navigate to Dashboard Management > Dashboards Management > Index patterns, select the wazuh-alerts-* index. Click the refresh button in the top-right corner of the page to refresh the index pattern.

Configuring the Hyper-V server
Perform the following steps on the Hyper-V server to create the PowerShell script that will extract the metrics and configure the Wazuh agent to execute it periodically:
- Create a new script file
C:\Program Files (x86)\ossec-agent\wodles\hyper-v_metrics.ps1and add the following content to it:
# Function to output JSON
function Write-JsonLine {
	param (
    	[hashtable]$Data
	)
	$Data | ConvertTo-Json -Compress
}

# Function to safely get value or default
function Safe-Value {
	param (
    	$Value,
    	$Default = 0
	)
	if ($Value -ne $null) {
    	return $Value
	} else {
    	return $Default
	}
}

$node = $env:COMPUTERNAME

# CPU
Get-WmiObject -Class Win32_Processor | ForEach-Object {
	$load = Safe-Value $_.LoadPercentage
	Write-JsonLine @{
    	"hyper-v.metric" = "CPU usage"
    	"hyper-v.host" = $node
    	"hyper-v.used_percent" = $load
    	"hyper-v.free_percent" = 100 - $load
	}
}

# Memory
$mem = Get-WmiObject -Class Win32_OperatingSystem
$total = [math]::Round((Safe-Value $mem.TotalVisibleMemorySize) / 1MB, 2)
$free = [math]::Round((Safe-Value $mem.FreePhysicalMemory) / 1MB, 2)
$used = [math]::Round($total - $free, 2)
$percent = if ($total -ne 0) { [math]::Round(($used / $total) * 100, 2) } else { 0 }
Write-JsonLine @{
	"hyper-v.metric" = "Memory usage"
	"hyper-v.host" = $node
	"hyper-v.used_gb" = $used
	"hyper-v.free_gb" = $free
	"hyper-v.used_percent" = $percent
}

# Disks
Get-WmiObject -Class Win32_LogicalDisk -Filter "DriveType=3" | ForEach-Object {
	$total = [math]::Round((Safe-Value $_.Size) / 1GB, 2)
	$free = [math]::Round((Safe-Value $_.FreeSpace) / 1GB, 2)
	$used = [math]::Round($total - $free, 2)
	$percent = if ($total -ne 0) { [math]::Round(($used / $total) * 100, 2) } else { 0 }
	Write-JsonLine @{
    	"hyper-v.metric" = "Disk usage"
    	"hyper-v.host" = $node
    	"hyper-v.drive" = $_.DeviceID
    	"hyper-v.used_gb" = $used
    	"hyper-v.free_gb" = $free
    	"hyper-v.used_percent" = $percent
	}
}

# VMs
Get-VM | ForEach-Object {
	Write-JsonLine @{
    	"hyper-v.metric" = "VM state"
    	"hyper-v.host" = $node
    	"hyper-v.vm_name" = $_.Name
    	"hyper-v.state" = $_.State.ToString()
	}
}
- Edit the Wazuh agent
C:\Program Files (x86)\ossec-agent\ossec.conffile and append the configuration below:
<ossec_config>
  <wodle name="command">
	<disabled>no</disabled>
	<tag>hyper-v_metrics</tag>
	<command>PowerShell.exe -ExecutionPolicy Bypass -File "C:\Program Files (x86)\ossec-agent\wodles\hyper-v_metrics.ps1"</command>
	<interval>1m</interval>
	<ignore_output>no</ignore_output>
	<run_on_start>yes</run_on_start>
	<timeout>0</timeout>
  </wodle>
</ossec_config>
The <interval> field specifies how often the Wazuh agent should execute the script. It is set to one minute by default but can be adjusted as needed.
- Restart the Wazuh agent via PowerShell with Administrator privileges to apply the changes:
# Restart-Service -Name wazuh
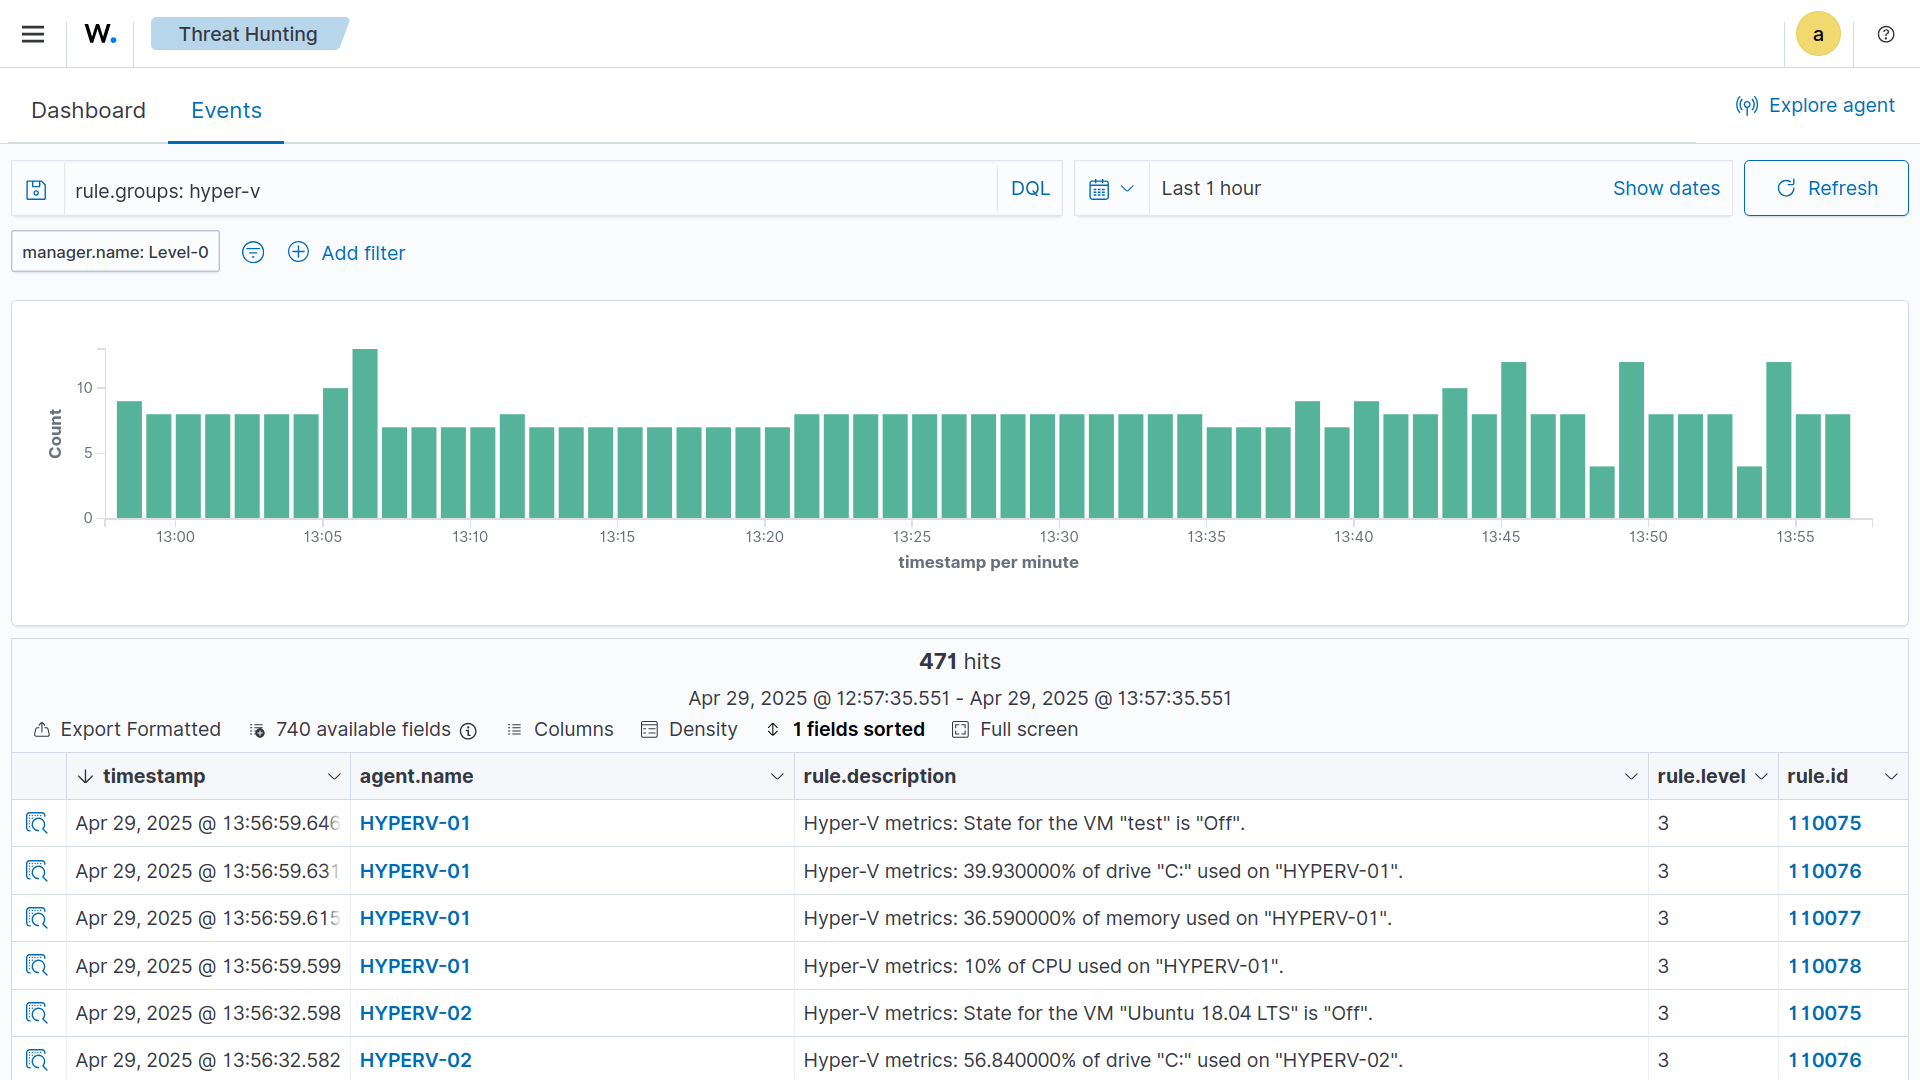
The image below shows example alerts generated by Wazuh for collected Hyper-V performance metrics.
Configuring the Wazuh dashboard
Perform the following steps on the Wazuh dashboard to import the dashboard and supporting visualizations for the Hyper-V metrics:
- Download the export.ndjson file to the endpoint you access the Wazuh dashboard from.
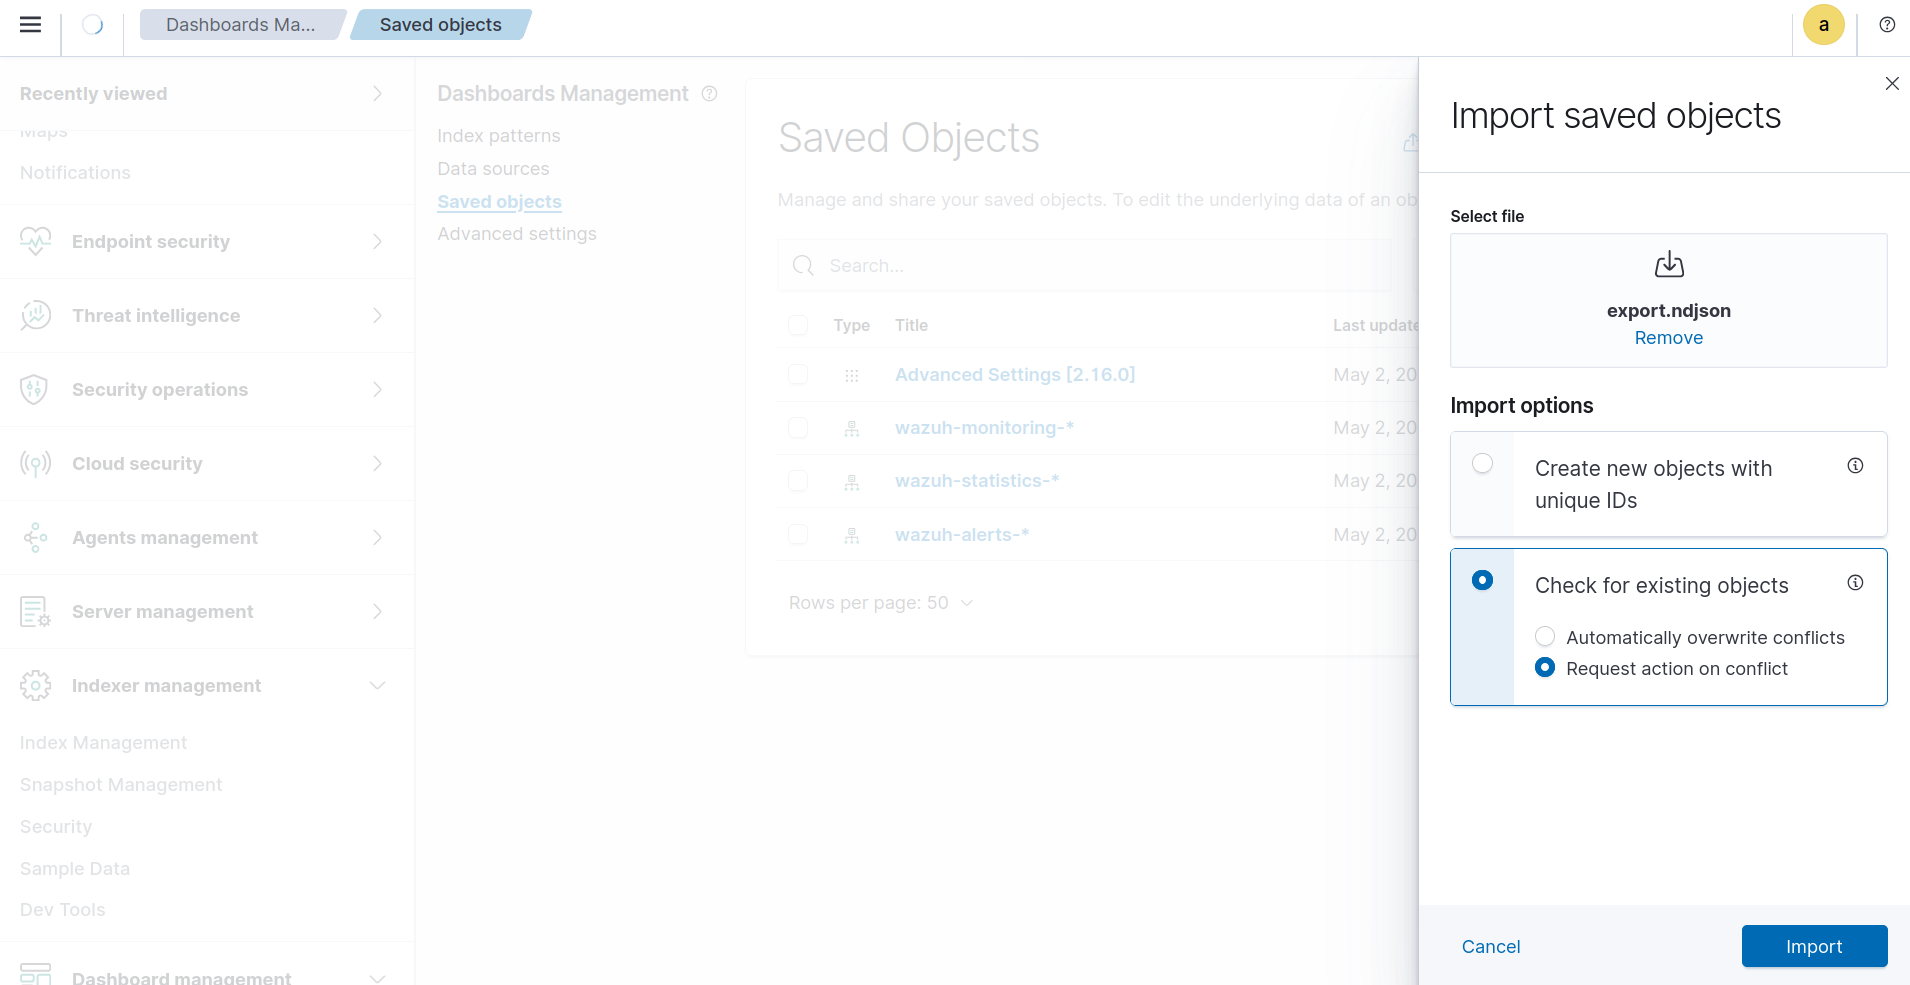
- Navigate to Dashboard Management > Dashboards Management > Saved objects.
- Click Import in the top right-hand corner of the screen.
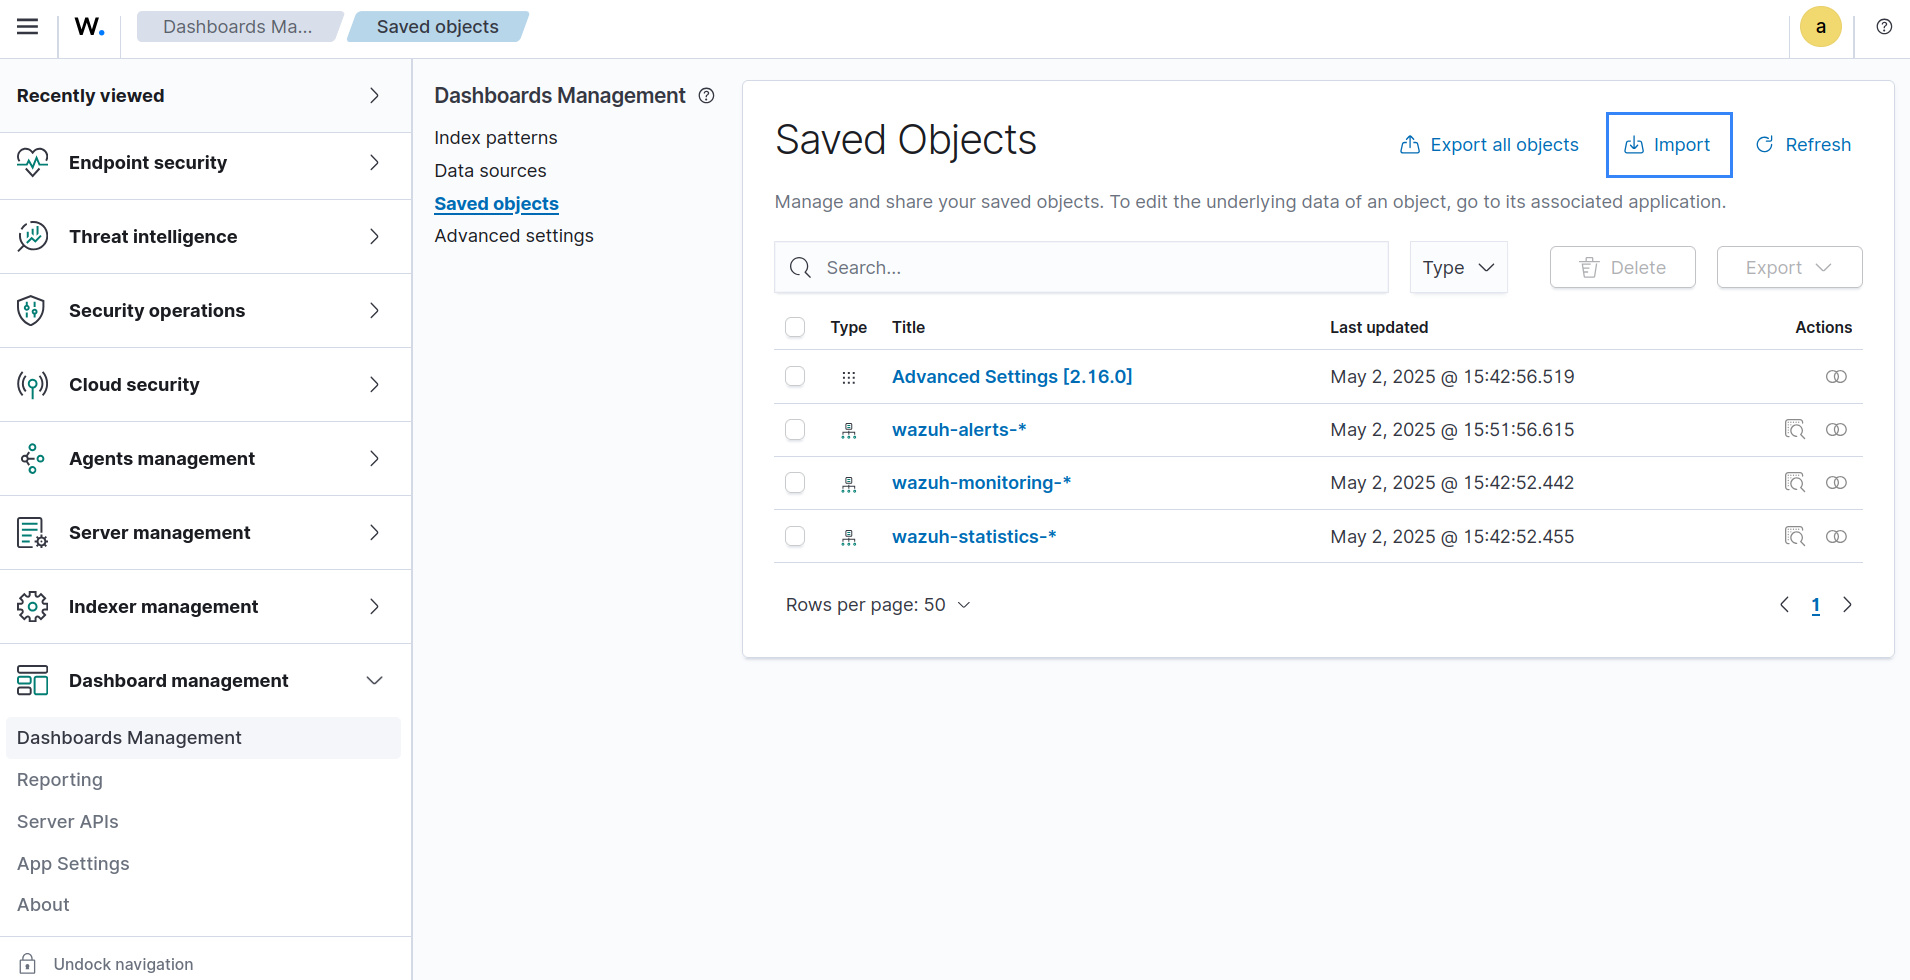
- Select the export.ndjson file downloaded earlier, set the import options to “Request action on conflict”, and click Import.
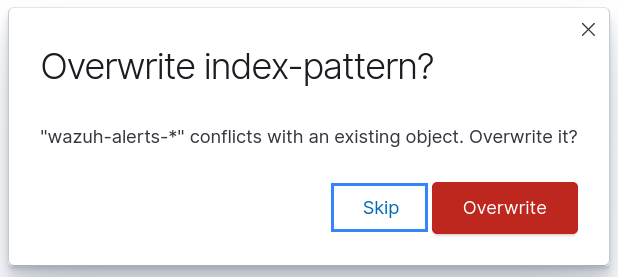
- Click Skip if you see a pop-up about a conflict in the
wazuh-alerts-*index pattern.
- Click Done when the import is complete.
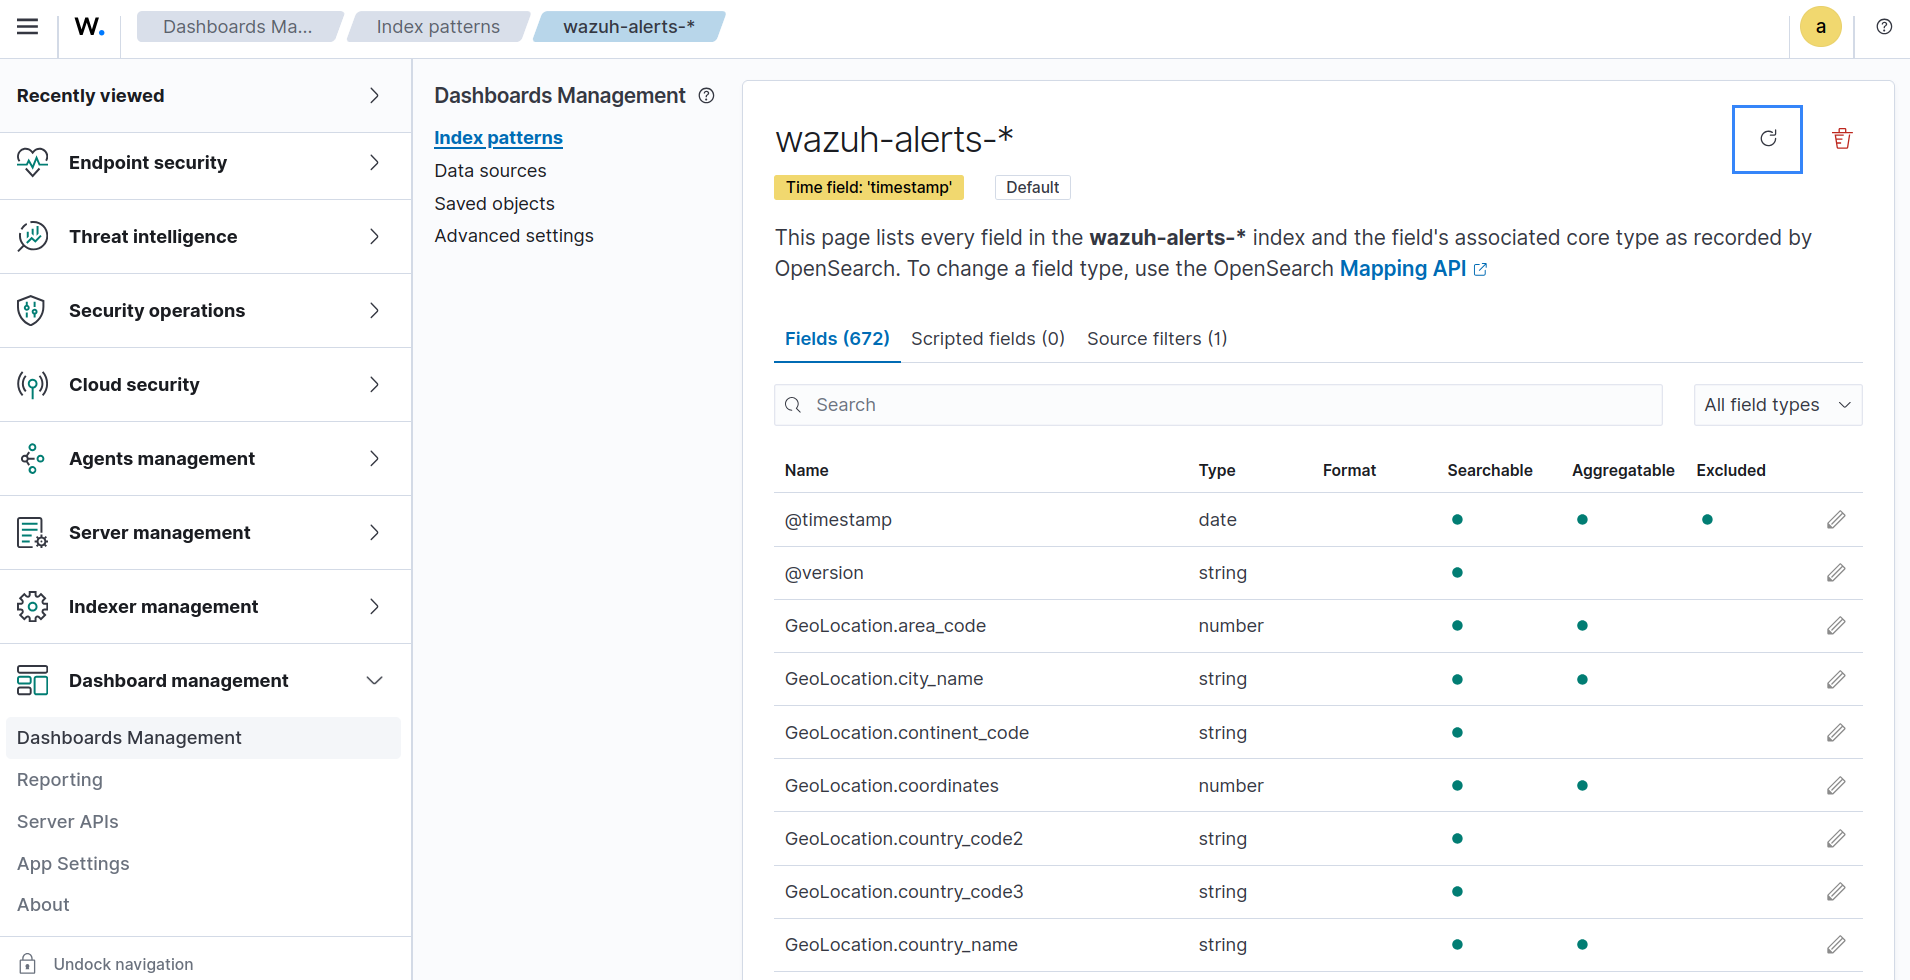
- Navigate to Dashboard Management > Dashboards Management > Index patterns, select the wazuh-alerts-* index. Click the refresh button in the top-right corner of the page to refresh the index pattern.
- Navigate to Explore > Dashboards, and select the Hyper-V metrics dashboard to see the visualizations.
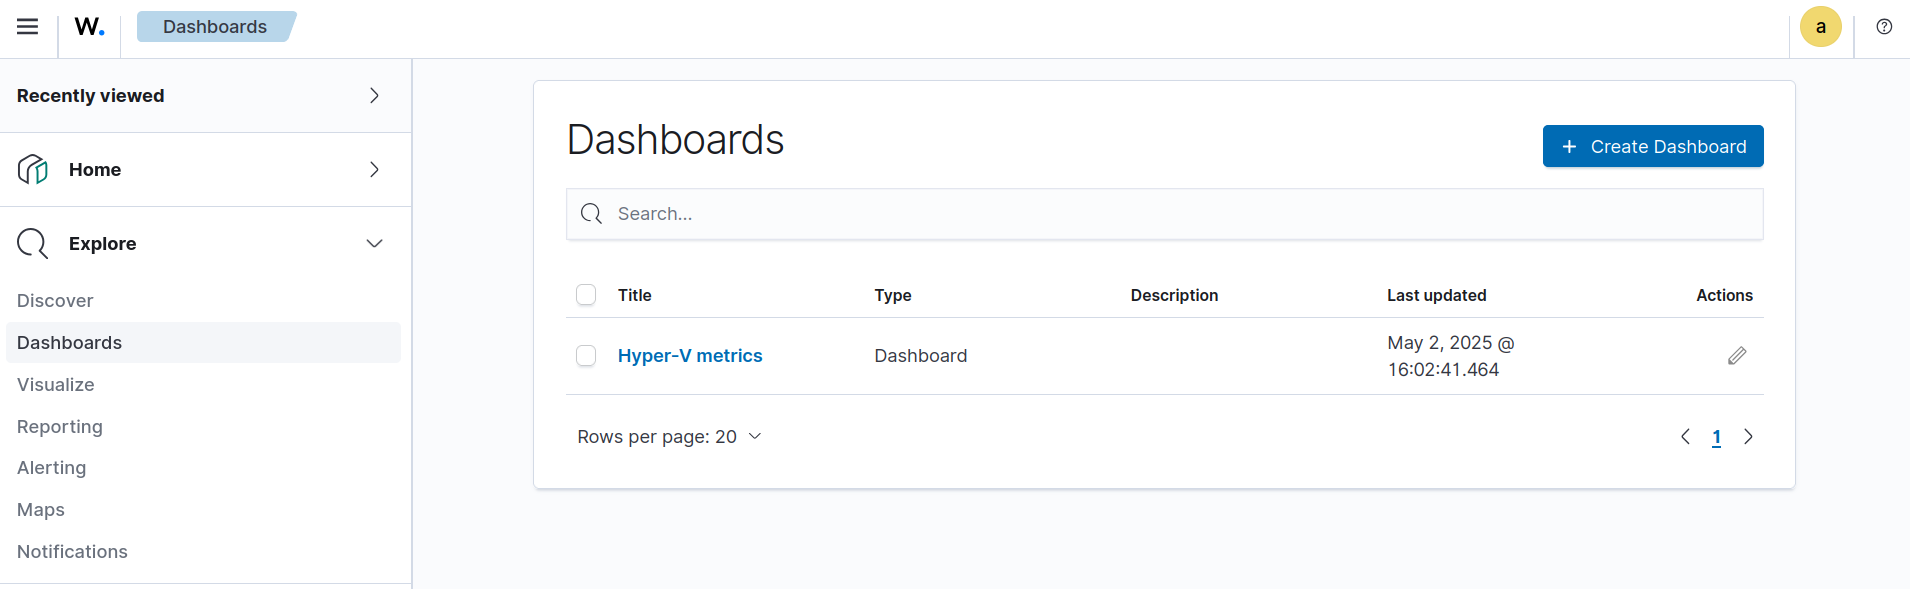
We show an example of what the Hyper-V metrics dashboard looks like in the image below:
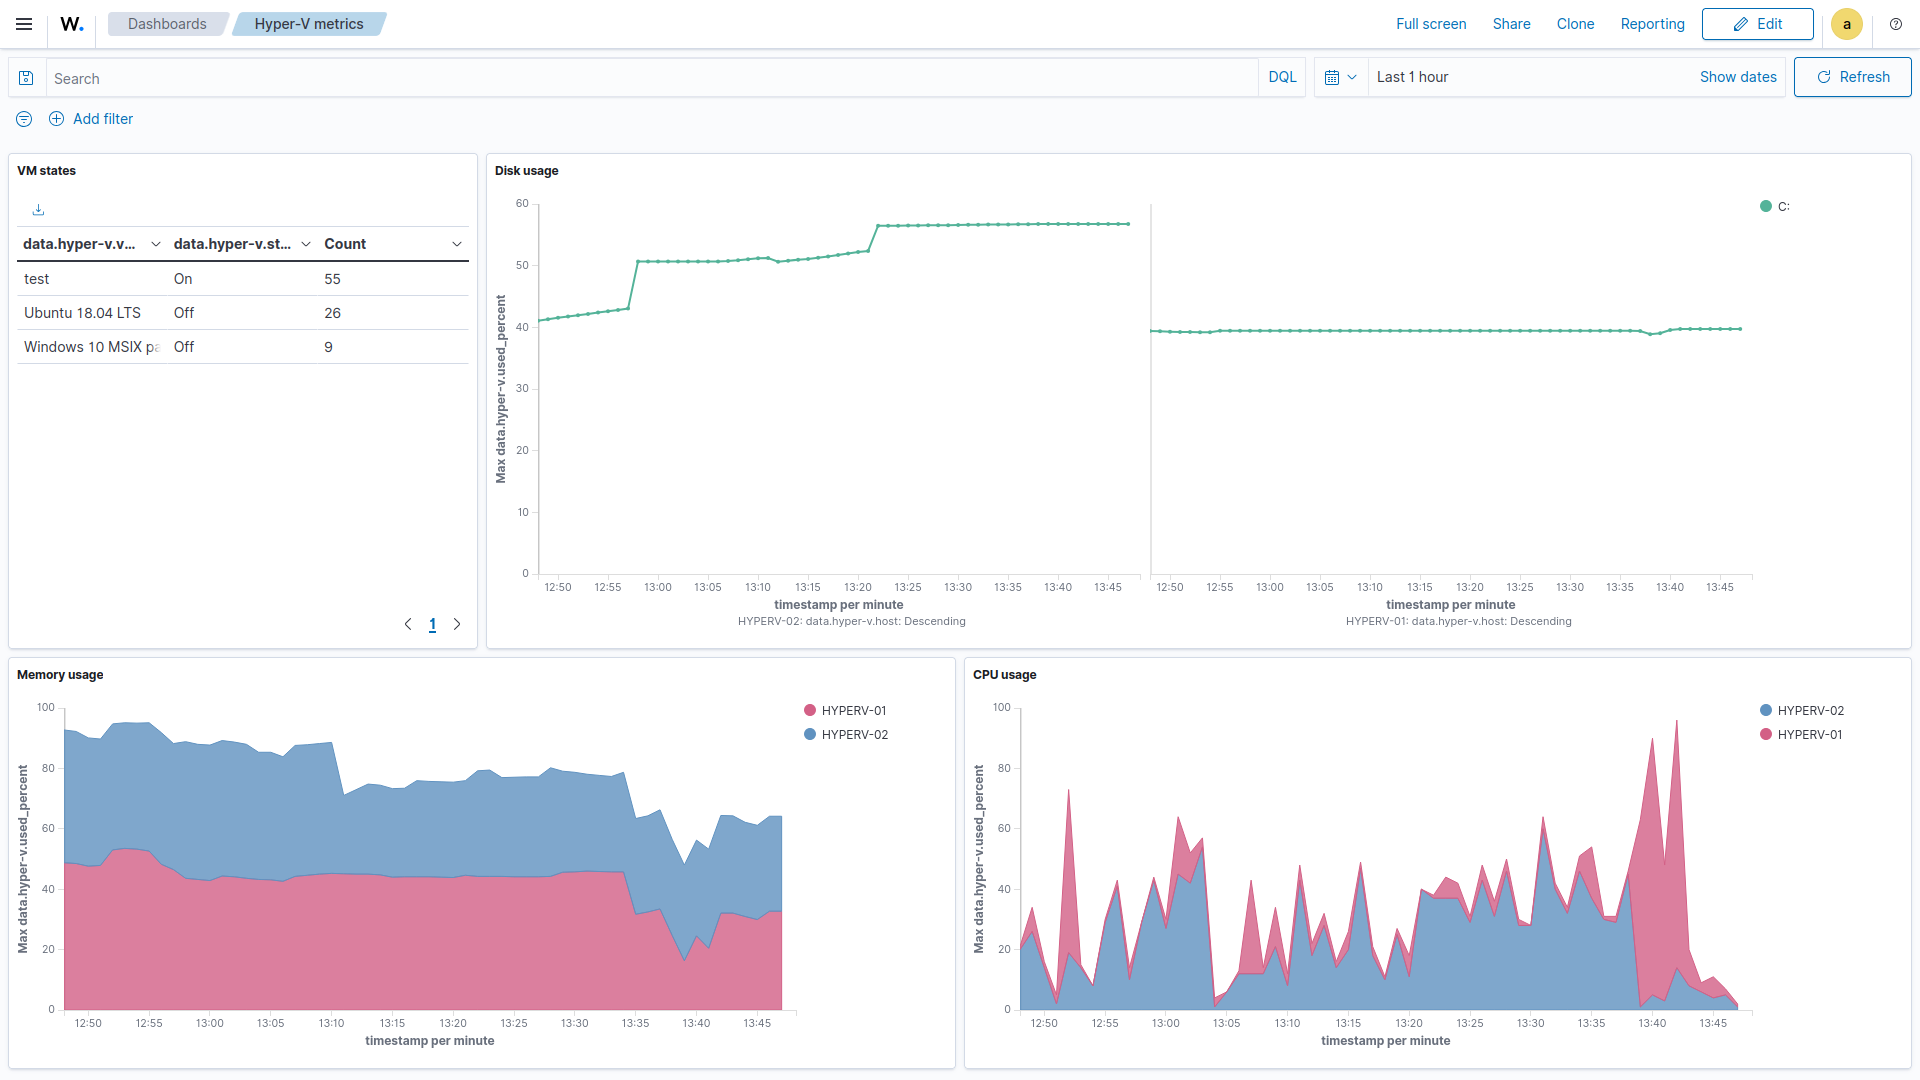
Note
If you see the message Could not locate the index-pattern-field, it usually means no data was available for those fields when the visualizations were created. This is common if, for example, no virtual machine exists yet on the Hyper-V host. After generating relevant data (e.g., creating a VM), repeat step 7 to refresh the wazuh-alerts-* index pattern and update the visualizations.
Conclusion
Monitoring Hyper-V environments is important for maintaining visibility, detecting threats, and ensuring the performance of virtualized workloads. By leveraging Wazuh, organizations can collect and analyze Hyper-V logs and metrics to gain insights into both system behavior and security posture. With custom rules and periodic metric collection, administrators can detect suspicious activities and performance issues. This integrated approach strengthens operational oversight and supports compliance with security standards in enterprise virtual environments.
You can ask questions about this blog post and other topics related to Wazuh in any of our community channels.