
Monitoring Linux resources is crucial for optimizing performance and securing an organization’s data and network. Maintaining system health ensures reliable service delivery, which requires comprehensive visibility of the state of its resources. Organizations can stay ahead of potential performance issues by knowing how endpoint resources are utilized. Wazuh is an open source solution that enables organizations to monitor and manage the security and performance of computer systems.
In this blog post, we describe how to use Wazuh in monitoring Linux system resource usage and maintain security.
Linux performance metrics
Metric data can be generated on every endpoint with the use of different utilities. Metric data provides insight into how endpoint resources are used. This data can be generated on every endpoint with the use of different utilities. Wazuh can collect, index, analyze, and visualize endpoint metric data.
There are primary metrics to consider when monitoring Linux endpoints. The four primary metrics you should track are CPU usage, CPU load, memory utilization, and disk usage.
- CPU usage: This is the percentage of time that a CPU spends working on non-idle tasks.
Linux splits each CPU time into slices and uses the CPU scheduler to allocate these time slices to each task. You can obtain the CPU usage percentage of a Linux endpoint with utilities such as top. A sample result is shown below:
# top -bn1 | grep Cpu

%Cpu(s):  6.6 us,  2.0 sy,  0.0 ni, 91.3 id,  0.0 wa,  0.0 hi,  0.0 si,  0.0 st
Where:
us(user CPU time) is the percentage of time spent running user processes.sy(system CPU time) is the percentage of time spent running the kernel.ni(user nice CPU time) is the percentage of time spent running nice user processes i.e. user space processes that are assigned with execution priority.id(idle CPU time) is the percentage of time spent in the kernel idle handler. The CPU usage is considered to be idle when there are no ongoing I/O operations and the runnable queue is empty.wa(i/o wait CPU time) is the percentage of time that the CPU waits for the completion of disk input/output operations.hi(hardware interrupt request) is the percentage of time that the CPU spends handling/servicing hardware interrupts.si(software interrupt request) is the percentage of time that the CPU spends handling/servicing software interrupts.st(steal time) is the percentage of time that the virtual machine process is waiting on the physical CPU for its CPU time.
Algorithmically, we can calculate the CPU usage percentage in Linux as shown below:
Idle = idle + iowait

NonIdle = user + system + nice + hardirq + softirq + steal

Total = Idle + NonIdle
Hence:
CPU Utilization (%) = ( NonIdle / Total ) * 100
- CPU load: This measures the number of programs that are awaiting or utilizing a processor core at a time. CPU load is different from CPU usage as it is a measure of the average number of programs that are either making use of CPU processing time or waiting for CPU processing time.
You can get the CPU load average with the top or uptime utilities. A sample result is shown below:
uptime

 10:31:03 up  8:42,  2 users,  load average: 2.53, 2.61, 2.84
Where:
- The CPU load in the last one (1) minute is 2.53.
- The CPU load in the last five (5) minutes is 2.61.
- The CPU load in the last fifteen (15) minutes is 2.84.
- Memory utilization: This refers to the percentage of a computer’s available memory that is currently being used by the system or running programs. Users can identify underused and overused servers by monitoring system memory. This creates an opportunity to effectively redistribute loads and optimize memory usage.
You can obtain memory usage information with the use of utilities such as free. A sample result providing insight into the amount of used and unused memory is shown below:
free

          total     used      free     shared     buff/cache     available
Mem:      15Gi      7.1Gi     6.1Gi    940Mi      2.2Gi          7.0Gi
Swap:     2.0Gi     945Mi     1.1Gi
We show how to calculate the percentage of memory utilization below:
Memory Utilization (%) = 100 - ((( MemFree + Buffers + Cached) * 100 ) / totalMemory )
- Disk usage: This is the percentage of disk space in use. This is an important metric that creates an opportunity for users to prevent potential data loss, endpoint lag, and disk failure.
You can get the disk usage of the file system mounted at the root (/) directory with the df utility. A sample output result is shown below:
$ df -h /

Filesystem       Size           Used         Avail      Use%   Mounted on
/dev/nvme0n1p2   528256304      389655668    111693196  78%    /
We show how to calculate the percentage of disk utilization below:
Disk Utilization(%) = ( DiskUsed / DiskTotal ) * 100
Overall, monitoring endpoint resources such as CPU, memory and disk usage can provide vital insights into the health of individual devices on a network. This helps in detecting abnormal behavior that may be indicative of security threats and allows you to prevent data breaches.
Monitoring Linux with Wazuh
- A pre-built, ready-to-use Wazuh OVA 4.12. Follow this guide to download the virtual machine. This endpoint hosts the Wazuh central components (Wazuh server, Wazuh indexer, and Wazuh dashboard).
- Ubuntu 24.04 endpoint with Wazuh agent installed and enrolled to the Wazuh server. A Wazuh agent can be installed by following the deploying Wazuh agents on Linux endpoints guide.
Configuration
We will use the Wazuh command monitoring capability to query and monitor the Ubuntu endpoint performance metrics.
The Wazuh command monitoring module allows you to remotely execute specified commands on monitored endpoints, providing a way to gather important information or perform tasks. Once executed, the output generated by these commands is captured as log data, which can be analyzed to identify potential security threats or gain valuable insights into the behavior of your network.
In this blog post, we configure the command monitoring module to periodically execute commands to query system resources.
Ubuntu endpoint
Perform the following steps to configure the Wazuh command monitoring module.
- Edit the Wazuh agent
/var/ossec/etc/ossec.conffile and add the following command monitoring configuration within the<ossec_config>block:
<!-- CPU, memory, disk metric -->
  <localfile>
     <log_format>full_command</log_format>
     <command>echo $(top -bn1 | grep Cpu | awk '{print $2+$4+$6+$12+$14+$16}' ; free -m | awk 'NR==2{printf "%.2f\t\t\n", $3*100/$2 }' ; df -h | awk '$NF=="/"{print $5}'|sed 's/%//g')</command>
     <alias>general_health_metrics</alias>
     <out_format>$(timestamp) $(hostname) general_health_check: $(log)</out_format>
     <frequency>30</frequency>
  </localfile>

<!-- load average metrics -->
  <localfile>
     <log_format>full_command</log_format>
     <command>uptime | grep load | awk '{print $(NF-2),$(NF-1),$NF}' | sed 's/\,\([0-9]\{1,2\}\)/.\1/g'</command>
     <alias>load_average_metrics</alias>
     <out_format>$(timestamp) $(hostname) load_average_check: $(log)</out_format>
     <frequency>30</frequency>
  </localfile>

<!-- memory metrics -->
  <localfile>
     <log_format>full_command</log_format>
     <command>free --bytes| awk 'NR==2{print $3,$7}'</command>
     <alias>memory_metrics</alias>
     <out_format>$(timestamp) $(hostname) memory_check: $(log)</out_format>
     <frequency>30</frequency>
  </localfile>

<!-- disk metrics -->
  <localfile>
     <log_format>full_command</log_format>
     <command>df -B1 | awk '$NF=="/"{print $3,$4}'</command>
     <alias>disk_metrics</alias>
     <out_format>$(timestamp) $(hostname) disk_check: $(log)</out_format>
     <frequency>30</frequency>
  </localfile>
Note
You can use the centralized configuration to distribute this setting across multiple monitored endpoints. However, remote commands are disabled by default for security reasons and have to be explicitly enabled on each agent.
- Restart the Wazuh agent to apply this change:
# sudo systemctl restart wazuh-agent
Wazuh Server
- Add the following decoders to
/var/ossec/etc/decoders/local_decoder.xmlto decode the logs from the command monitoring module:
<!-- CPU, memory, disk metric -->
<decoder name="general_health_check">
     <program_name>general_health_check</program_name>
</decoder>

<decoder name="general_health_check1">
  <parent>general_health_check</parent>
  <prematch>ossec: output: 'general_health_metrics':\.</prematch>
  <regex offset="after_prematch">(\S+) (\S+) (\S+)</regex>
  <order>cpu_usage_%, memory_usage_%, disk_usage_%</order>
</decoder>

<!-- load average metric -->
<decoder name="load_average_check">
     <program_name>load_average_check</program_name>
</decoder>

<decoder name="load_average_check1">
  <parent>load_average_check</parent>
  <prematch>ossec: output: 'load_average_metrics':\.</prematch>
  <regex offset="after_prematch">(\S+), (\S+), (\S+)</regex>
  <order>1min_loadAverage, 5mins_loadAverage, 15mins_loadAverage</order>
</decoder>

<!-- Memory metric -->
<decoder name="memory_check">
     <program_name>memory_check</program_name>
</decoder>

<decoder name="memory_check1">
  <parent>memory_check</parent>
  <prematch>ossec: output: 'memory_metrics':\.</prematch>
  <regex offset="after_prematch">(\S+) (\S+)</regex>
  <order>memory_used_bytes, memory_available_bytes</order>
</decoder>

<!-- Disk metric -->
<decoder name="disk_check">
     <program_name>disk_check</program_name>
</decoder>

<decoder name="disk_check1">
  <parent>disk_check</parent>
  <prematch>ossec: output: 'disk_metrics':\.</prematch>
  <regex offset="after_prematch">(\S+) (\S+)</regex>
  <order>disk_used_bytes, disk_free_bytes</order>
</decoder>
- Create rules to detect metrics in the logs from the command monitoring module. Add the rules to the custom rules file
/var/ossec/etc/rules/local_rules.xmlon the Wazuh server:
<group name="performance_metric,">

<!-- CPU, Memory and Disk usage -->
<rule id="100054" level="3">
  <decoded_as>general_health_check</decoded_as>
  <description>CPU | MEMORY | DISK usage metrics</description>
</rule>

<!-- High memory usage -->
<rule id="100055" level="12">
  <if_sid>100054</if_sid>
  <field name="memory_usage_%" type="pcre2">^[8-9]\d|100</field>
  <description>Memory usage is high: $(memory_usage_%)%</description>
  <options>no_full_log</options>
</rule>

<!-- High CPU usage -->
<rule id="100056" level="12">
  <if_sid>100054</if_sid>
  <field name="cpu_usage_%" type="pcre2">^[8-9]\d|100</field>
  <description>CPU usage is high: $(cpu_usage_%)%</description>
  <options>no_full_log</options>
</rule>

<!-- High disk usage -->
<rule id="100057" level="12">
  <if_sid>100054</if_sid>
  <field name="disk_usage_%" type="pcre2">[7-9]\d|100</field>
  <description>Disk space is running low: $(disk_usage_%)%</description>
  <options>no_full_log</options>
</rule>
<!-- Load average check -->
<rule id="100058" level="3">
  <decoded_as>load_average_check</decoded_as>
  <description>load average metrics</description>
</rule>

<!-- memory check -->
<rule id="100059" level="3">
  <decoded_as>memory_check</decoded_as>
  <description>Memory metrics</description>
</rule>

<!-- Disk check -->
<rule id="100060" level="3">
  <decoded_as>disk_check</decoded_as>
  <description>Disk metrics</description>
</rule>

</group>
Where:
- Rule ID
100054is the base rule for detecting resource monitoring events. - Rule ID
100055is triggered when the memory utilized exceeds 80%. - Rule ID
100056is triggered when the CPU utilization exceeds 80%. - Rule ID
100057is triggered when the disk space used exceeds 70%. - Rule ID
100058is triggered when a CPU load average check is done. - Rule ID
100059is triggered when a memory metric check is done. - Rule ID
100060is triggered when a disk metrics check is done.
3. Restart the Wazuh manager to apply these changes:
# sudo systemctl restart wazuh-manager
You will see relevant alerts on the Wazuh dashboard after restarting the Wazuh manager service.
Wazuh dashboard
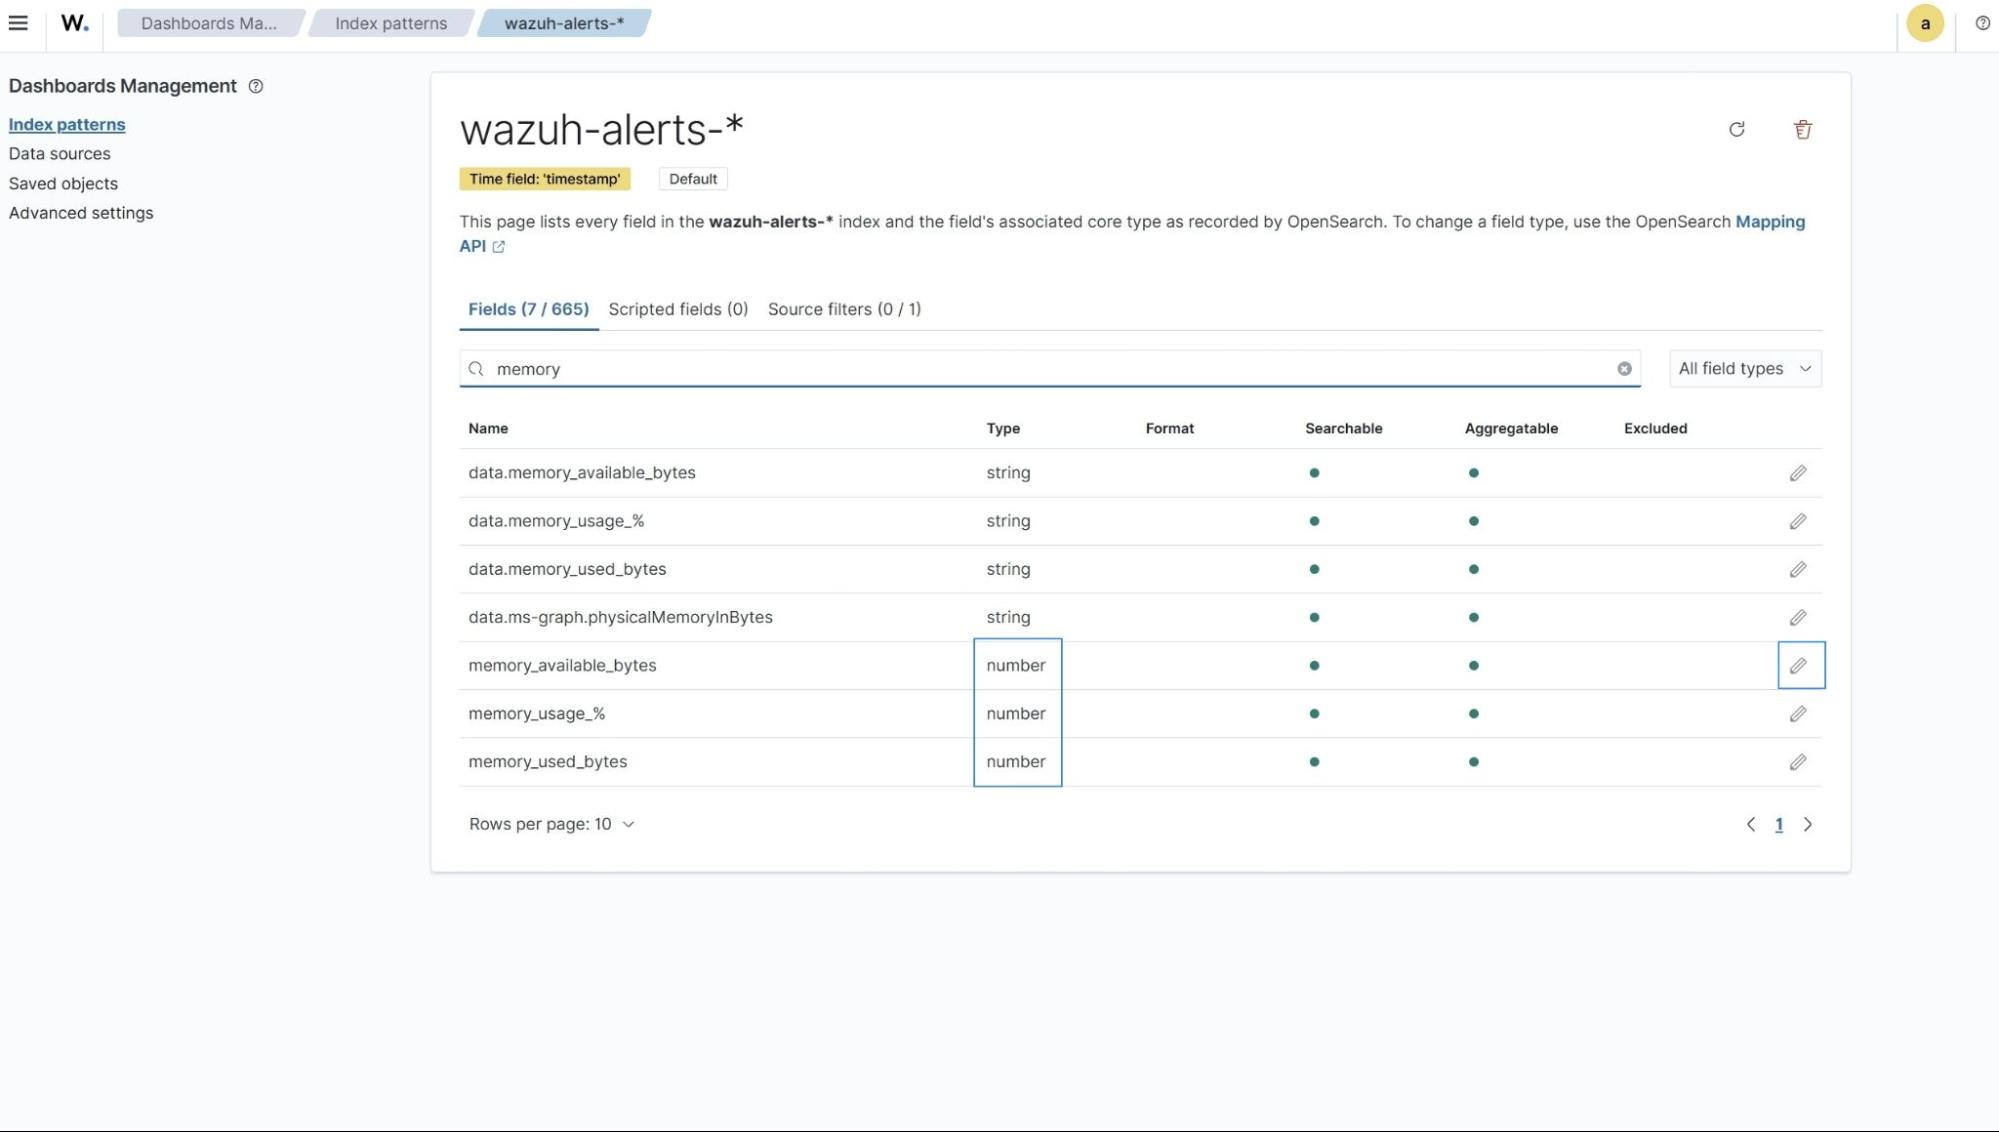
The newly added custom fields, data.1min_loadAverage, data.5min_loadAverage, data.15mins_loadAverage, data.cpu_usage_%, data.memory_usage_%, data.disk_usage_%, data.disk_free_bytes, data.disk_used_bytes, memory_used_bytes, data.memory_available_bytes will be displayed as an unknown field, as highlighted in the figure below. This is because the Wazuh dashboard may not recognize the new fields. You need to update the index pattern in the Wazuh dashboard to include the new fields.
- Refresh the index pattern by selecting the top left menu ☰ and navigate to Dashboard Management -> Index Patterns -> wazuh-alerts-*. Click the refresh button on that index pattern page as shown below.
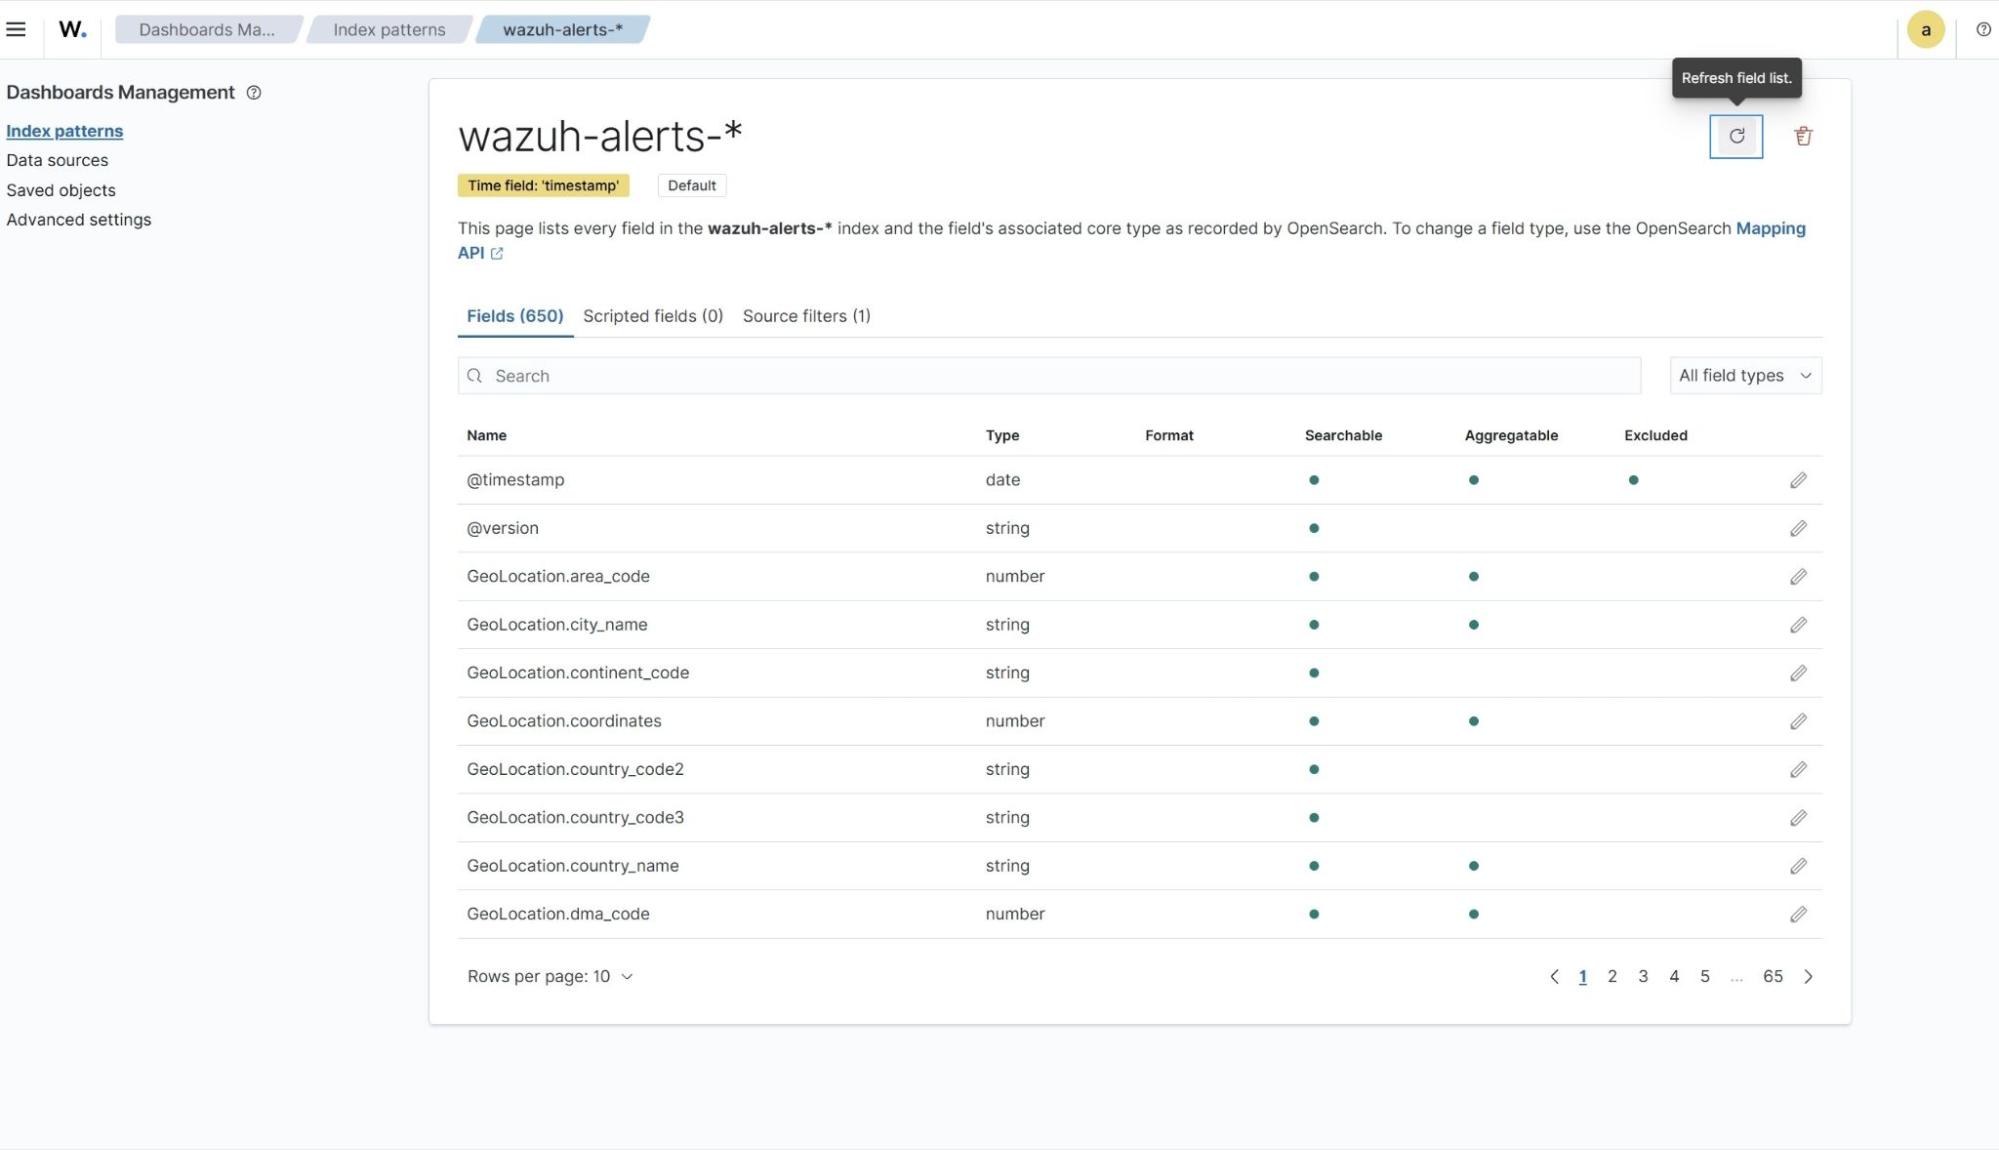
- Verify the custom fields now exist in the default string format.
Follow the steps below to view the alerts generated on the Wazuh dashboard to monitor resources on the Linux endpoint.
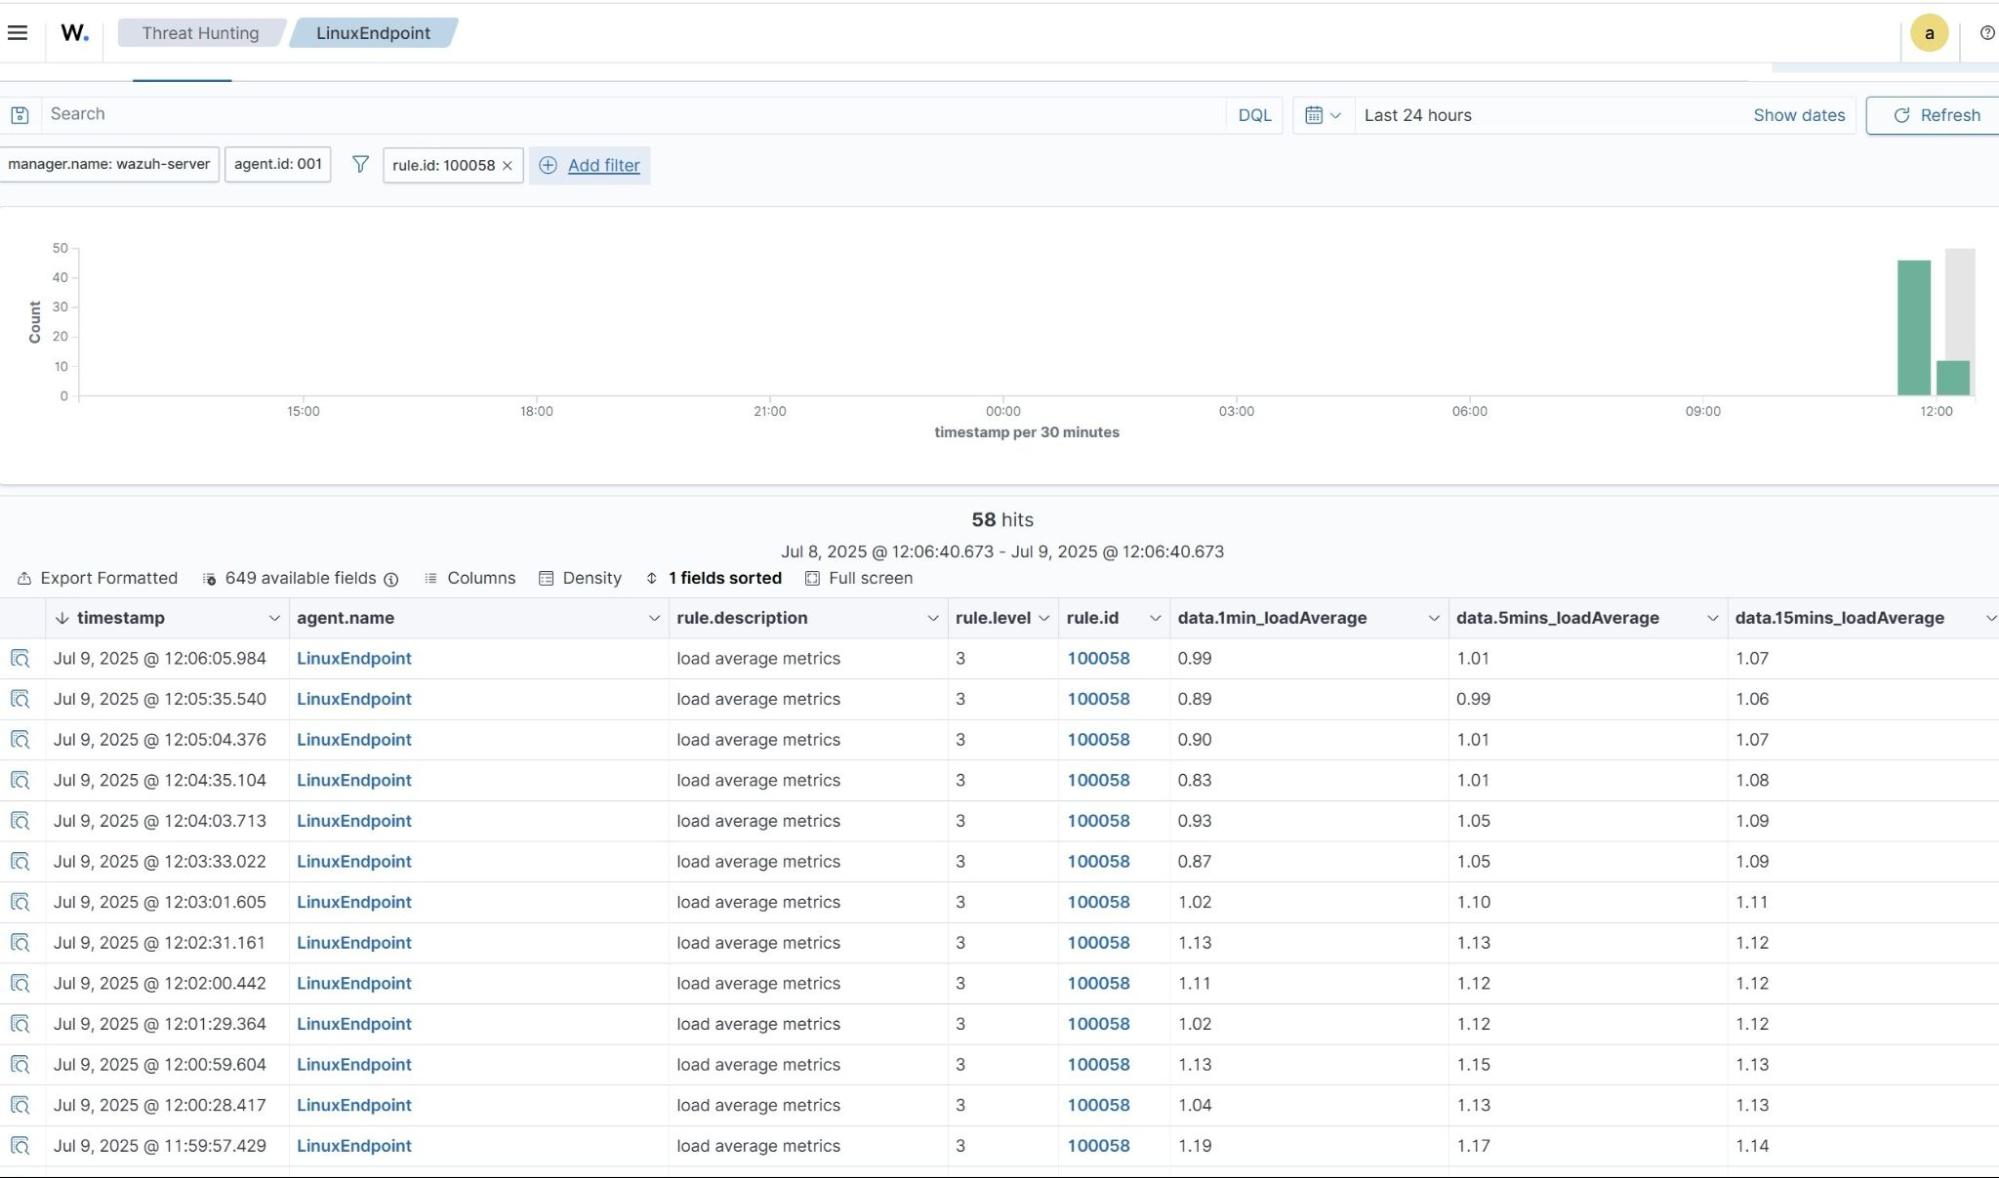
Load average
- Navigate to Threat intelligence > Threat Hunting and click the Events tab.
- Click + Available fields. Then search
data.1min_loadAverage,data.5min_loadAverage,data.15mins_loadAverageand toggle on. - Click + Add filter. Then filter by
rule.id. - In the Operator field, select
is. - Search and select
100058in the Values field. - Click Save.
CPU, Memory & Disk metric usage
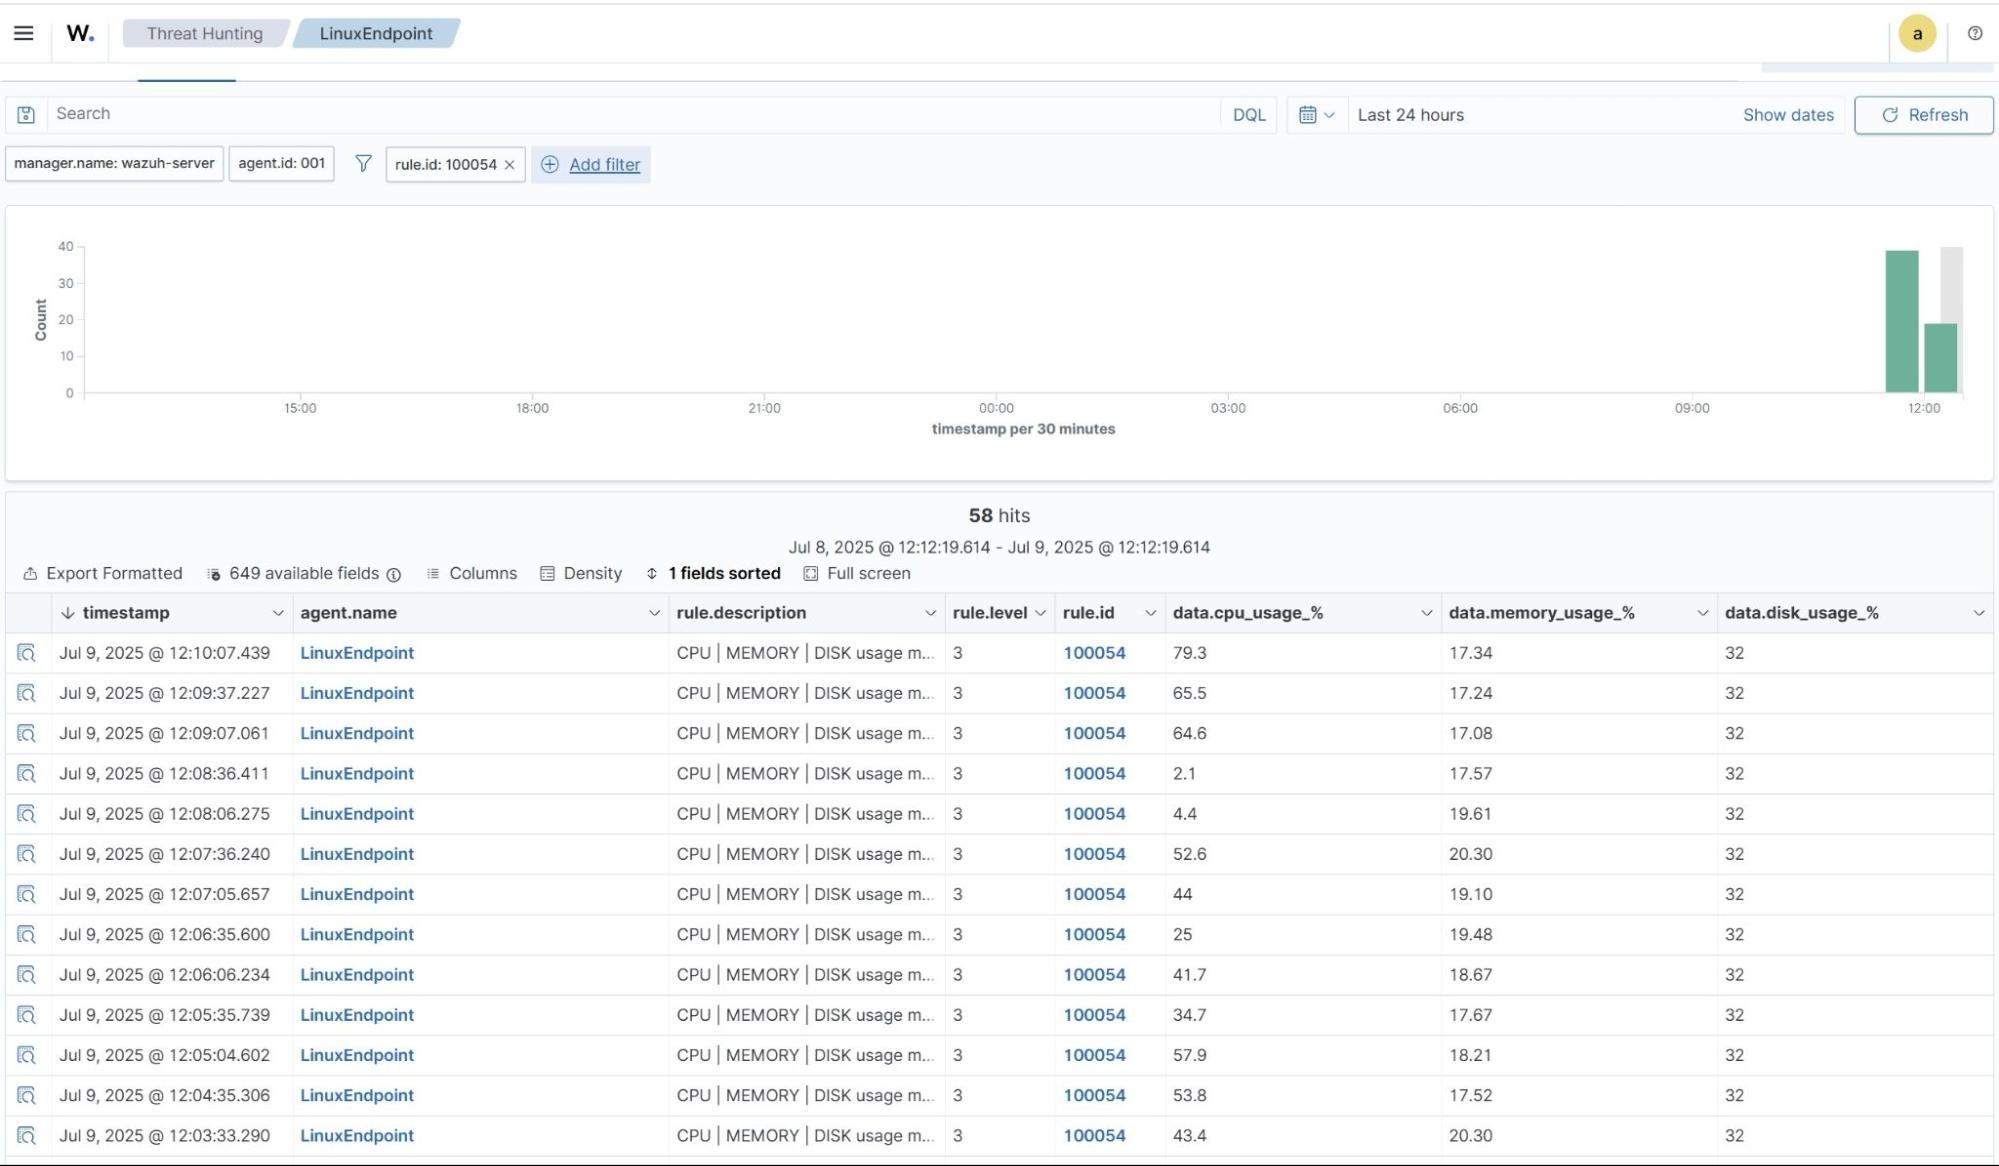
- Navigate to Threat intelligence > Threat Hunting and click the Events tab.
- Click + Available fields. Then search
data.cpu_usage_%,data.memory_usage_%,data.disk_usage_%and toggle on. - Click + Add filter. Then filter by
rule.id. - In the Operator field, select
is. - Search and select
100054in the Values field. - Click Save.
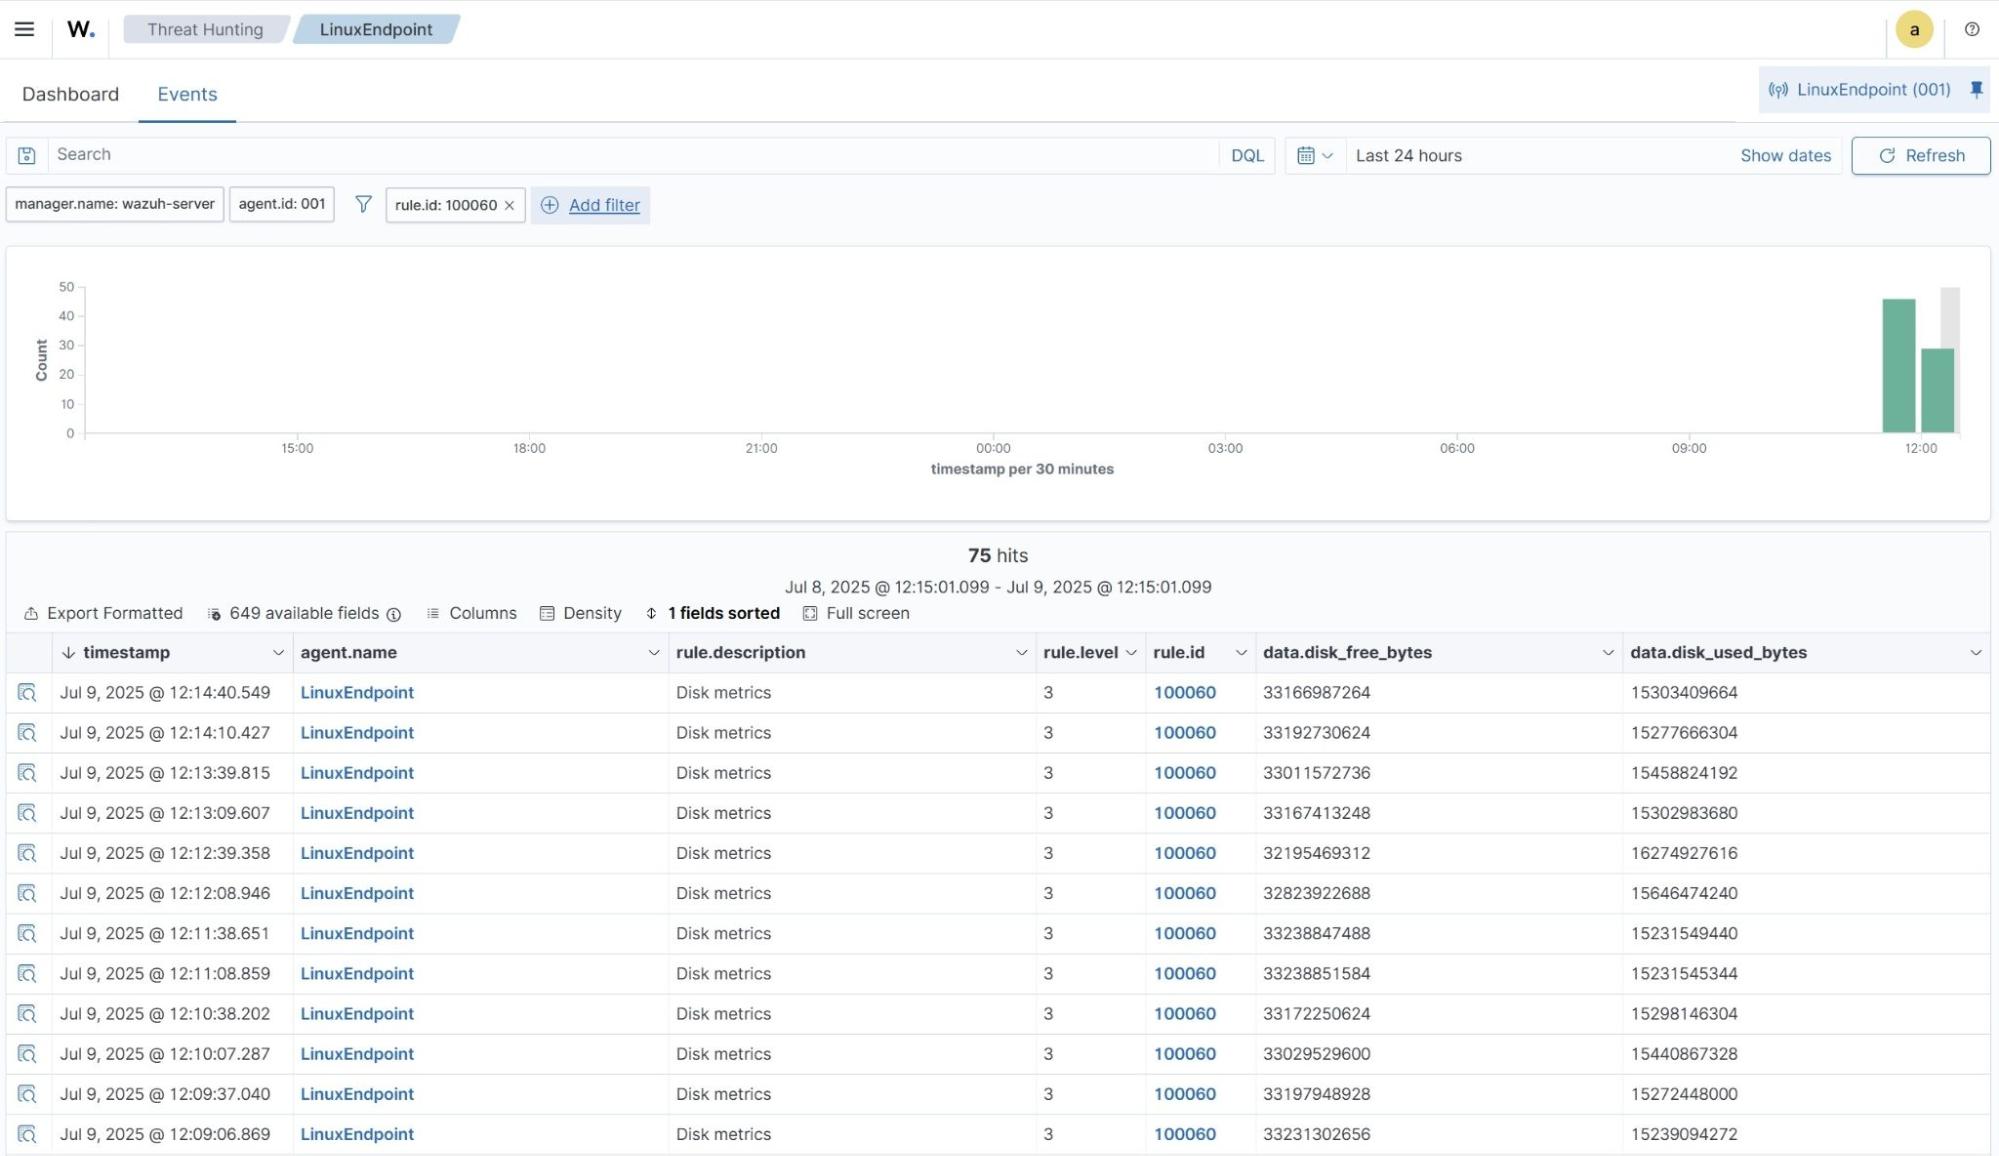
Disk usage
- Navigate to Threat intelligence > Threat Hunting and click the Events tab.
- Click + Available fields. Then search
data.disk_free_bytes,data.disk_used_bytes, and toggle on. - Click + Add filter. Then filter by
rule.id. - In the Operator field, select
is. - Search and select
100060in the Values field. - Click Save.
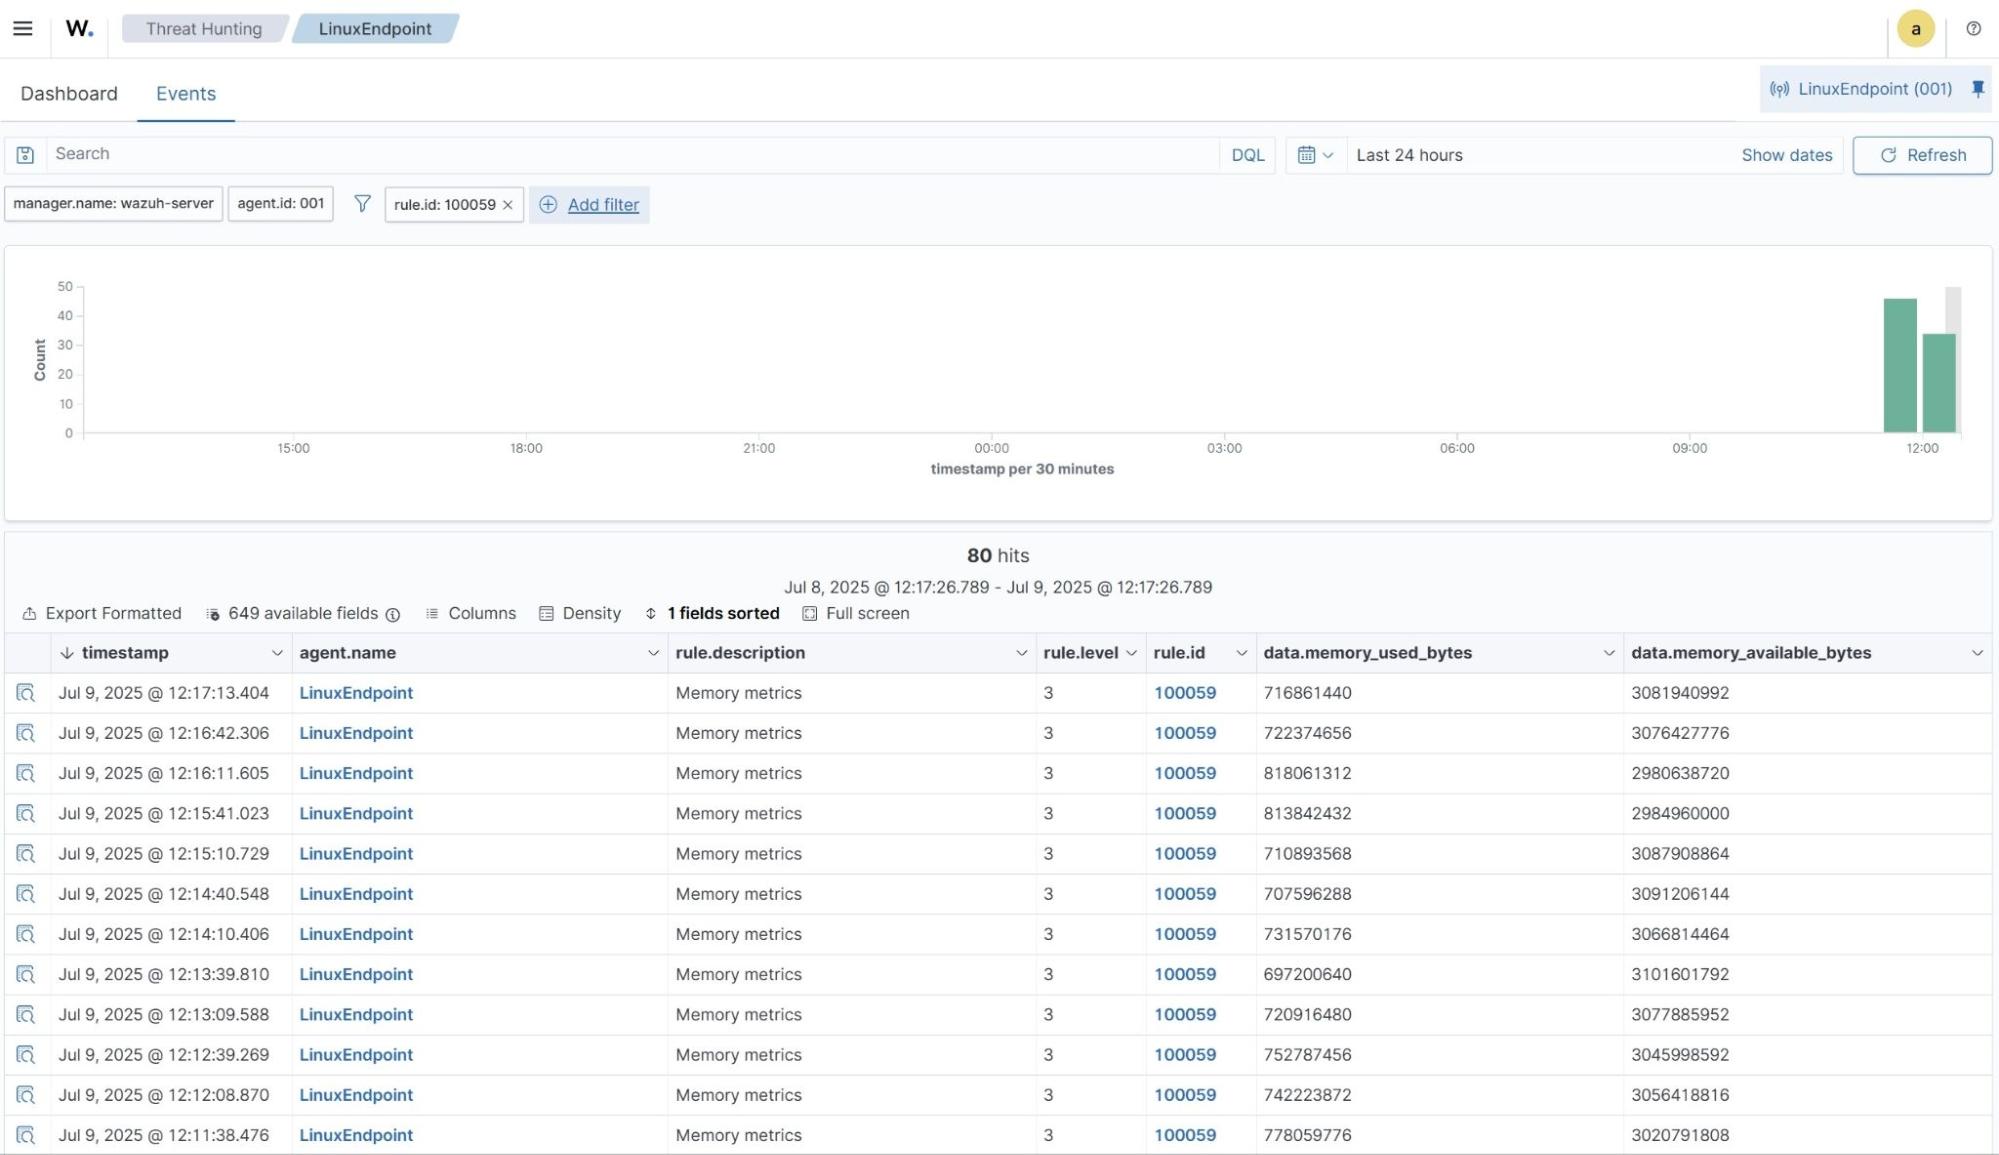
Memory usage
- Navigate to Threat intelligence > Threat Hunting and click the Events tab.
- Click + Available fields. Then search
memory_used_bytes,data.memory_available_bytesand toggle on. - Click + Add filter. Then filter by
rule.id. - In the Operator field, select
is. - Search and select
100059in the Values field. - Click Save.
Building custom visualizations and dashboards.
We can further improve the viewing of existing metrics with the use of custom dashboards, visualizations, and graphs. This presents a dynamic representation for monitoring system performance.
Modifying the Wazuh template
To use the alerts to create visualizations and dashboards, we need to set the data type of all custom fields to double. By default, the Wazuh indexer analyzes values from existing alerts as string data types. To change the default data type from string to double, perform the following:
Wazuh server
- Add the custom fields in the Wazuh template. Find the data section in the
/etc/filebeat/wazuh-template.jsonfile, and add the highlighted custom fields to the data properties section:
{
 "order": 0,
 "index_patterns": [
    "wazuh-alerts-4.x-*",
    "wazuh-archives-4.x-*"
  ],
 "settings": {
   ...
  },
 "mappings": {
    "dynamic_templates": [
      {
   ...
 "data": {
   "properties": {
         "1min_loadAverage": {
                 "type": "double"
               },
         "5mins_loadAverage": {
                 "type": "double"
               },
         "15mins_loadAverage": {
                 "type": "double"
               },
         "cpu_usage_%": {
                 "type": "double"
               },
         "memory_usage_%": {
                 "type": "double"
               },
         "memory_available_bytes": {
                 "type": "double"
               },
         "memory_used_bytes": {
                  "type":  "double"
               },
         "disk_used_bytes": {
                 "type": "double"
               },
         "disk_free_bytes": {
                 "type": "double"
               },
         "disk_usage_%": {
                 "type": "double"
               },
     "audit": {
       "properties": {
                 "acct": {
                     "type": "keyword"
- To apply the changes to the Wazuh template, run the command below:
# sudo filebeat setup -index-management
An expected output is shown below:
ILM policy and write alias loading not enabled.

Index setup finished.
Note
Modifying existing fields is not permitted in the Wazuh indexer. Once an index is created with some data fields, any changes to the existing fields on the live index are not allowed. Regardless, there is a walkaround; re-indexing.
Re-indexing data
Re-indexing data is the process of moving data from one index to another while possibly transforming the data in the process. This is done when there are changes to the data structure or mappings that require reorganizing or updating the index.
Wazuh dashboard
- Re-index your data. To use this technique, we will copy the data from the original index to a new index with updated schema definitions. Select the top left menu ☰ and navigate to Index Management -> Dev Tools to access the console. We use this console to run the necessary queries to re-index the existing data.
- Check existing indices by running the following command:
GET _cat/indices
The output below shows the names of the existing indices and corresponding creation dates:
green open wazuh-alerts-4.x-2025.07.12               uWXstYesQQCE_Zv6t4vbaA 3 0  351  0  1.1mb  1.1mb
green open wazuh-monitoring-2025.28w                 PTj_pXS5QyalPzp7UJwMMQ 1 0    1  0 18.7kb 18.7kb
green open .opensearch-observability                 LikXpYbOTZmY-exm-waVsQ 1 0    0  0   208b   208b
green open .plugins-ml-config                        0p_MthcvTH-nNA4aY80HTw 1 0    1  0    4kb    4kb
green open wazuh-statistics-2025.28w                 vQRVjEd7Sie4XRN9c8G0Kw 1 0    4  0 40.2kb 40.2kb
green open wazuh-states-vulnerabilities-wazuh-server _Km2kbdoSDysJppoib-9Hw 1 0 1518  0  1.5mb  1.5mb
green open .opendistro_security                      BeDMDi0OT7SITwyD9LMN8w 1 0   10  1 49.5kb 49.5kb
green open .kibana_1                                 Kn0L67jJR8S1K7jc8JgMGQ 1 0    5 13 91.8kb 91.8kb
- Retrieve data about the index from the Wazuh indexer using a GET request. This confirms that the added custom fields are of the
keywordtype. In Wazuh, indices are created with the formatwazuh-alerts-4.x-YYYY.MM.DD. Here, we will make use of the latest indexwazuh-alerts-4.x-2023.04.24. Ensure you replace this index value with that of your latest index:
GET /wazuh-alerts-4.x-2025.07.12
An expected output is shown below:
…
            },
            "id": {
              "type": "keyword"
            },
            "integration": {
              "type": "keyword"
            },
            "memory_available_bytes": {
              "type": "keyword"
            },
            "memory_usage_%": {
              "type": "keyword"
            },
            "memory_used_bytes": {
              "type": "keyword"
            },
            "netinfo": {
…
- Extract the data from your latest source index to the new destination index named
wazuh-alerts-4.x-backupwith the re-index API. Replace the source index with your own latest index name value.
POST _reindex
{
  "source": {
    "index": "wazuh-alerts-4.x-2025.07.12"
  },
  "dest": {
    "index": "wazuh-alerts-4.x-backup"
  }
}
The new index with the new schema will be ready to use once the re-indexing is complete. Wazuh indexer returns a 200 – OK status code along with a JSON response that provides details about the operation. These details include the number of documents that were reindexed, the time it took to complete the operation, and any errors or warnings that occurred during the process.
- Delete the old index. Replace the index name value with your own:
DELETE /wazuh-alerts-4.x-2025.07.12
- Re-index the data from the backup index
wazuh-alerts-4.x-backupto a new index with the original namewazuh-alerts-4.x-2023.04.24. This should be replaced with your own index name. This is done to apply our data type changes:
POST _reindex
{
  "source": {
    "index": "wazuh-alerts-4.x-backup"
  },
  "dest": {
    "index": "wazuh-alerts-4.x-2025.07.12"
  }
}
- Delete the earlier created backup index:
DELETE /wazuh-alerts-4.x-backup
- Verify the string data type for the custom fields has changed to the double data type in the updated index. Ensure you replace this index value with that of your own index:
GET /wazuh-alerts-4.x-2025.07.12
An expected output is shown below:
…
            },
            "integration": {
              "type": "keyword"
            },
            "memory_available_bytes": {
              "type": "double"
            },
            "memory_usage_%": {
              "type": "double"
            },
            "memory_used_bytes": {
              "type": "double"
            },
            "netinfo": {
…
- Refresh the field list by selecting the top left menu ☰ , navigate to Dashboard Management -> Index Patterns -> wazuh-alerts-* and clicking the refresh button on that index pattern page as shown below.
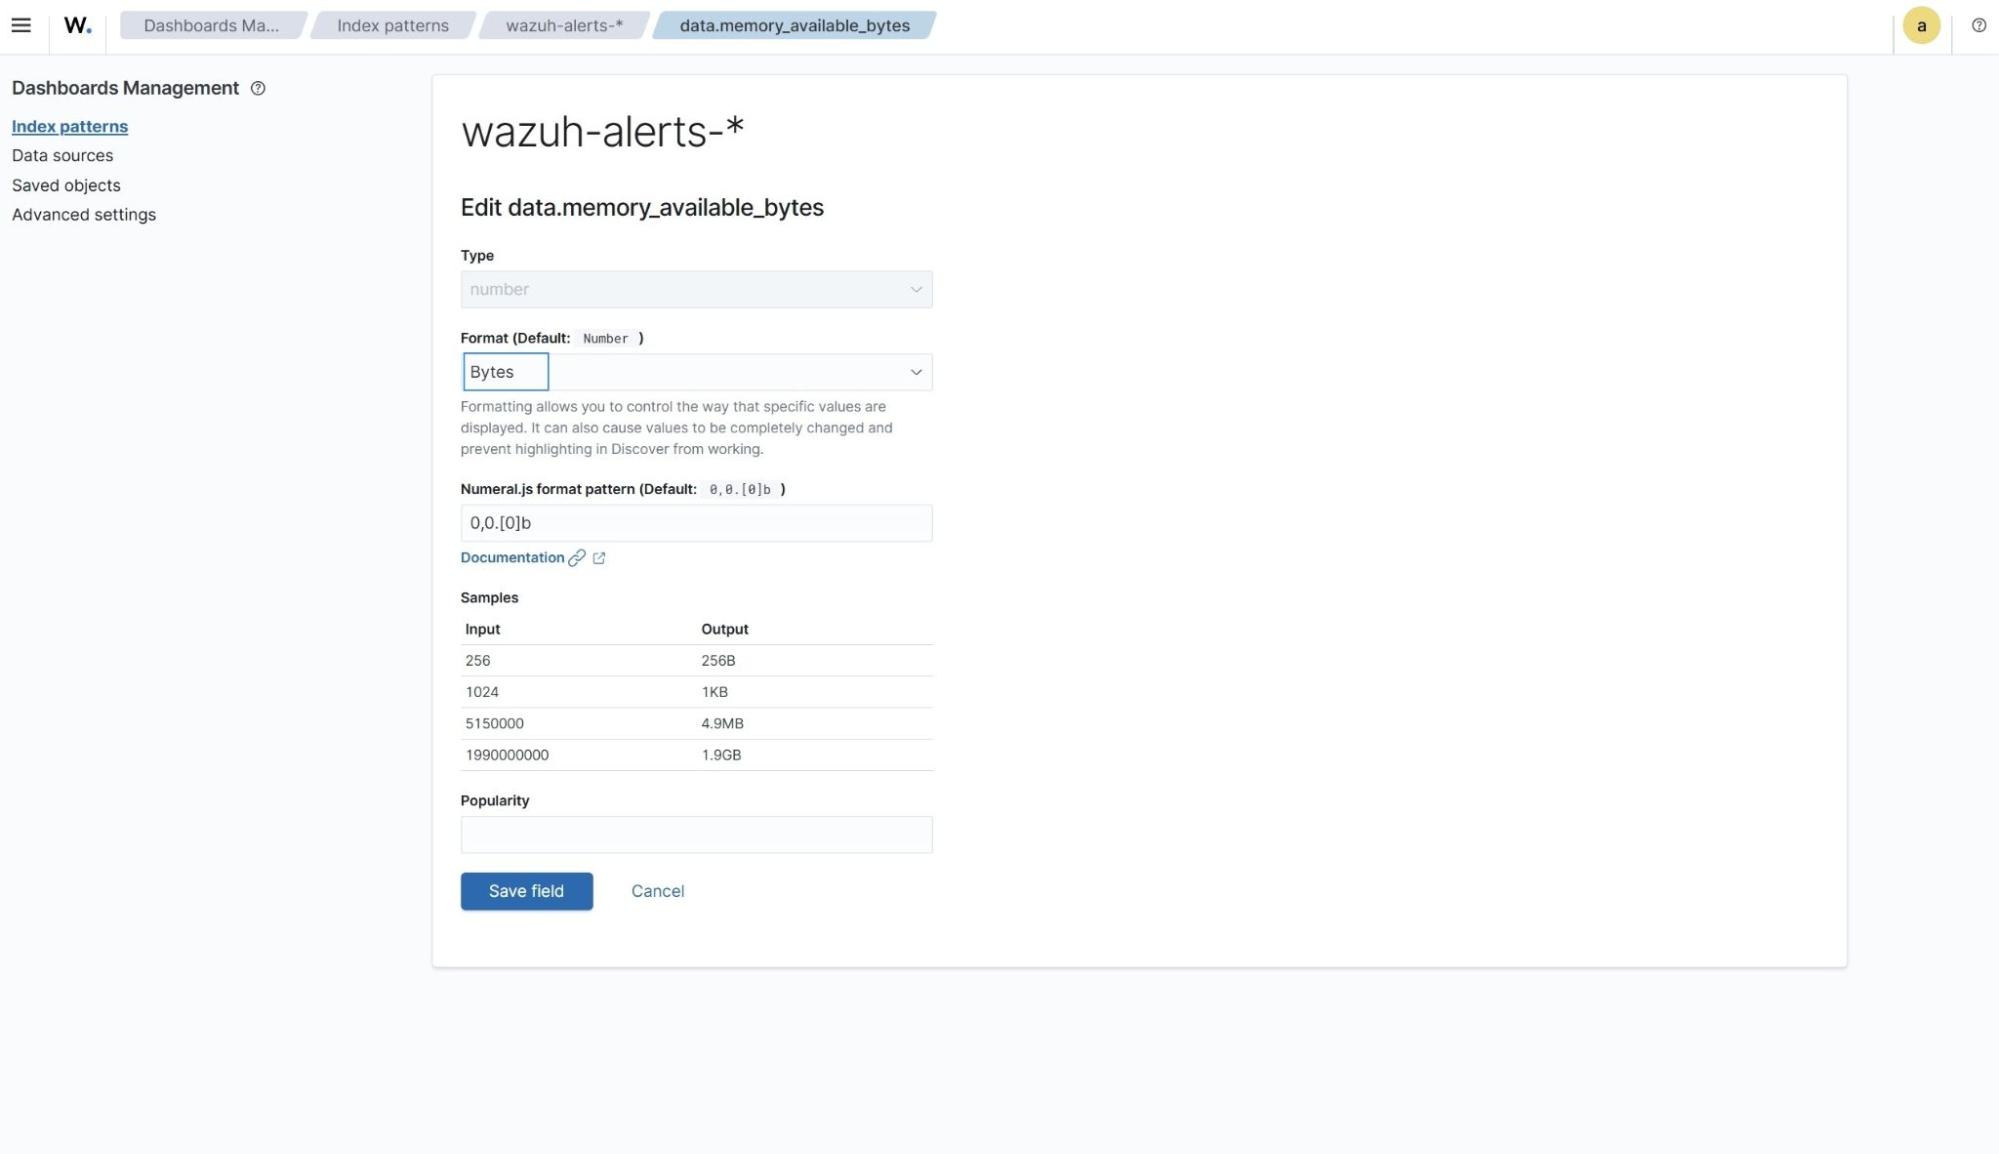
Changing data type formats
Considering some of the data being monitored represents disk storage and memory usage, representing this numerical data in bytes format would make it easier to understand and compare the values. To change the data format for specific fields from the default number to bytes, do the following:
Wazuh dashboard
1. Select the top left menu ☰ , navigate to Dashboard Management -> Index Patterns -> wazuh-alerts-*.
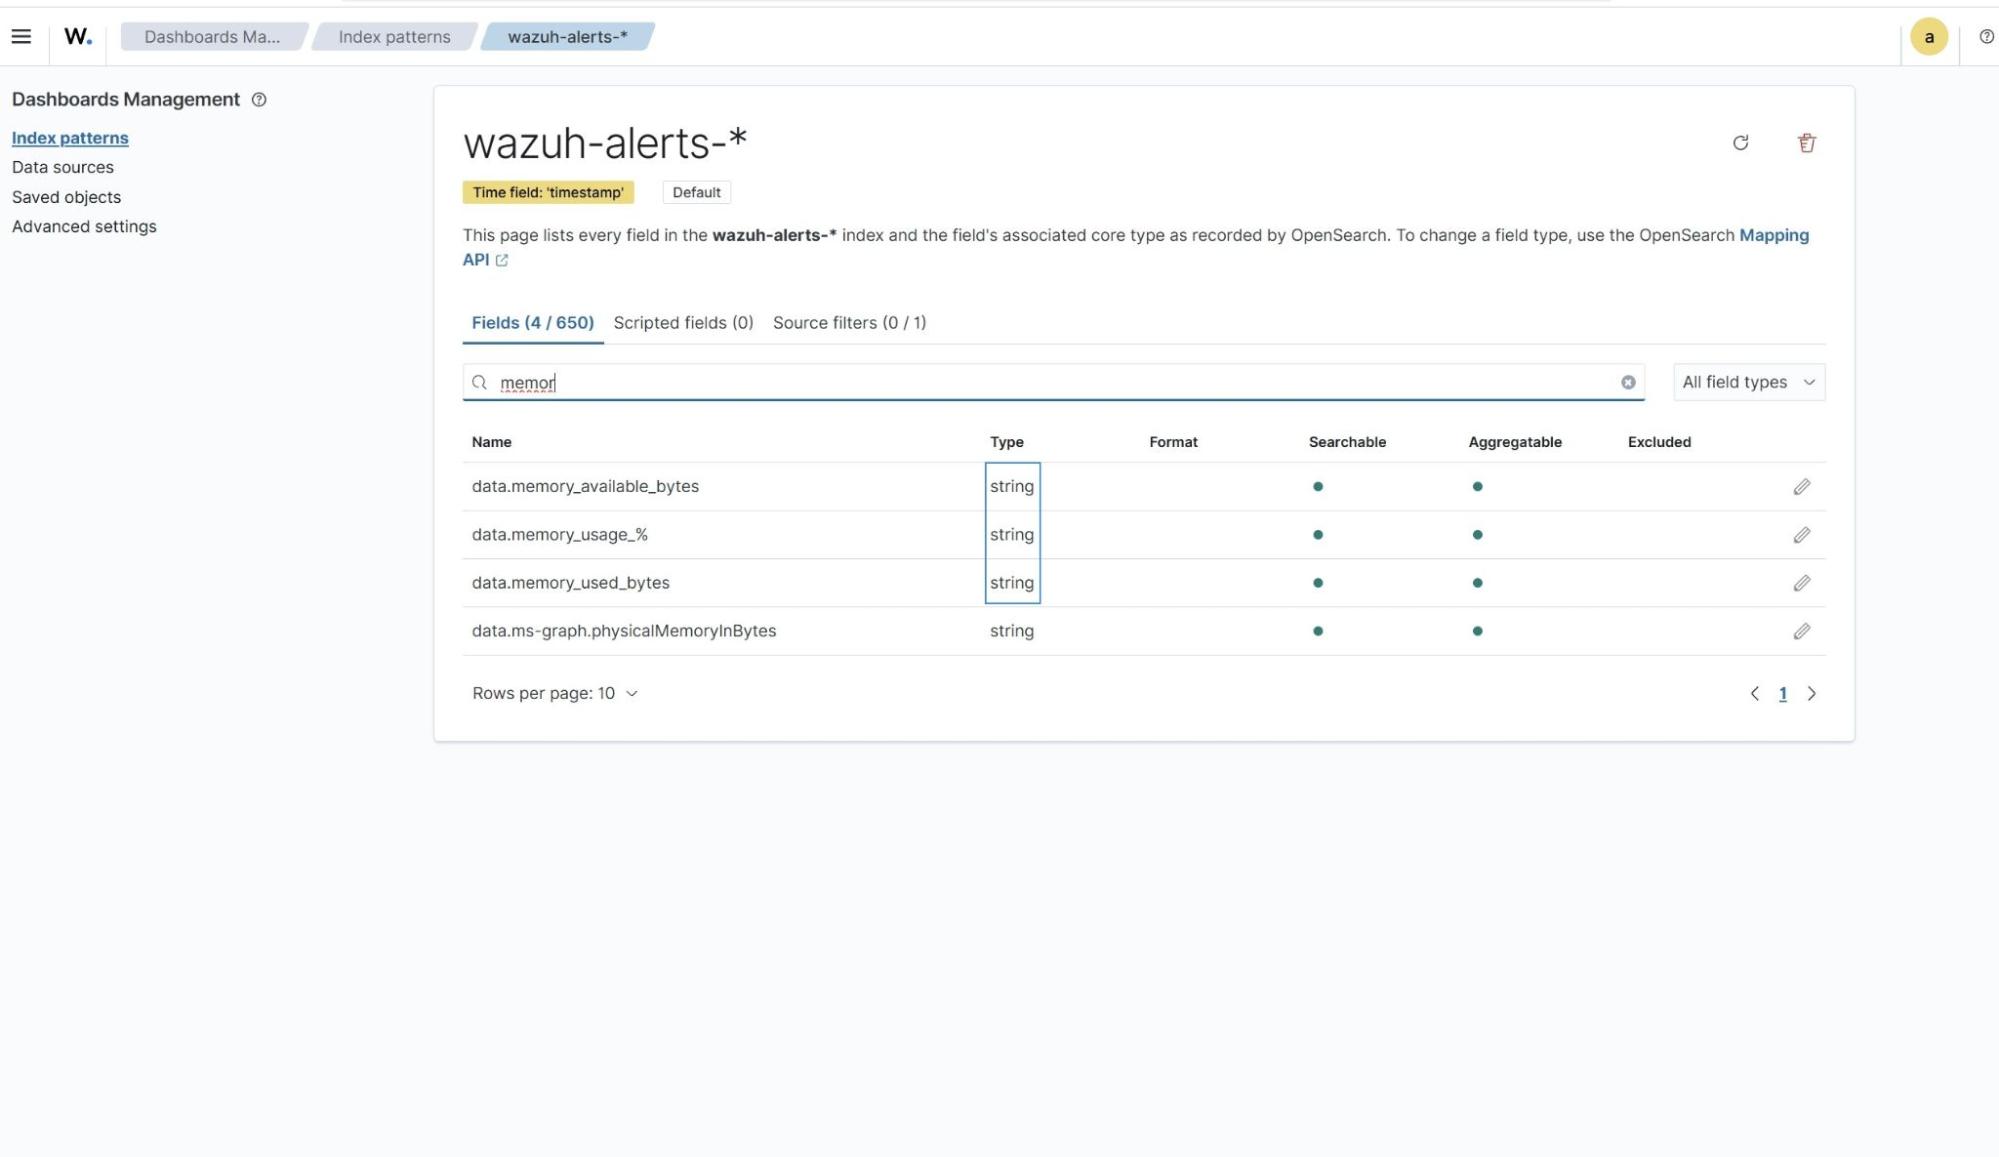
2. Search for the following custom fields individually; data.memory_available_bytes, data.memory_used_bytes, data.disk_free_bytes, data.disk_used_bytes, and click on the pencil icon highlighted to the right.
3. Change the default numerical format setting to the bytes format and save the field.
Creating custom visualizations
Wazuh dashboard
Select the top left menu ☰ and navigate to Explore -> Visualize -> Create new visualization.
We use the line visualization format and wazuh-alerts-* as the index pattern name. This will create a data tab where the required filters are specified. The image below shows a sample visualization using the settings above.
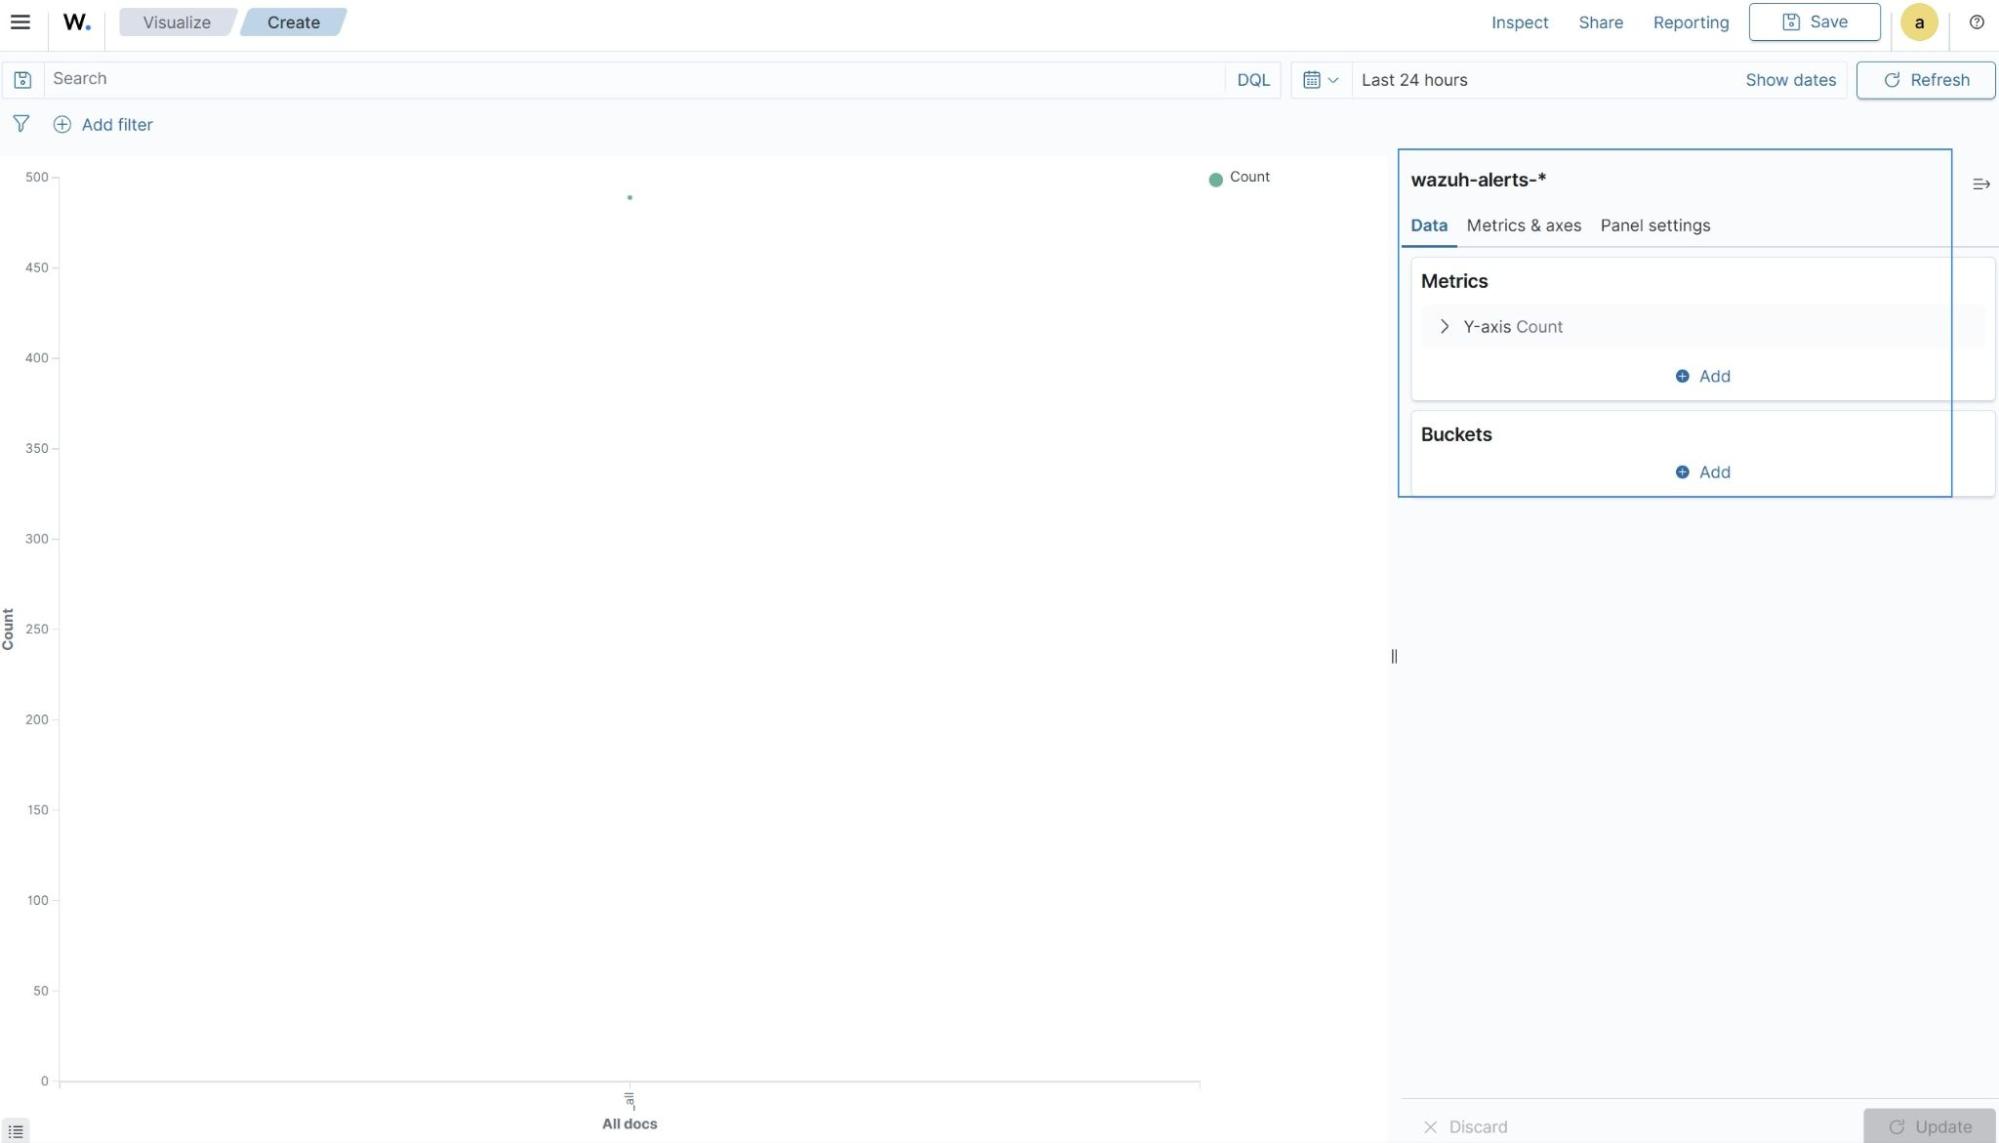
The Wazuh dashboard visualization builder contains two aggregation objects; metric and bucket aggregation as shown above:
- The metric aggregation contains the actual values of the metric to be calculated. It is typically represented on the Y-axis.
- The bucket aggregation determines how the data is segmented or grouped such as by date. It is typically represented on the X-axis.
Both the Y-axis and the X-axis are used to plot the data points on a visualization chart. Follow the instructions below to create individual visualizations for this blog post.
CPU usage visualization
a. From the Visualize tab, select the line visualization format and use wazuh-alerts-* as the index pattern name.
b. On the Y-axis, in Metrics, set the following values:
Aggregation = MaxField = data.cpu_usage_%Custom label = Cpu_Usage %
c. Add an X-axis in Buckets and set the following values:
Aggregation = Date HistogramField = timestampMinimum interval = Minute
d. Click the Update button.
e. Click the upper-right Save button and assign a title to save the visualization.
Load average visualization
a. From the Visualize tab, click Create visualization, select the line visualization format, and use wazuh-alerts-* as the index pattern name.
b. On the Y-axis of Metrics, set the following values:
Aggregation = MaxField = data.1min_loadAverageCustom label = 1 min load average
c. Add an additional Y-axis metric
Aggregation = MaxField = data.5min_loadAverageCustom label = 5 min load average
d. Add a final Y-axis metric
Aggregation = MaxField = data.15min_loadAverageCustom label = 15 min load average
e. Add an X-axis in Buckets and set the following values:
Aggregation = Date HistogramField = timestampMinimum interval = Minute
f. Click the Update button.
g. Click the upper-right Save button and assign a title to save the visualization.
Disk usage visualization
a. From the Visualize tab, click Create Visualization, select the line visualization format, and use wazuh-alerts-* as the index pattern name.
b. On the Y-axis of Metrics, set the following values:
Aggregation = MaxField = data.disk_usage_%Custom label = disk usage %
c. Add an X-axis in Buckets and set the following values:
Aggregation = Date HistogramField = timestampMinimum interval = Minute
d. Click the Update button.
e. Click the upper-right Save button and assign a title to save the visualization.
Memory usage visualization
a. From the Visualize tab, click Create Visualization, select the line visualization format, and use wazuh-alerts-* as the index pattern name.
b. On the Y-axis of Metrics data, set the following values:
Aggregation = MaxField = data.memory_usage_%Custom label = memory usage %
c. Add an X-axis in Bucket and set the following values:
Aggregation = Date HistogramField = timestampMinimum interval = Minute
d. Click the Update button.
e. Click the upper-right Save button and assign a title to save the visualization.
Memory size visualization
a. From the Visualize tab, click Create Visualization, select the area visualization format, and use wazuh-alerts-* as the index pattern name.
b. On the Y-axis of Metrics, set the following values:
Aggregation = MaxField = data.memory_available_bytesCustom label = memory available
c. Add an additional Y-axis metric
Aggregation = MaxField = data.memory_used_bytesCustom label = memory used
d. Add an X-axis in Bucket and set the following values:
Aggregation = Date HistogramField = timestampMinimum interval = Minute
e. Click the Update button.
f. Click the upper-right Save button and assign a title to save the visualization.
Disk table visualization
a. From the Visualize tab, click Create Visualization, select the data table visualization format and use wazuh-alerts-* as the index pattern name.
b. On Metric in Metrics, set the following values:
Aggregation = MaxField = data.disk_free_bytesCustom label = disk free
c. Add an additional metric
Aggregation = MaxField = data.disk_used_bytesCustom label = disk used
d. Click the Update button.
e. Click the upper-right Save button and assign a title to save the visualization.
Memory table visualization
a. From the Visualize tab, click Create Visualization, select the data table visualization format and use wazuh-alerts-* as the index pattern name.
b. On the Metric in Metrics data, set the following values:
Aggregation = MaxField = data.memory_available_bytesCustom label = memory available
c. Add an additional metric
Aggregation = MaxField = data.memory_used_bytesCustom label = memory used
d. Click the Update button.
e. Click the upper-right Save button and assign a title to save the visualization.
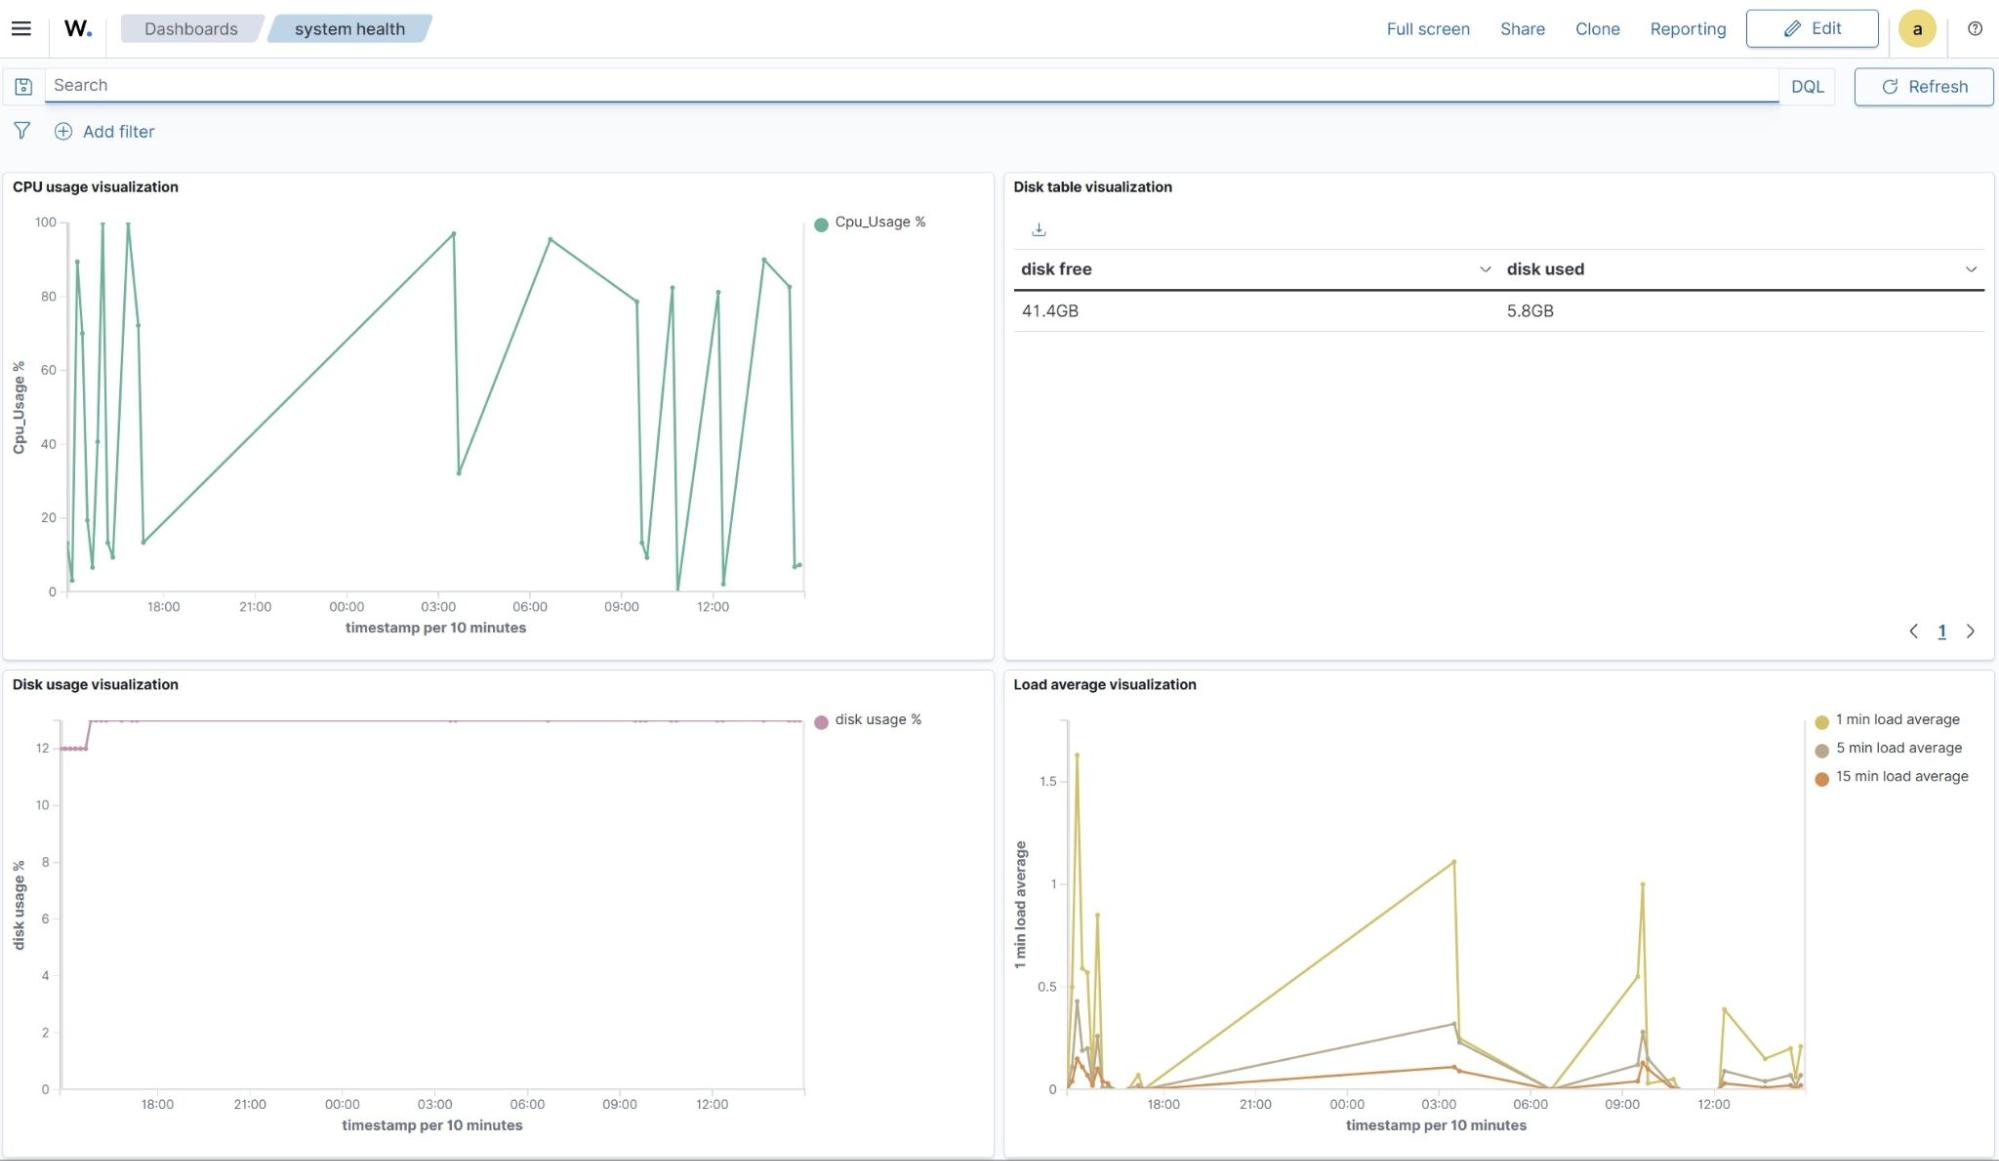
The GIF below shows sample visualizations that were created using the custom metrics:
Creating custom dashboard
Wazuh dashboard
1. Select the top left menu ☰ and navigate to Explore -> Dashboard -> Create new dashboard.
2. Click Add an existing and select the newly created visualizations to populate the dashboard.
3. Save the dashboard by selecting the save option on the top-right navigation bar.
The GIF below shows a sample dashboard containing the newly created visualizations.
Generate a report
Wazuh dashboard
1. Select the top left menu ☰ and navigate to Explore -> Dashboard -> Dashboard page.
2. Select a previously created dashboard.
3. Click Reporting on the navigation bar at the top right corner.
4. Select either the PDF or PNG format and download the report.
Conclusion
The performance of an application is negatively affected when system resources are insufficient. It is crucial to monitor system resources in order to stay ahead of performance regressions and contribute to the overall security monitoring of endpoints. In this article, we have demonstrated how to monitor Linux resources using Wazuh.