This guide covers how to recover Wazuh alerts in Elasticsearch/Splunk if the alerts were accidentally deleted or not indexed. It also explains how to index those alerts depending on the version and architecture of the environment.
You can identify this situation if your Discover section looks like this:

With the following setup, it will be easy to recover a large number of alerts without disrupting the normal operation of the environment. Once everything has been set up, no interaction is necessary.
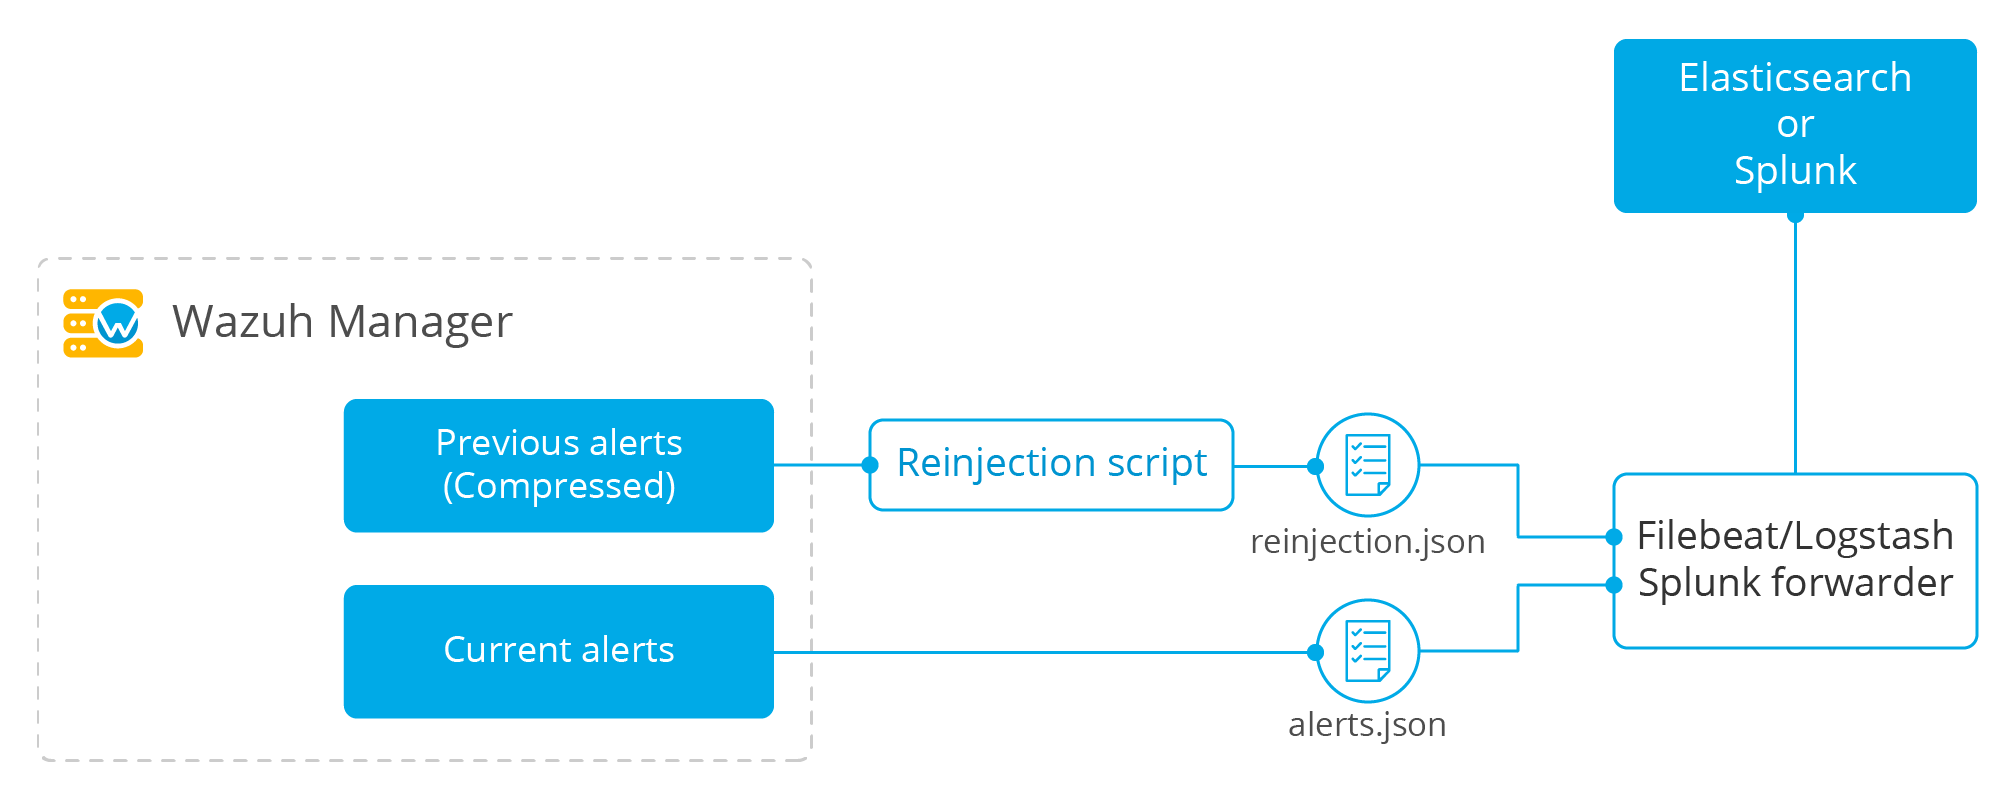
The Wazuh manager stores alerts from previous days in a compressed manner. A script will be used to uncompress non-indexed alerts into a new file. From there, the component forwarding the alerts will simultaneously index non-indexed alerts and alerts that are concurrently generated.

Setting up the recovery script
The following script will perform the creation of the recovery.json file, which will store the data that we will be indexing later.
#!/usr/bin/env python

import gzip
import time
import json
import argparse
import re
import os
from datetime import datetime
from datetime import timedelta


def log(msg):
    now_date = datetime.now().strftime('%Y-%m-%d %H:%M:%S')
    final_msg = "{0} wazuh-reinjection: {1}".format(now_date, msg)
    print(final_msg)
    if log_file:
        f_log.write(final_msg + "\n")


EPS_MAX = 400
wazuh_path = '/var/ossec/'
max_size=1
log_file = None

parser = argparse.ArgumentParser(description='Reinjection script')
parser.add_argument('-eps','--eps', metavar='eps', type=int, required = False, help='Events per second.')
parser.add_argument('-min', '--min_timestamp', metavar='min_timestamp', type=str, required = True, help='Min timestamp. Example: 2017-12-13T23:59:06')
parser.add_argument('-max', '--max_timestamp', metavar='max_timestamp', type=str, required = True, help='Max timestamp. Example: 2017-12-13T23:59:06')
parser.add_argument('-o', '--output_file', metavar='output_file', type=str, required = True, help='Output filename.')
parser.add_argument('-log', '--log_file', metavar='log_file', type=str, required = False, help='Logs output')
parser.add_argument('-w', '--wazuh_path', metavar='wazuh_path', type=str, required = False, help='Path to Wazuh. By default:/var/ossec/')
parser.add_argument('-sz', '--max_size', metavar='max_size', type=float, required = False, help='Max output file size in Gb. Default: 1Gb. Example: 2.5')

args = parser.parse_args()

if args.log_file:
    log_file = args.log_file
    f_log = open(log_file, 'a+')


if args.max_size:
    max_size = args.max_size

if args.wazuh_path:
    wazuh_path = args.wazuh_path

output_file = args.output_file

#Gb to bytes
max_bytes = int(max_size * 1024 * 1024 * 1024)

if (max_bytes <= 0):
    log("Error: Incorrect max_size")
    exit(1)

month_dict = ['Null','Jan','Feb','Mar','Apr', 'May', 'Jun', 'Jul', 'Aug', 'Sep', 'Oct', 'Nov','Dec']

if args.eps:
    EPS_MAX = args.eps

if EPS_MAX < 0:
    log("Error: incorrect EPS")
    exit(1)

min_date = re.search('(\d\d\d\d)-(\d\d)-(\d\d)T\d\d:\d\d:\d\d', args.min_timestamp)
if min_date:
    min_year = int(min_date.group(1))
    min_month = int(min_date.group(2))
    min_day = int(min_date.group(3))
else:
    log("Error: Incorrect min timestamp")
    exit(1)

max_date = re.search('(\d\d\d\d)-(\d\d)-(\d\d)T\d\d:\d\d:\d\d', args.max_timestamp)
if max_date:
    max_year = int(max_date.group(1))
    max_month = int(max_date.group(2))
    max_day = int(max_date.group(3))
else:
    log("Error: Incorrect max timestamp")
    exit(1)

# Converting timestamp args to datetime
min_timestamp = datetime.strptime(args.min_timestamp, '%Y-%m-%dT%H:%M:%S')
max_timestamp = datetime.strptime(args.max_timestamp, '%Y-%m-%dT%H:%M:%S')

chunk = 0
written_alerts = 0
trimmed_alerts = open(output_file, 'w')

max_time=datetime(max_year, max_month, max_day)
current_time=datetime(min_year, min_month, min_day)

while current_time <= max_time:
    alert_file = "{0}logs/alerts/{1}/{2}/ossec-alerts-{3:02}.json.gz".format(wazuh_path,current_time.year,month_dict[current_time.month],current_time.day)

    if os.path.exists(alert_file):
        daily_alerts = 0
        compressed_alerts = gzip.open(alert_file, 'r')
        log("Reading file: "+ alert_file)
        for line in compressed_alerts:
            # Transform line to json object
            try:
                line_json = json.loads(line.decode("utf-8", "replace"))

                # Remove unnecessary part of the timestamp
                string_timestamp = line_json['timestamp'][:19]

                # Ensure timestamp integrity
                while len(line_json['timestamp'].split("+")[0]) < 23:
                    line_json['timestamp'] = line_json['timestamp'][:20] + "0" + line_json['timestamp'][20:]

                # Get the timestamp readable
                event_date = datetime.strptime(string_timestamp, '%Y-%m-%dT%H:%M:%S')

                # Check the timestamp belongs to the selected range
                if (event_date <= max_timestamp and event_date >= min_timestamp):
                    chunk+=1
                    trimmed_alerts.write(json.dumps(line_json))
                    trimmed_alerts.write("\n")
                    trimmed_alerts.flush()
                    daily_alerts += 1
                    if chunk >= EPS_MAX:
                        chunk = 0
                        time.sleep(2)
                    if os.path.getsize(output_file) >= max_bytes:
                        trimmed_alerts.close()
                        log("Output file reached max size, setting it to zero and restarting")
                        time.sleep(EPS_MAX/100)
                        trimmed_alerts = open(output_file, 'w')

            except ValueError as e:
                print("Oops! Something went wrong reading: {}".format(line))
                print("This is the error: {}".format(str(e)))

        compressed_alerts.close()
        log("Extracted {0} alerts from day {1}-{2}-{3}".format(daily_alerts,current_time.day,month_dict[current_time.month],current_time.year))
    else:
        log("Couldn't find file {}".format(alert_file))

    #Move to next file
    current_time += timedelta(days=1)

trimmed_alerts.close()
Determine the recovery parameters
The operability of the script is determined by the following characteristics:
- Events per second (EPS). The limit of EPS in the recovery process will depend on the cluster workload. Normally, the process can run at the same time as the current indexation flow, but configuring an excessive number of EPS may affect the cluster performance.
- Disk space. The recovery process will uncompress the alerts into a file periodically rotated depending on its size. The output size limit can be configured to prevent taking up too much disk space during the recovery, but setting up a small rotation limit will slow down the process.
Script usage:
usage: recovery.py [-h] [-eps eps] -min min_timestamp -max max_timestamp -o
                      output_file [-log log_file] [-w wazuh_path]
                      [-sz max_size]

  -eps eps, --eps eps   Events per second. Default: 400
  -min min_timestamp, --min_timestamp min_timestamp
                        Min timestamp. Example: 2019-11-13T08:42:17
  -max max_timestamp, --max_timestamp max_timestamp
                        Max timestamp. Example: 2019-11-13T23:59:06
  -o output_file, --output_file output_file
                        Alerts output file.
  -log log_file, --log_file log_file
                        Logs output.
  -w wazuh_path, --wazuh_path wazuh_path
                        Path to Wazuh. By default:/var/ossec/
  -sz max_size, --max_size max_size
                        Max output file size in Gb. Default: 1Gb. Example: 2.5
We recommend using the command nohup to execute the script in the background and keep it running after the session is closed.
Usage example:
nohup ./recovery.py -eps 500 -min 2019-07-21T13:59:30 -max 2019-07-24T22:00:00 -o /tmp/recovery.json -log ./recovery.log -sz 2.5 &
Use the -min and -max options to set the range of alerts you want to index based on their timestamp.
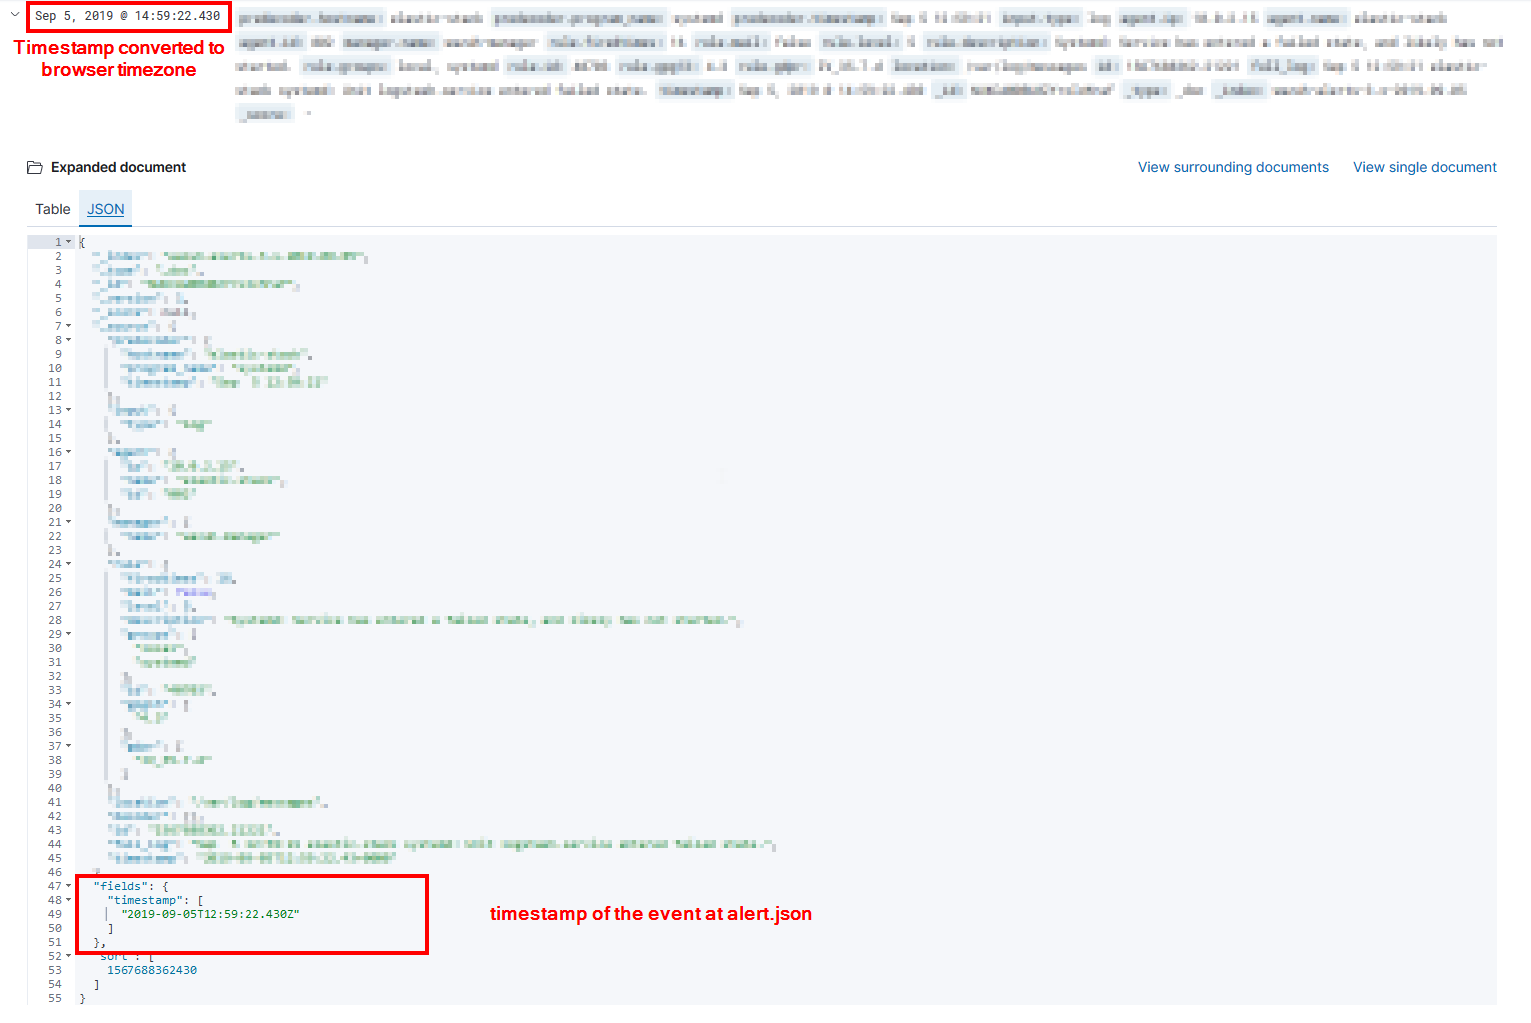
In Kibana, you can extract the exact timestamp by opening the alert in JSON format in the Discover tab and looking at the fields.timestamp field. (fields.@timestamp for 6.x)

Recovery in Elasticsearch
Using Elastic 7.x
In the Elastic 7.x version, Logstash is no longer required for indexing data.
We will be using the Wazuh Filebeat module, which takes care of indexing every alert in its corresponding index. To do so, configure the Wazuh Filebeat module as follows:
filebeat.modules:
  - module: wazuh
    alerts:
      enabled: true
      input:
        paths:
          - /var/ossec/logs/alerts/alerts.json
          - /tmp/recovery.json
Restart Filebeat to apply the changes.
Using older versions of Elasticsearch
In Elastic 6.x, or an earlier version, Logstash is required for indexing data into Elasticsearch, which can result in two different architectures:
- Single Host Architecture (Logstash input)
For a single host architecture, configure Logstash to read the file where the alerts were previously stored:
input {
   file {
       type => "wazuh-alerts"
       path => "/tmp/recovery.json"
       codec => "json"
   }
}
Restart Logstash to apply the changes.
- Distributed Architecture (Filebeat input)
For a distributed architecture, we will use Filebeat to collect the events and send them to Logstash.
In this case, we will use the Filebeat log input configured as follows:
filebeat:
 prospectors:
  - type: log
    paths:
     - "/var/ossec/logs/alerts/alerts.json"
     - "/tmp/recovery.json"
    document_type: json
    json.message_key: log
    json.keys_under_root: true
    json.overwrite_keys: true
Restart Filebeat to apply the changes.
Recovery in Splunk
Configuring the recovery input
The first step is to configure the input in the Splunk Forwarder to index data from the created file:
[monitor:///var/ossec/logs/alerts/alerts.json]
disabled = 0
host = my_hostname
index = wazuh
sourcetype = wazuh

[monitor:///tmp/recovery.json]
disabled = 0
host = my_hostname
index = wazuh
sourcetype = wazuh
Restart the Splunk forwarder to apply the changes.
Conclusion
Using this approach, a large number of alerts can be recovered from previous days without any further action needed. Don’t forget to use an appropriate EPS parameter in the script to avoid generating alters in connection with the normal performance of your indexer.
Useful links
If you have any questions about how to recover Wazuh alerts, don’t hesitate to check out our documentation to learn more about Wazuh. You can also join our Slack #community channel and our mailing list where our team and other users will help you with your questions.