Since Wazuh v3.1.0, a new capability allows the Wazuh manager to run external commands and scripts on agents, setting them up remotely. This article shows how this module works (scheduling remote commands) and presents a use case which takes into account the possibilities it offers.
The Command module
As stated above, this module runs defined commands periodically in both the manager and agents. It can be used for the following purposes:
- Defining actions in agents programmatically, for example, to restart a particular service or run more complex scripts.
- Letting daemons run indefinitely.
- Monitoring the output of commands and scripts, processing the output on the manager side and triggering alerts based on that information.
Launching remote commands may sound a little bit risky, so below we describe the main security measures to avoid the misuse of this module.
Checksum verification
Since Wazuh v3.6.0, every executed binary can be previously validated with MD5, SHA1, and SHA256 predefined hashes. This procedure ensures that the launched binary has not been replaced and is the same as the manager expects.
Encrypted communication
Every message in the manager-agent channel is Blowfish encrypted. For Wazuh v3.5.0, AES encryption support is added as the default, so every command output from the agents is sent by a secure channel to the manager.
Explicit consent of agents
The command module can be set up in two different ways. It may be set up locally on each agent and manager, or remotely by the shared configuration support.
Setting up remote commands in the shared agent configuration must be enabled explicitly for each agent. Otherwise, that agent will ignore the command to run.
This parameter is defined as an internal option, so it is only necessary to enable this flag by adding the following line to the file etc/local_internal_options.conf in the agent:
wazuh_command.remote_commands=1
How it works
Remote commands work for Unix and Windows agents in the same way. Only two steps are needed to set up a remote command:
- Enable the flag which allows the agent to run the commands provided by the manager.
- Include the necessary configuration block in the
agent.conffile of the group to which the agent belongs.
A standard command configuration block looks like this:
<wodle name="command">
  <disabled>no</disabled>
  <tag>test</tag>
  <command>/bin/bash /root/script.sh</command>
  <interval>1d</interval>
  <ignore_output>no</ignore_output>
  <run_on_start>yes</run_on_start>
  <timeout>0</timeout>
  <verify_sha1>da39a3ee5e6b4b0d3255bfef95601890afd80709</verify_sha1>
  <verify_sha256>292a188e498caea5c5fbfb0beca413c980e7a5edf40d47cf70e1dbc33e4f395e</verify_sha256>
</wodle>
The most relevant fields are the following ones:
- tag: It identifies the command. More than one command can be defined, independent of the others.
- command: We assume that it has to include a valid command.
- ignore_output: When this field is set to
no, the command output is forwarded to the manager. This can be useful to define rules based on that output. Otherwise, the command output is ignored.
You can find more information about available fields in the Command reference section of the Wazuh documentation.
Use case: Monitoring the disk usage on your agents
In this section, we will give a step-by-step example of how to use this module. Specifically, we will monitor the disk usage in one agent periodically. For this guide, both the manager and agent deployed are in Wazuh v3.6.1.
Agent side
First of all, we must enable remote commands if we want to push the configuration remotely from the manager:
# echo "wazuh_command.remote_commands=1" >> /var/ossec/etc/local_internal_options.conf
# systemctl restart wazuh-agent
Using the etc/local_internal_options.conf file, the internal configuration is not overwritten on upgrades.
Whenever we want to run a specific script, like in this case, we should ensure the script has execution permissions, and check its location to set it up in the configuration. A simple script has been written for this example:
#!/bin/bash

df -h | while IFS= read -r line;
do
  echo "disk-usage: "$line
done
It just reads the df -h command and returns the output line by line adding a header. Later will see the goal of this script. Scripts can also be received from the manager as the shared configuration, but they lose the execution permissions and the owner and group should be switched to ossec:ossec.
Finally, we get the checksums that we want to verify for the binary to run. In this case, we will run the bash binary.
# md5sum /bin/bash
450d8f0ce1271aa72529ad58af2ed150  /bin/bash
# sha1sum /bin/bash
97cc6260454a7243b55c46f1e39758f2419e6d38  /bin/bash
# sha256sum /bin/bash
724a10acf512747b3cc0657ec40d54708edf4bdd15b5115dd63c9a049efd1bc3  /bin/bash
We will verify the three possible hashes by including them in the module configuration. However, this is an optional step.
Manager side
On the manager, we have created the decoder and rules necessary to process the expected output, which looks like the following:
disk-usage: /dev/sda3 18G 11G 6,9G 62% /
disk-usage: devtmpfs 1,9G 0 1,9G 0% /dev
disk-usage: tmpfs 1,9G 0 1,9G 0% /dev/shm
disk-usage: tmpfs 1,9G 9,1M 1,9G 1% /run
disk-usage: tmpfs 1,9G 0 1,9G 0% /sys/fs/cgroup
disk-usage: /dev/sda1 297M 204M 94M 84% /boot
disk-usage: tmpfs 378M 0 378M 0% /run/user/0
The decoder will prematch the defined header and store the desired fields dynamically.
<decoder name="disk-usage">
    <prematch>^disk-usage: </prematch>
    <regex offset="after_prematch">(\S+)\s*\t*(\S+)\s*\t*(\S+)\s*\t*(\S+)\s*\t*(\S+)%\s*\t*(\S+)</regex>
    <order>filesystem, size, used, available, usage, mnt</order>
</decoder>
The header is a little trick to identify the events coming in from this module to avoid matching any other decoder by error.
We also define the corresponding rules based on what we want to monitor in these fields. For this guide, we classify events based on the disk usage of each filesystem.
<group name="local,monitor,stats">

  <rule id="100001" level="0">
    <decoded_as>disk-usage</decoded_as>
    <description>Disk-usage monitoring rules.</description>
  </rule>

  <rule id="100002" level="3">
    <if_sid>100001</if_sid>
    <field name="usage">^6\d|^5\d</field>
    <description>Filesystem $(filesystem) over 50% ($(usage)%).</description>
  </rule>

  <rule id="100003" level="5">
    <if_sid>100001</if_sid>
    <field name="usage">^7\d</field>
    <description>Filesystem $(filesystem) over 70% ($(usage)%).</description>
  </rule>

  <rule id="100004" level="7">
    <if_sid>100001</if_sid>
    <field name="usage">^9\d|^8\d</field>
    <description>Filesystem $(filesystem) over 80% ($(usage)%).</description>
  </rule>

  <rule id="100005" level="9">
    <if_sid>100001</if_sid>
    <field name="usage">100</field>
    <description>No space left at filesystem $(filesystem).</description>
  </rule>

</group>
This can be as complex as the user wants it to be. Notice that there are two files for creating custom rules and decoders which exist by default in the etc/decoders and etc/rules directories. By setting new rules and decoders on those folders, they remain when the Wazuh ruleset is upgraded.
The next step is to set up the shared configuration, by editing the file etc/shared/agent.conf with the command data and options.
<wodle name="command">
  <disabled>no</disabled>
  <tag>disk-usage</tag>
  <command>/bin/bash /var/ossec/etc/shared/disk-usage.sh</command>
  <interval>1h</interval>
  <run_on_start>yes</run_on_start>
  <timeout>10</timeout>
  <verify_md5>450d8f0ce1271aa72529ad58af2ed150</verify_md5>
  <verify_sha1>97cc6260454a7243b55c46f1e39758f2419e6d38</verify_sha1>
  <verify_sha256>724a10acf512747b3cc0657ec40d54708edf4bdd15b5115dd63c9a049efd1bc3</verify_sha256>
</wodle>
Results
After the configuration steps are completed, restart the manager to push the shared configuration to the agents of that group. When the agent receives the new shared files, it restarts automatically, and the Command module starts to work. From that moment, the agent will report its disk stats every hour, and we receive alerts like the following one when the usage reaches the specified value:
** Alert 1537516711.2559: - local,monitor,stats
2018 Sep 21 00:58:31 (centos7) 192.168.1.135->command_disk-usage
Rule: 100004 (level 7) -> 'Filesystem /dev/sda1 over 80% (84%).'
disk-usage: /dev/sda1 297M 204M 94M 84% /boot
filesystem: /dev/sda1
size: 297M
used: 204M
available: 94M
usage: 84
mnt: /boot
These alerts can be also accessed by the Wazuh APP, here we can see what it looks like:
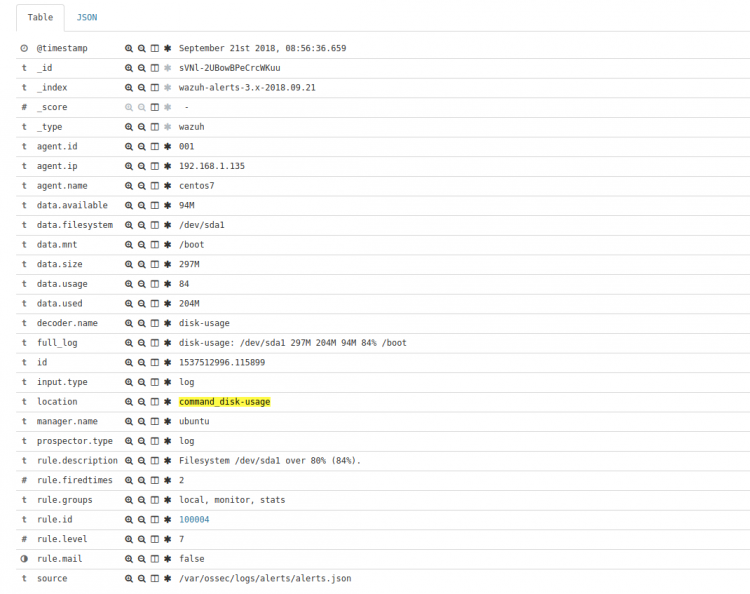
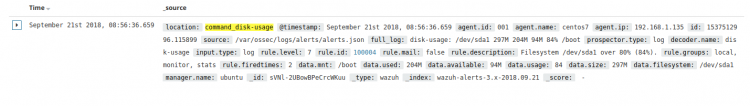
If you have any questions about this, don’t hesitate to check out our documentation to learn more about Wazuh. You can also join our Slack #community channel and our mailing list where our team and other users will help you with your questions.