The Wazuh app for Kibana offers a modern, useful web interface that allows you to find and view your alerts in a more user-friendly way. It provides powerful search tools for finding specific alerts about certain events in any given time frame.
This post aims to show you how to use these tools to make better use of the app’s capabilities, thanks to the integration with the Elastic Stack.
These examples use Kibana v7.1.0 and our latest release, Wazuh v3.9.1.
Interacting with the visualizations
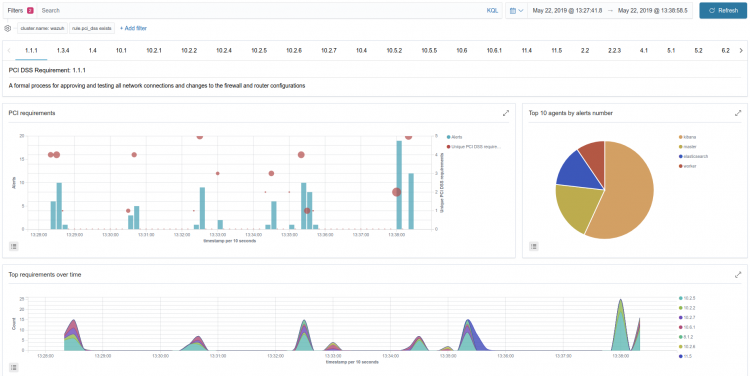
The visualizations are located in many parts of the app. A filter is used to group numerous alerts into different categories to give them meaning, and then, they are turned into tables, pie charts, metrics, and so on.
The majority of the visualizations in the app are interactive, so you can click on them to narrow down the search to more specific alert fields or to a specific time frame by click-&-dragging to select a time period. Below are some of the things that you can do:
- Click on a pie chart section.
- Select a range on a bar chart.
- Select a line peak on the histogram.
Several visualizations require adding multiple filters, and the interface will ask you to apply the changes.
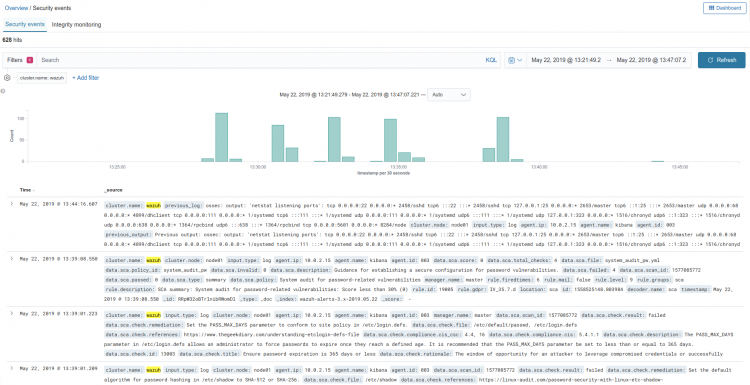
Discover panel
The Discover panel includes all the features of Kibana’s Discover plugin fully integrated within the Wazuh app. You can list alerts, open them to see more details, and click on the fields on the left side of the window to add columns for a quick value comparison between alerts. The filters that you apply between this panel and the Dashboard panel will remain untouched within the same section, making it easier to look for specific events.
And, if you just need to list your alerts without entering a specific app section, you can always open the Discover page on the top navbar.
Here’s one cool trick: Clicking on the rule.id value on the alert details will redirect you to the Ruleset tab where you can find more relevant information about the triggered event.
Getting to know the search bar
The app provides a search bar, available on almost every tab from the “Overview” and “Agents” sections. This is the main component that you’ll use to search for alerts.
In the top right corner, you can find buttons to enable the Auto-refresh feature and change the time range.
- The Auto-refresh button reloads the tab periodically in as many seconds as you specify, and it will bring new data if there are new events generated by Wazuh and indexed by Elasticsearch.
- The time range picker helps you shorten or lengthen the period of time. This will determine how many alerts the app is going to use to show your results and statistics.
Lucene syntax
As a default, you can type your search using the Lucene Query Syntax, which has been used in Kibana for a long time. You can simply type a text string to perform a simple text search, and it will look for matching criteria in your alerts. But, let’s try to be more specific using queries that are a little bit more complex.
- Using the
key:valuenotation, you can search for values in specific alert fields, such asagent.nameordata.vulnerability.severity. - A value range can be defined in the previous notation, so for example,
agent.id:[001 TO 003]. - The well-known logical operators (
AND,OR,NOT) can be used too on this search bar. Keep in mind thatagent.id:001 AND agent.id:002won’t show alerts from both agent IDs because Kibana is trying to look for alerts that contain both values, which is not possible. Instead, use theORlogical operator, which will search for alerts with one or both of those values. - Wildcards are also supported, so you can type
agent.name:wazuh-*to search all agent names that start withwazuh-.
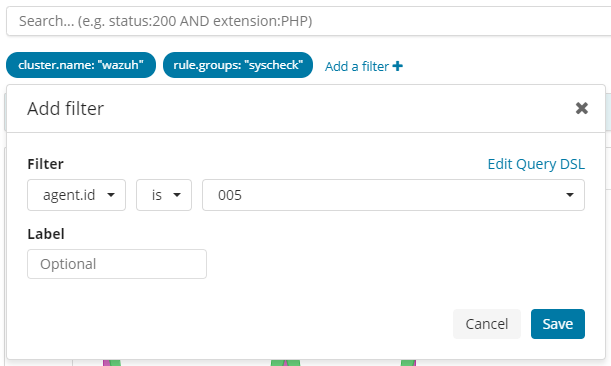
These are only some of the many examples that you can use with the Lucene syntax. If you’re not comfortable enough writing the Lucene syntax, you can just click on the “Add filter” button to open an interactive wizard that will do the work for you!
Kuery syntax
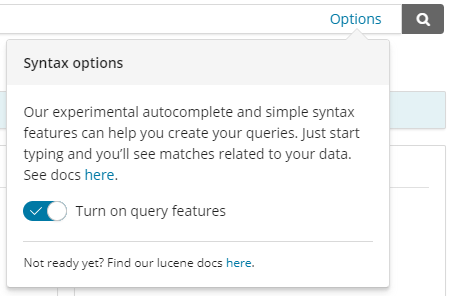
The latest versions of Kibana includes a brand new experimental query syntax named Kuery, and the Elastic team keeps introducing new features. The main highlight of this new syntax is that it’s much simpler than the previous one which has made things a lot easier.
The syntax is similar to Lucene, and you can enable an autocomplete panel that will appear as soon as you start typing. To activate the experimental features, just click on the button on the right side of the search bar and click on the toggle. Whenever you start typing, the autocomplete will start helping you to find the search query that you want, providing you with suggestions for logical operators and more.
I hope this article has helped to improve your user experience with the Wazuh app for Kibana. As always, we’d like to hear your suggestions or comments. We have a mailing list and a Slack channel that you can join. Also, you can go to the app repository to open new issues or open a pull request if you want to collaborate.