Security observability allows security teams to gain comprehensive visibility into the security posture of systems, applications, and networks by collecting and analyzing telemetry from various sources. These data sources, including logs, metrics, and traces, provide deep insights into diagnosing system issues and investigating security incidents. They also help to detect and respond to potential threats in real-time. Organizations require a depth of visibility to manage risks effectively.
Tetragon and Wazuh complement each other by bridging deep kernel-level visibility with broad security analytics in Linux endpoints. Tetragon uses eBPF (Extended Berkeley Packet Filter) to provide real-time monitoring and enforcement at the kernel level. Wazuh, as a comprehensive SIEM and XDR platform, aggregates and correlates security data to provide a holistic view of security events. Together, they enhance an organization’s ability to detect threats, assess risks, and respond to incidents effectively.
This blog post demonstrates how the integration of Wazuh and Tetragon provides kernel-level security and observability, thereby strengthening the overall security posture of organizations.
Infrastructure
We use the following infrastructure to demonstrate the integration of Wazuh and Tetragon for security observability.
- A pre-built, ready-to-use Wazuh OVA 4.13.0 hosting the Wazuh central components, including the Wazuh server, Wazuh indexer, and Wazuh dashboard. Follow the Virtual Machine (OVA) – Installation guide to download and set up the Wazuh virtual machine.
- An Ubuntu 24.04 endpoint with Wazuh agent 4.13.0 installed and enrolled to the Wazuh server.
Configuration
This section shows how to configure the Ubuntu endpoint for monitoring and data collection. Additionally, it covers how to set up the Wazuh server with custom decoders and rules to analyze the data received from the monitored Ubuntu endpoint.
Ubuntu endpoint
This endpoint is monitored with Tetragon to gain valuable security observability insights, and the Wazuh agent collects and forwards the logs to the Wazuh server for analysis.
Perform the following steps to install Tetragon and forward its logs to the Wazuh server.
- Download the Tetragon binary tarball using the
curlcommand:
# curl -LO https://github.com/cilium/tetragon/releases/download/v1.5.0/tetragon-v1.5.0-amd64.tar.gz
- Extract the
tetragon-v1.5.0-amd64.tar.gzarchive, and run theinstall.shscript to install Tetragon:
# tar -xvf tetragon-v1.5.0-amd64.tar.gz && cd tetragon-v1.5.0-amd64/
# ./install.sh
- Verify that Tetragon is installed and running:
# systemctl status tetragon
- Append the configuration below to the
/var/ossec/etc/ossec.conffile to monitor and forward Tetragon events to the Wazuh server for analysis:
<ossec_config>
  <localfile>
    <log_format>json</log_format>
    <location>/var/log/tetragon/tetragon.log</location>
    <out_format>$(timestamp) $(hostname) tetragon-events: $(log)</out_format>
  </localfile>
</ossec_config>
By default, Tetragon logs events in JSON format. However, we use the <out_format> option to prepend the log with extra information for easy identification during analysis. The logs are stored in the /var/log/tetragon/tetragon.log file, and the logs are rotated within the /var/log/tetragon/ directory.
Note
Tetragon generates a lot of events that can cause alert fatigue and consume significant storage resources on the Wazuh server over time. You can configure Tetragon to exclude noisy events you don’t require.
- Restart the Wazuh agent to apply the configuration changes:
# systemctl restart wazuh-agent
Wazuh dashboard
Perform the following steps to configure the Wazuh manager for analyzing Tetragon events from the Wazuh agent on the monitored Ubuntu endpoint.
- Click on the upper left menu ☰, navigate to Server management > Decoders, and click + Add new decoders file.
- Copy and paste the decoders below and name the file
tetragon_decoders.xml. Click Save.
<decoder name="tetragon">
  <program_name>^tetragon-events</program_name>
</decoder>

<decoder name="tetragon-args">
  <parent>tetragon</parent>
  <regex type="pcre2">process_kprobe.*args.*"family":"([\w\s]+)"</regex>
  <order>family</order>
</decoder>

<decoder name="tetragon-args">
  <parent>tetragon</parent>
  <regex>process_kprobe\.*args\.*"saddr":"(\d+.\d+.\d+.\d+)"</regex>
  <order>srcip</order>
</decoder>

<decoder name="tetragon-args">
  <parent>tetragon</parent>
  <regex>process_kprobe\.*args\.*"sport":(\d+)</regex>
  <order>srcport</order>
</decoder>

<decoder name="tetragon-args">
  <parent>tetragon</parent>
  <regex>process_kprobe\.*args\.*"daddr":"(\d+.\d+.\d+.\d+)"</regex>
  <order>dstip</order>
</decoder>

<decoder name="tetragon-args">
  <parent>tetragon</parent>
  <regex>process_kprobe\.*args\.*"dport":(\d+)</regex>
  <order>dstport</order>
</decoder>

<decoder name="tetragon-args">
  <parent>tetragon</parent>
  <plugin_decoder>JSON_Decoder</plugin_decoder>
</decoder>
- Click on the upper left menu ☰, navigate to Server management > Rules and click + Add new rules file.
- Copy and paste the rules below and name the file
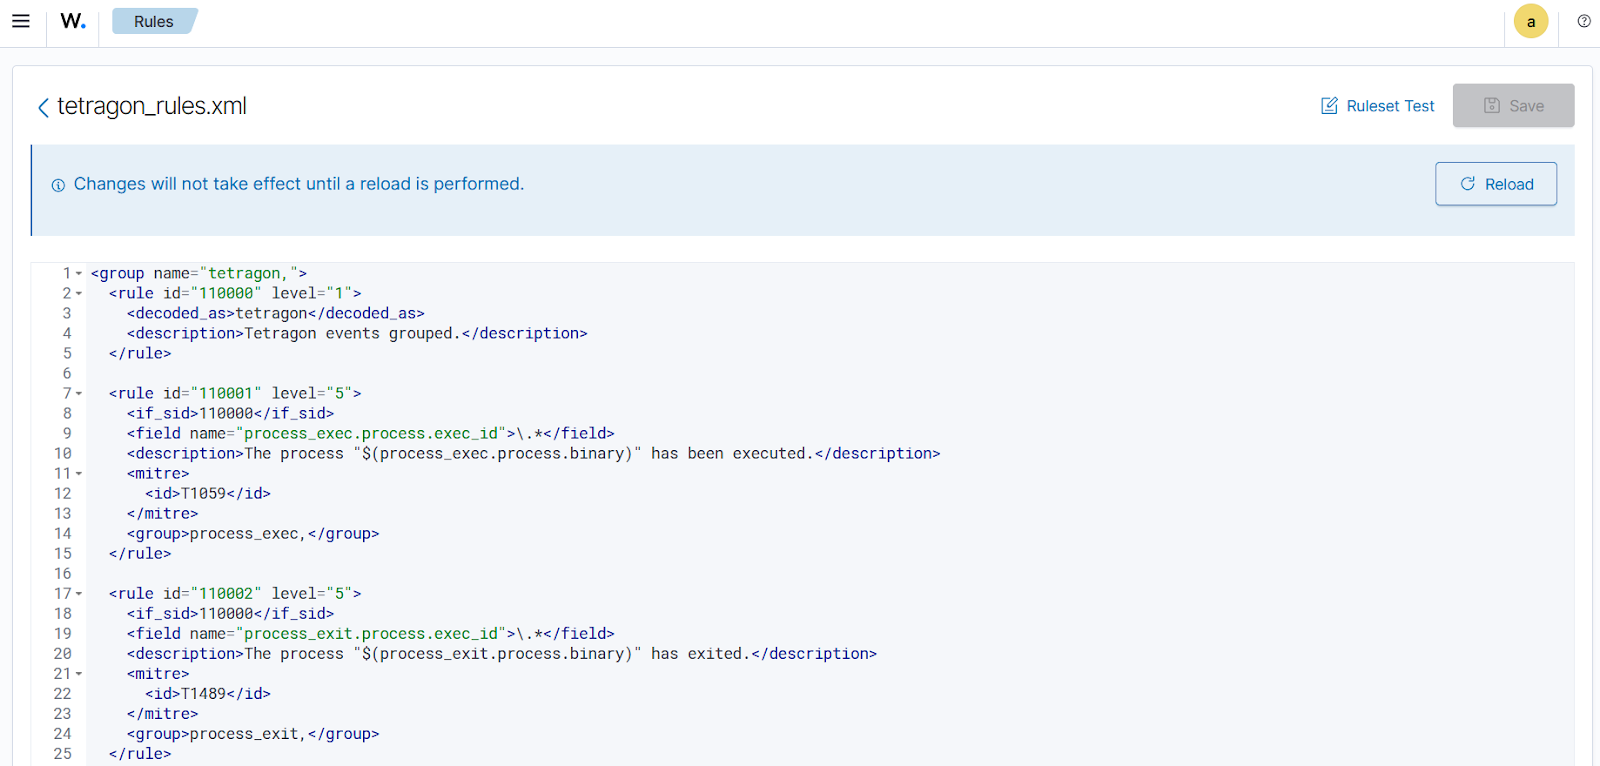
tetragon_rules.xml. Click Save.
<group name="tetragon,">
  <rule id="110000" level="1">
    <decoded_as>tetragon</decoded_as>
    <description>Tetragon events grouped.</description>
  </rule>

  <rule id="110001" level="5">
    <if_sid>110000</if_sid>
    <field name="process_exec.process.exec_id">\.*</field>
    <description>The process "$(process_exec.process.binary)" has been executed.</description>
    <mitre>
      <id>T1059</id>
    </mitre>
    <group>process_exec,</group>
  </rule>

  <rule id="110002" level="5">
    <if_sid>110000</if_sid>
    <field name="process_exit.process.exec_id">\.*</field>
    <description>The process "$(process_exit.process.binary)" has exited.</description>
    <mitre>
      <id>T1489</id>
    </mitre>
    <group>process_exit,</group>
  </rule>

  <rule id="110003" level="5">
    <if_sid>110000</if_sid>
    <field name="process_kprobe.process.exec_id">\.*</field>
    <description>Kernel event detected.</description>
    <mitre>
      <id>T1547.006</id>
    </mitre>
    <group>process_kprobe,</group>
  </rule>
</group>
The following rule IDs are triggered when events associated with Tetragon are detected:
- Rule ID
110000groups all Tetragon events. This rule doesn’t generate an alert on the Wazuh dashboard, as the severity level is less than3. - Rule ID
110001is triggered when process execution (process_exec) events are detected. - Rule ID
110002is triggered when process exit (process_exit) events are detected. - Rule ID
110003is triggered when kernel (process_kprobe) events are detected.
Note
You can further tailor these rules to suit specific requirements, as they can be noisy.
- Click Reload to apply the configuration changes.
Use cases
Tetragon monitors process execution events, system call activity, and I/O activity, including network connections & file access, using policies called TracingPolicy. These policies enable you to define which kernel events to monitor and what actions to take when those events occur.
The following use cases demonstrate some of the detections applicable to this integration:
- Monitoring process execution/termination and network activity
- Monitoring loading and unloading kernel modules
Monitoring process execution/termination and network activity
This use case focuses on monitoring process execution and termination events, as well as any associated network events. To capture detailed network data, we configure an additional tracing policy and a streamlined Wazuh rule to detect the event.
Ubuntu endpoint
Configuring Tetragon to monitor outbound network connections
- Create a tracing policy file
network-tracing-policy.yamlin the/etc/tetragon/tetragon.tp.d/directory with the content below. This policy traces all TCP connection attempts made by any process except those targeting127.0.0.1.
apiVersion: cilium.io/v1alpha1
kind: TracingPolicy
metadata:
  name: "network-monitor"
spec:
  kprobes:               # How to inject (kprobes, tracepoints, uprobes)
  - call: "tcp_connect"  # Where to inject (syscall, kernel function, tracepoint)
    syscall: false
    args:                # Extra data to include in the event
    - index: 0
      type: "sock"
    selectors:
    - matchArgs:         # How to filter events
      - index: 0
        operator: "NotDAddr"
        values:
        - 127.0.0.1
- Restart Tetragon to apply the configuration changes:
# systemctl restart tetragon
Wazuh dashboard
Perform the following steps to configure the Wazuh manager to analyze outbound network traffic on the monitored Ubuntu endpoint.
- Click on the upper left menu ☰, navigate to Server management > Rules > Manage rules files > Custom rules, and click the edit icon against the
tetragon_rules.xml file. - Copy the rule below and append it to the
tetragon_rules.xmlfile. Click Save.
<group name="tetragon,">
  <rule id="110004" level="9">
    <if_sid>110003</if_sid>
    <field name="family">AF_INET|AF_INET6</field>
    <description>Outbound connection to "$(dstip)" on port "$(dstport)" detected.</description>
    <mitre>
      <id>T1049</id>
      <id>T1041</id>
    </mitre>
  </rule>
</group>
Where:
- Rule ID
110004is triggered when an outbound network connection is detected.
- Click Reload to apply the configuration changes.
Simulating process execution/exit and outbound connections
Perform the following steps on the monitored Ubuntu endpoint to simulate the process execution/exit and outbound network connections.
- Query the Domain Name System (DNS) servers associated with
www.wazuh.comusing the command below:
# dig www.wazuh.com
; <<>> DiG 9.18.30-0ubuntu0.24.04.2-Ubuntu <<>> www.wazuh.com
;; global options: +cmd
;; Got answer:
;; ->>HEADER<<- opcode: QUERY, status: NOERROR, id: 37501
;; flags: qr rd ra; QUERY: 1, ANSWER: 4, AUTHORITY: 0, ADDITIONAL: 1

;; OPT PSEUDOSECTION:
; EDNS: version: 0, flags:; udp: 65494
;; QUESTION SECTION:
;www.wazuh.com.                 IN      A

;; ANSWER SECTION:
www.wazuh.com.          60      IN      A       108.157.78.112
www.wazuh.com.          60      IN      A       108.157.78.94
www.wazuh.com.          60      IN      A       108.157.78.8
www.wazuh.com.          60      IN      A       108.157.78.76

;; Query time: 170 msec
;; SERVER: 127.0.0.53#53(127.0.0.53) (UDP)
;; WHEN: Wed Sep 10 19:52:06 WAT 2025
;; MSG SIZE  rcvd: 106
The output shows that there are four DNS servers linked to the www.wazuh.com domain name.
- Perform an SSH connection to the
www.wazuh.comdomain name:
# ssh www.wazuh.com
Wazuh dashboard
Perform the steps below to view the alerts generated on the Wazuh dashboard when alerts associated with kernel events are generated.
- Navigate to Threat intelligence > Threat Hunting and click the Events tab.
- Apply the filter
rule.groups: tetragonon the search bar and click Update.
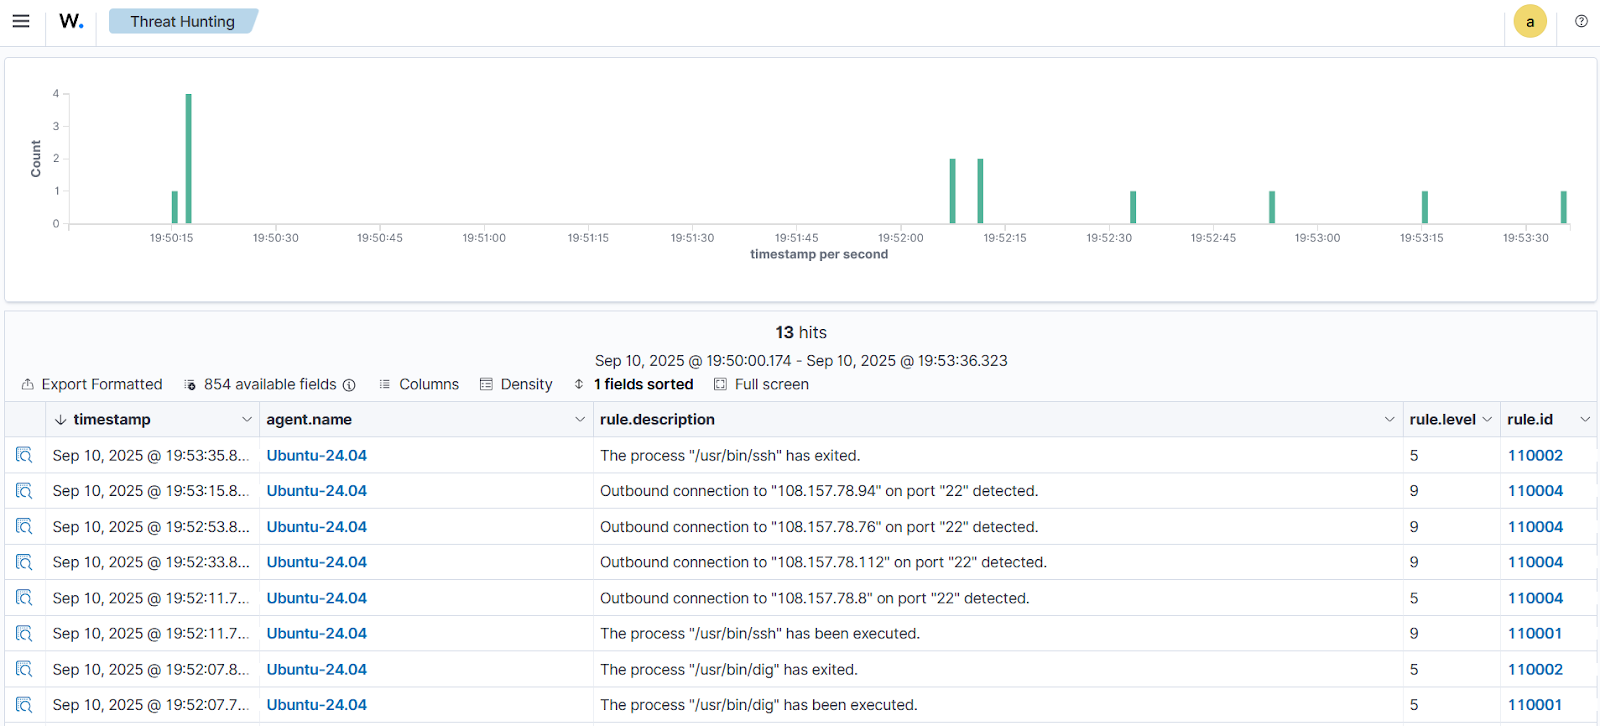
The screenshot above illustrates the start and termination of the dig process. Additionally, it captures the execution of the ssh process, including the network connection attempts to the four distinct IP addresses, followed by the ssh process termination alert.
Click the Inspect document details button at the far left of alert ID 110001 to view the details.
The JSON data containing all the details for alert ID 110001 is shown below:
{
  ...
    "data": {
      "node_name": "osboxes",
      "process_exec": {
        "parent": {
          "exec_id": "b3Nib3hlczo3MTE4NjYwMDAwMDAwOjY1NDQ=",
          "uid": "0",
          "cwd": "/root",
          "start_time": "2025-09-10T10:26:01.575501804Z",
          "auid": "1000",
          "in_init_tree": "false",
          "binary": "/usr/bin/bash",
          "flags": "procFS auid",
          "parent_exec_id": "b3Nib3hlczo3MTE4NjYwMDAwMDAwOjY1NDM=",
          "pid": "6544",
          "tid": "6544"
        },
        "process": {
          "exec_id": "b3Nib3hlczozNzQ4Mzc0MzUyMDkyNjoxMDkyOA==",
          "uid": "0",
          "cwd": "/root",
          "start_time": "2025-09-10T18:52:06.659023818Z",
          "auid": "1000",
          "in_init_tree": "false",
          "binary": "/usr/bin/dig",
          "flags": "execve clone",
          "parent_exec_id": "b3Nib3hlczo3MTE4NjYwMDAwMDAwOjY1NDQ=",
          "pid": "10928",
          "arguments": "www.wazuh.com",
          "tid": "10928"
        }
      },
      "time": "2025-09-10T18:52:06.659022707Z"
    },
  ...
}
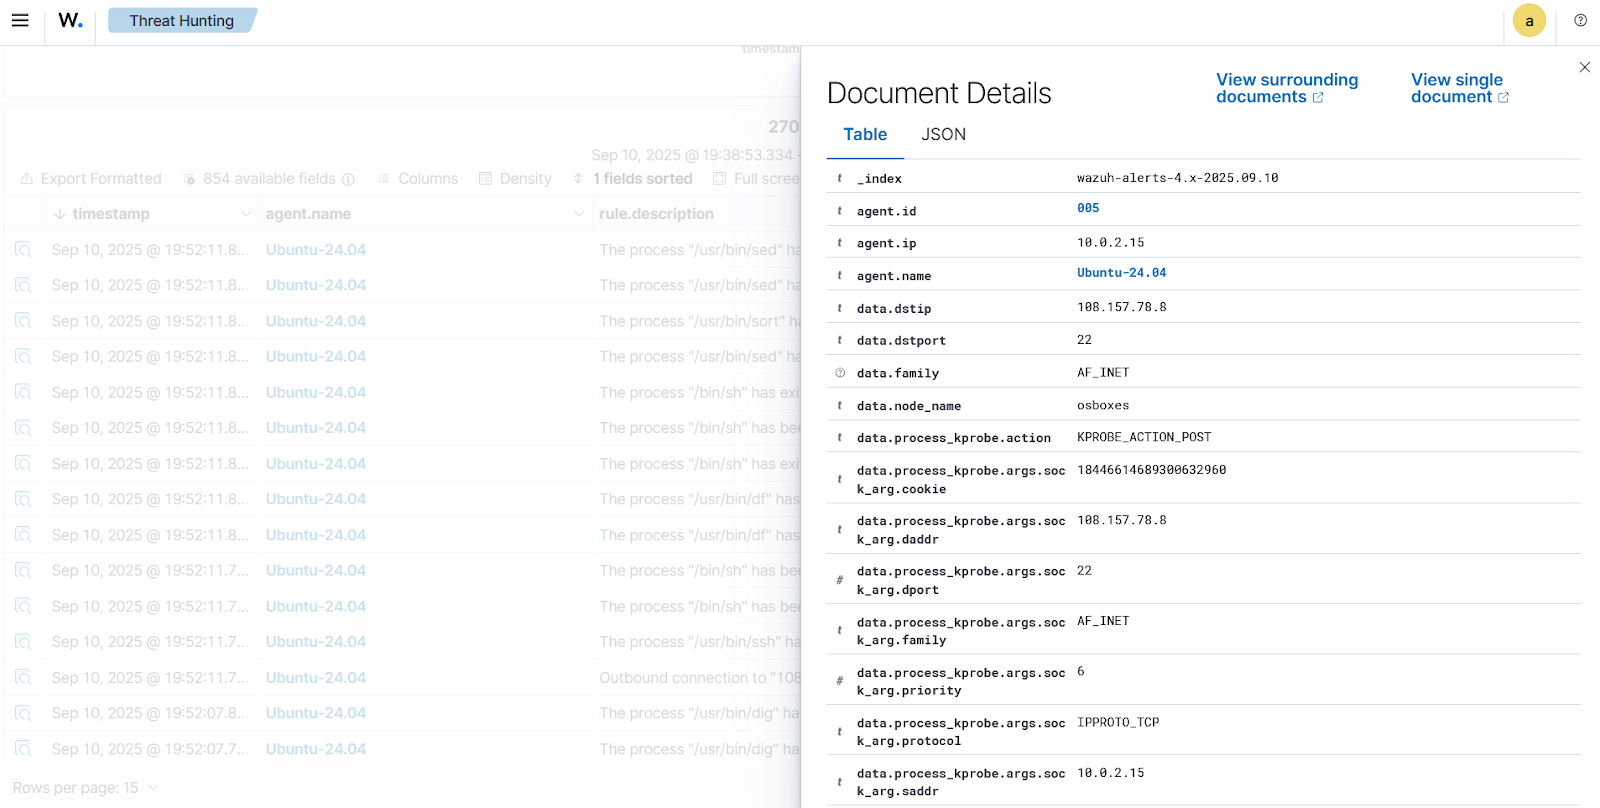
Click the Inspect document details button at the far left of alert ID 110004 to view the details.
The JSON data containing all the details for alert ID 110004 is shown below:
{
  ...
    "data": {
      "srcip": "10.0.2.15",
      "dstport": "22",
      "process_kprobe": {
        "args": [
          {
            "sock_arg": {
              "dport": 22,
              "protocol": "IPPROTO_TCP",
              "cookie": "18446614689300632960",
              "saddr": "10.0.2.15",
              "daddr": "108.157.78.94",
              "state": "TCP_SYN_SENT",
              "family": "AF_INET",
              "type": "SOCK_STREAM",
              "priority": 6,
              "sport": 44042
            }
          }
        ],
        "parent": {
          "exec_id": "b3Nib3hlczo3MTE4NjYwMDAwMDAwOjY1NDQ=",
          "uid": "0",
          "cwd": "/root",
          "start_time": "2025-09-10T10:26:01.575501804Z",
          "auid": "1000",
          "in_init_tree": "false",
          "binary": "/usr/bin/bash",
          "flags": "procFS auid",
          "parent_exec_id": "b3Nib3hlczo3MTE4NjYwMDAwMDAwOjY1NDM=",
          "pid": "6544",
          "tid": "6544"
        },
        "process": {
          "auid": "1000",
          "flags": "execve clone",
          "parent_exec_id": "b3Nib3hlczo3MTE4NjYwMDAwMDAwOjY1NDQ=",
          "pid": "10935",
          "tid": "10935",
          "exec_id": "b3Nib3hlczozNzQ4ODcwODkzOTUxMDoxMDkzNQ==",
          "uid": "0",
          "cwd": "/root",
          "start_time": "2025-09-10T18:52:11.624441727Z",
          "refcnt": "1",
          "in_init_tree": "false",
          "binary": "/usr/bin/ssh",
          "arguments": "www.wazuh.com"
        },
        "function_name": "tcp_connect",
        "action": "KPROBE_ACTION_POST",
        "policy_name": "monitor-network",
        "return_action": "KPROBE_ACTION_POST"
      },
      "node_name": "osboxes",
      "srcport": "44042",
      "dstip": "108.157.78.94",
      "time": "2025-09-10T18:53:14.791837356Z",
      "family": "AF_INET"
    },
  ...
}
Monitoring loading and unloading kernel modules
Kernel modules or Loadable Kernel Modules (LKM) run in the kernel itself, providing unlimited access to the system’s resources. Threat actors can leverage LKMs to conceal their actions and bypass security mechanisms on compromised endpoints. This use case shows how to detect the loading and unloading of a custom kernel module.
Ubuntu endpoint
Follow the steps below to configure Tetragon for monitoring kernel events, develop a custom kernel module, and load and unload it on the monitored Ubuntu endpoint.
Configure Tetragon to monitor kernel events
- Download the monitor-kernel-modules tracing policy, which generates
ProcessKprobeevents to trace kernel module operations:
# curl -o /etc/tetragon/tetragon.tp.d/monitor-kernel-modules.yaml https://raw.githubusercontent.com/cilium/tetragon/main/examples/tracingpolicy/host-changes/monitor-kernel-modules.yaml
- Restart Tetragon to apply the configuration changes:
# systemctl restart tetragon
Creating a custom LKM
- Install the following Linux headers:
# apt update && apt install build-essential linux-headers-$(uname -r)
- Create the following module
testModule.cin the/optdirectory with the command below. This is a basic module that logs the messages, “Hi there! Module loaded!!” and “Module unloaded.” in the/var/log/kern.logfile when loaded and unloaded, respectively.
# cat <<EOF>> /opt/testModule.c
#include <linux/module.h>  // included for all kernel modules
#include <linux/kernel.h>  // included for KERN_INFO
#include <linux/init.h>   // included for __init and __exit macros
MODULE_LICENSE("GPL");
MODULE_AUTHOR("Anyam");
MODULE_DESCRIPTION("Test module");

static int __init hello_init(void)
{
  printk(KERN_INFO "Hi there! Module loaded!!\n");
  return 0;  // Non-zero return means that the module couldn't be loaded.
}
static void __exit hello_cleanup(void)
{
  printk(KERN_INFO "Module unloaded.\n");
}
module_init(hello_init);
module_exit(hello_cleanup);
EOF
- Create a file
Makefilein the/optdirectory with the content below. This file is later used to compile the kernel module.
obj-m += testModule.o
all:
        make -C /lib/modules/$(shell uname -r)/build M=$(PWD) modules
clean:
        make -C /lib/modules/$(shell uname -r)/build M=$(PWD) clean
Note
Ensure to use tabs instead of spaces for indentation in the /opt/Makefile file.
- Run the
makecommand to compile/opt/testModule.cinto the LKM file/opt/testModule.ko:
# cd /opt && make
Loading and unloading the LKM
- Insert the LKM module
/opt/testModule.kointo the Linux Kernel:
# insmod /opt/testModule.ko
- Verify that the module was inserted by viewing its content:
# dmesg | tail -1
[ 593.532130] Hi there! Module loaded!!
- Unload the LKM module
/opt/testModule.kofrom the Linux kernel:
# rmmod /opt/testModule.ko
- Verify that the module was unloaded by viewing its content:
# dmesg | tail -1
[ 2212.038966] Module unloaded.
You can also validate the loaded and unloaded modules by checking the /var/log/kern.log file:
# tail -2 /var/log/kern.log
2025-09-10T11:40:24.235375+01:00 osboxes kernel: Hi there! Module loaded!!
2025-09-10T11:40:34.077698+01:00 osboxes kernel: Module unloaded.
Wazuh dashboard
Perform the steps below to view the alerts generated on the Wazuh dashboard when alerts associated with kernel events are generated.
- Navigate to Threat intelligence > Threat Hunting and click the Events tab.
- Apply the filter
rule.id: 110003on the search bar and click Update.
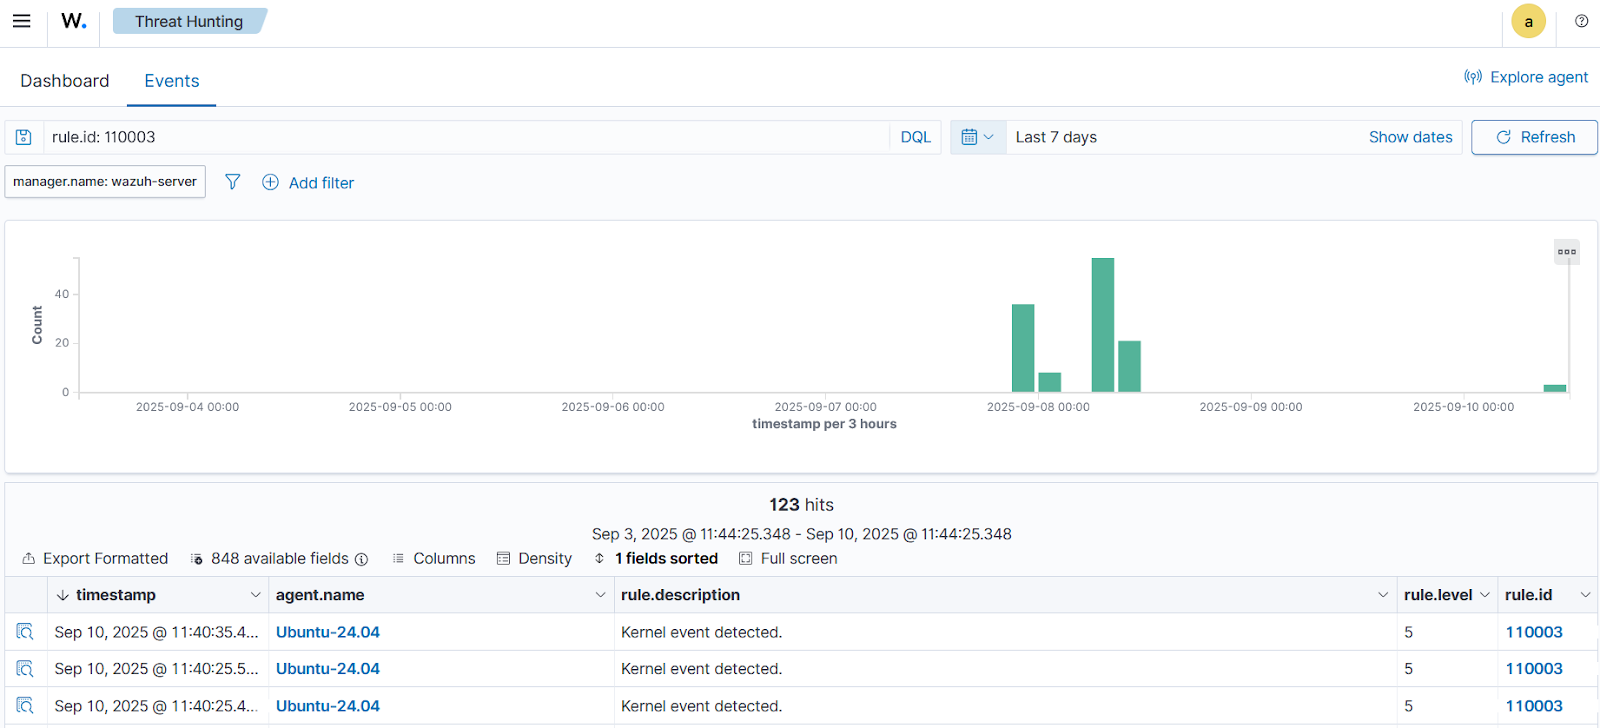
To have a more detailed description of each event, click on the Inspect document details button at the far left of the alert to open the detailed view.
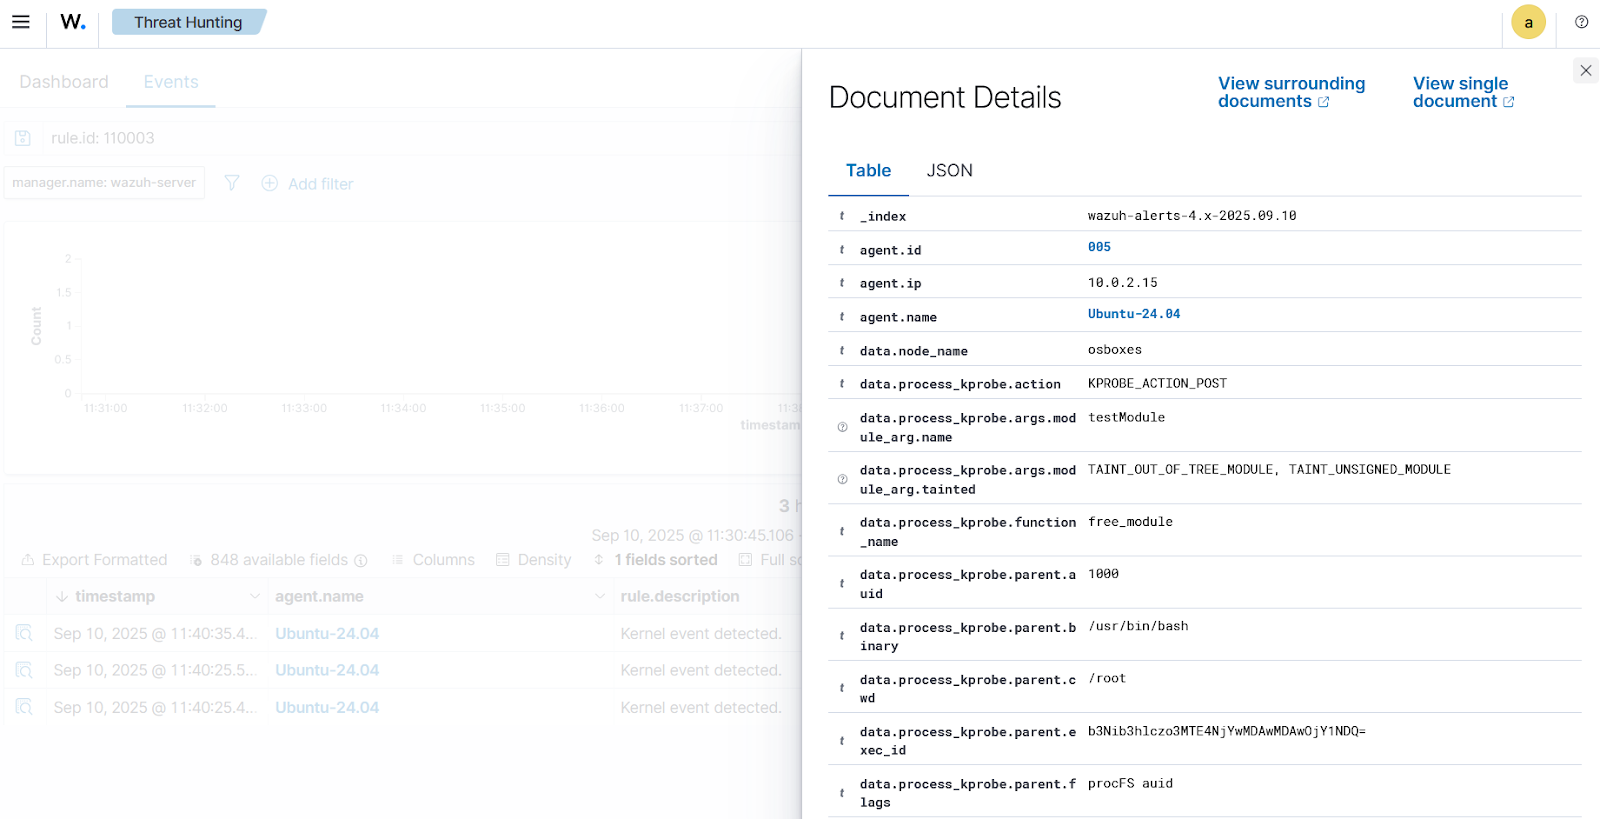
The JSON data containing all the details for one of the alerts is shown below:
...
    "data": {
      "process_kprobe": {
        "args": [
          {
            "module_arg": {
              "tainted": [
                "TAINT_OUT_OF_TREE_MODULE",
                "TAINT_UNSIGNED_MODULE"
              ],
              "name": "testModule"
            }
          }
        ],
        "parent": {
          "exec_id": "b3Nib3hlczo3MTE4NjYwMDAwMDAwOjY1NDQ=",
          "uid": "0",
          "cwd": "/root",
          "start_time": "2025-09-10T10:26:03.969087215Z",
          "auid": "1000",
          "in_init_tree": "false",
          "binary": "/usr/bin/bash",
          "flags": "procFS auid",
          "parent_exec_id": "b3Nib3hlczo3MTE4NjYwMDAwMDAwOjY1NDM=",
          "pid": "6544",
          "tid": "6544"
        },
        "process": {
          "auid": "1000",
          "flags": "execve clone",
          "parent_exec_id": "b3Nib3hlczo3MTE4NjYwMDAwMDAwOjY1NDQ=",
          "pid": "7895",
          "tid": "7895",
          "exec_id": "b3Nib3hlczo3OTg4NzYzMjY0MTY0Ojc4OTU=",
          "uid": "0",
          "cwd": "/opt",
          "start_time": "2025-09-10T10:40:34.072351479Z",
          "refcnt": "1",
          "in_init_tree": "false",
          "binary": "/usr/sbin/rmmod",
          "arguments": "/opt/testModule.ko"
        },
        "function_name": "free_module",
        "action": "KPROBE_ACTION_POST",
        "policy_name": "monitor-kernel-modules",
        "return_action": "KPROBE_ACTION_POST"
      },
      "node_name": "osboxes",
      "time": "2025-09-10T10:40:34.077254633Z"
    },
 ...
Conclusion
Integrating Tetragon with Wazuh strengthens Linux system defenses by combining deep kernel-level visibility with robust analysis and alerting capabilities. This integration provides organizations with comprehensive and actionable security observability insights into low-level system activities, including process execution, network activity, and system calls. It also improves incident response through alerting and centralized visibility.
To learn more about Wazuh capabilities, check out our documentation, blog posts, and join our community for support and updates.