Cybersecurity frameworks are structured standards, guidelines, and best practices for managing and reducing cybersecurity risks. Some examples include NIST, HIPAA Security Rule, PCI DSS, and CMMC. These frameworks provide a foundational blueprint for securing sensitive data and strengthening cyber resilience, especially in regulated industries.
Wazuh, an open source Security Information and Event Management (SIEM) and Extended Detection and Response (XDR) platform, supports the above-listed cybersecurity frameworks. It protects on-premises and cloud workloads, using its out-of-the-box capabilities for vulnerability detection, security configuration assessment (SCA), file integrity monitoring (FIM), incident response, and others.
This blog post highlights some Wazuh use cases for CMMC compliance and demonstrates how to visualize important metrics.
CMMC requirements
The Cybersecurity Maturity Model Certification (CMMC) is a framework created by the United States Department of Defense. It outlines cybersecurity standards and best practices that organizations that handle Federal Contract Information (FCI) and Controlled Unclassified Information (CUI) must follow. These requirements span multiple domains such as access control, audit and accountability, incident response, and system integrity, and are organized using progressive maturity levels. The maturity levels are numbered numerically. At CMMC Levels 2 and 3, organizations must implement technical controls, maintain documented security practices, and demonstrate log retention, vulnerability management, and incident reporting capabilities.
Compliance with CMMC ensures that an organization’s cybersecurity posture aligns with the Department of Defense (DoD) expectations for protecting sensitive data throughout the supply chain.
How Wazuh assists with CMMC compliance
Wazuh provides out-of-the-box capabilities for vulnerability detection, security configuration assessment (SCA), file integrity monitoring (FIM), incident response, malware detection, and others. These capabilities help to meet several aspects of the CMMC domain. Wazuh includes data.sca.check.compliance.cmmc_v2.0 tags for mapping CMMC events for access control, configuration management, audit, and others.
| CMMC domain | Wazuh capabilities |
| Audit & Accountability (AU) | Log data analysis: Wazuh collects, analyzes, and stores logs from endpoints, network devices, and applications. |
| Access Control (AC) | Log data analysis: Wazuh collects, analyzes, and stores identity and access management (IAM) logs from endpoints, network devices, and applications. |
| Configuration management (CM) | Security configuration assessment: Wazuh provides out-of-the-box baseline checks using CIS benchmarks. |
| Identification and Authentication (IA) | Log data analysis: Wazuh collects, analyzes, and stores logs from endpoints, network devices, and applications. |
| Media Protection (MP) | File integrity monitoring (FIM): This Wazuh capability detects unauthorized access or modification to sensitive files. |
| Security Assessment (CA) | Log data analysis: Wazuh collects, analyzes, and stores logs from endpoints, network devices, and applications. File integrity monitoring (FIM): This Wazuh capability detects unauthorized access or modification to sensitive files. |
| System and Communications Protection (SC) | Log data analysis: Wazuh collects, analyzes, and stores logs from endpoints, network devices, and applications. |
| System Information and Integrity (SI) | Vulnerability detection: Wazuh detects vulnerabilities on operating systems and applications installed on monitored endpoints. File integrity monitoring (FIM): This Wazuh capability monitors registry keys and other sensitive system files. |
The table above shows the Wazuh out-of-the-box CMMC domains and the Wazuh capabilities that can help you achieve them.
Infrastructure
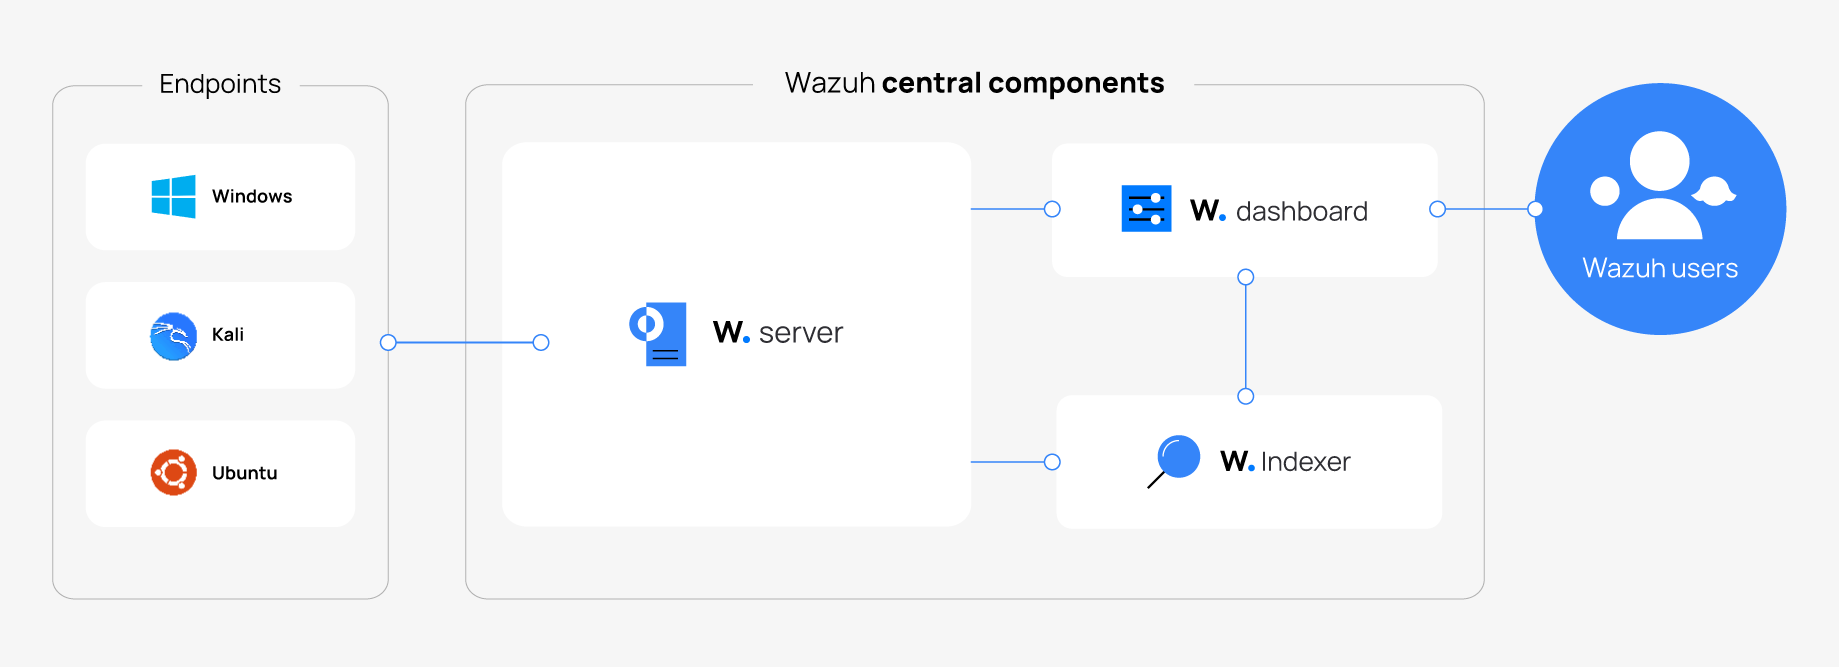
For this blog post, we use the following Wazuh infrastructure to demonstrate CMMC compliance:
- Wazuh 4.12.0 central components (Wazuh server, Wazuh indexer, Wazuh dashboard) installed using the Quickstart guide on an Ubuntu 24.04 server.
- An Ubuntu 24.04 endpoint with a Wazuh agent installed and enrolled to the Wazuh server.
- A Windows 11 endpoint with a Wazuh agent installed and enrolled to the Wazuh server.
- A Kali 2025.2 endpoint with a Wazuh agent installed and enrolled to the Wazuh server.
Configuring Wazuh for CMMC compliance
The following sections demonstrate how various Wazuh capabilities facilitate CMMC compliance and how to create custom visualizations. The examples are from the CMMC framework’s audit and accountability, access control, and risk assessment domains.
Audit and accountability (AU)
The AU.L2-3.3.1 control refers to: retaining system audit logs and records needed to enable the monitoring, analysis, investigation, and reporting of unlawful or unauthorized system activity.
Follow the steps below to detect unsuccessful logon attempts on your infrastructure’s Windows and Linux endpoints.
Simulate failed logon attempts
Enter an invalid username and password combination on the login screen of your Windows, Ubuntu, and Kali endpoints. Repeat this action three times.
Wazuh dashboard
Perform the following steps on the Wazuh dashboard to view the alerts generated.
1. Select the top left menu ☰, navigate to the Threat intelligence tab, and click on Threat Hunting.
2. Select the Authentication failure filter.
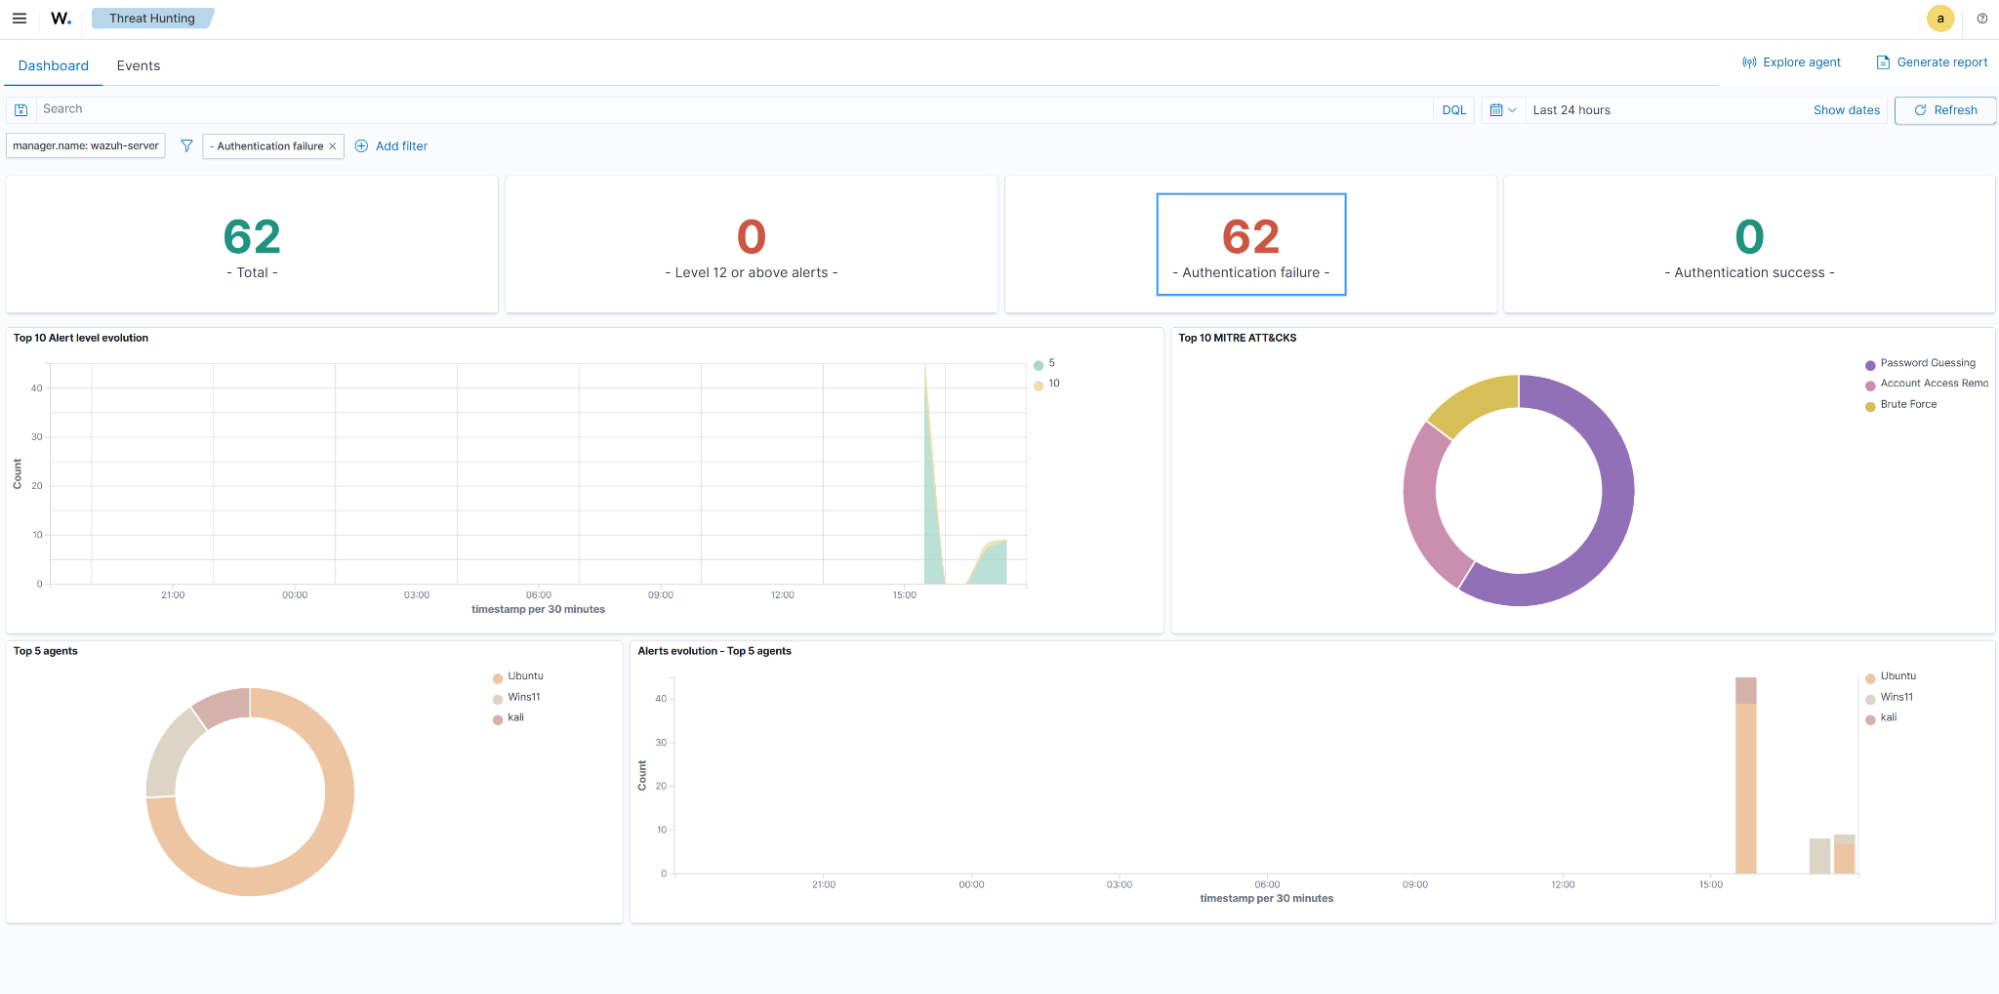
3. Click on the Events tab.
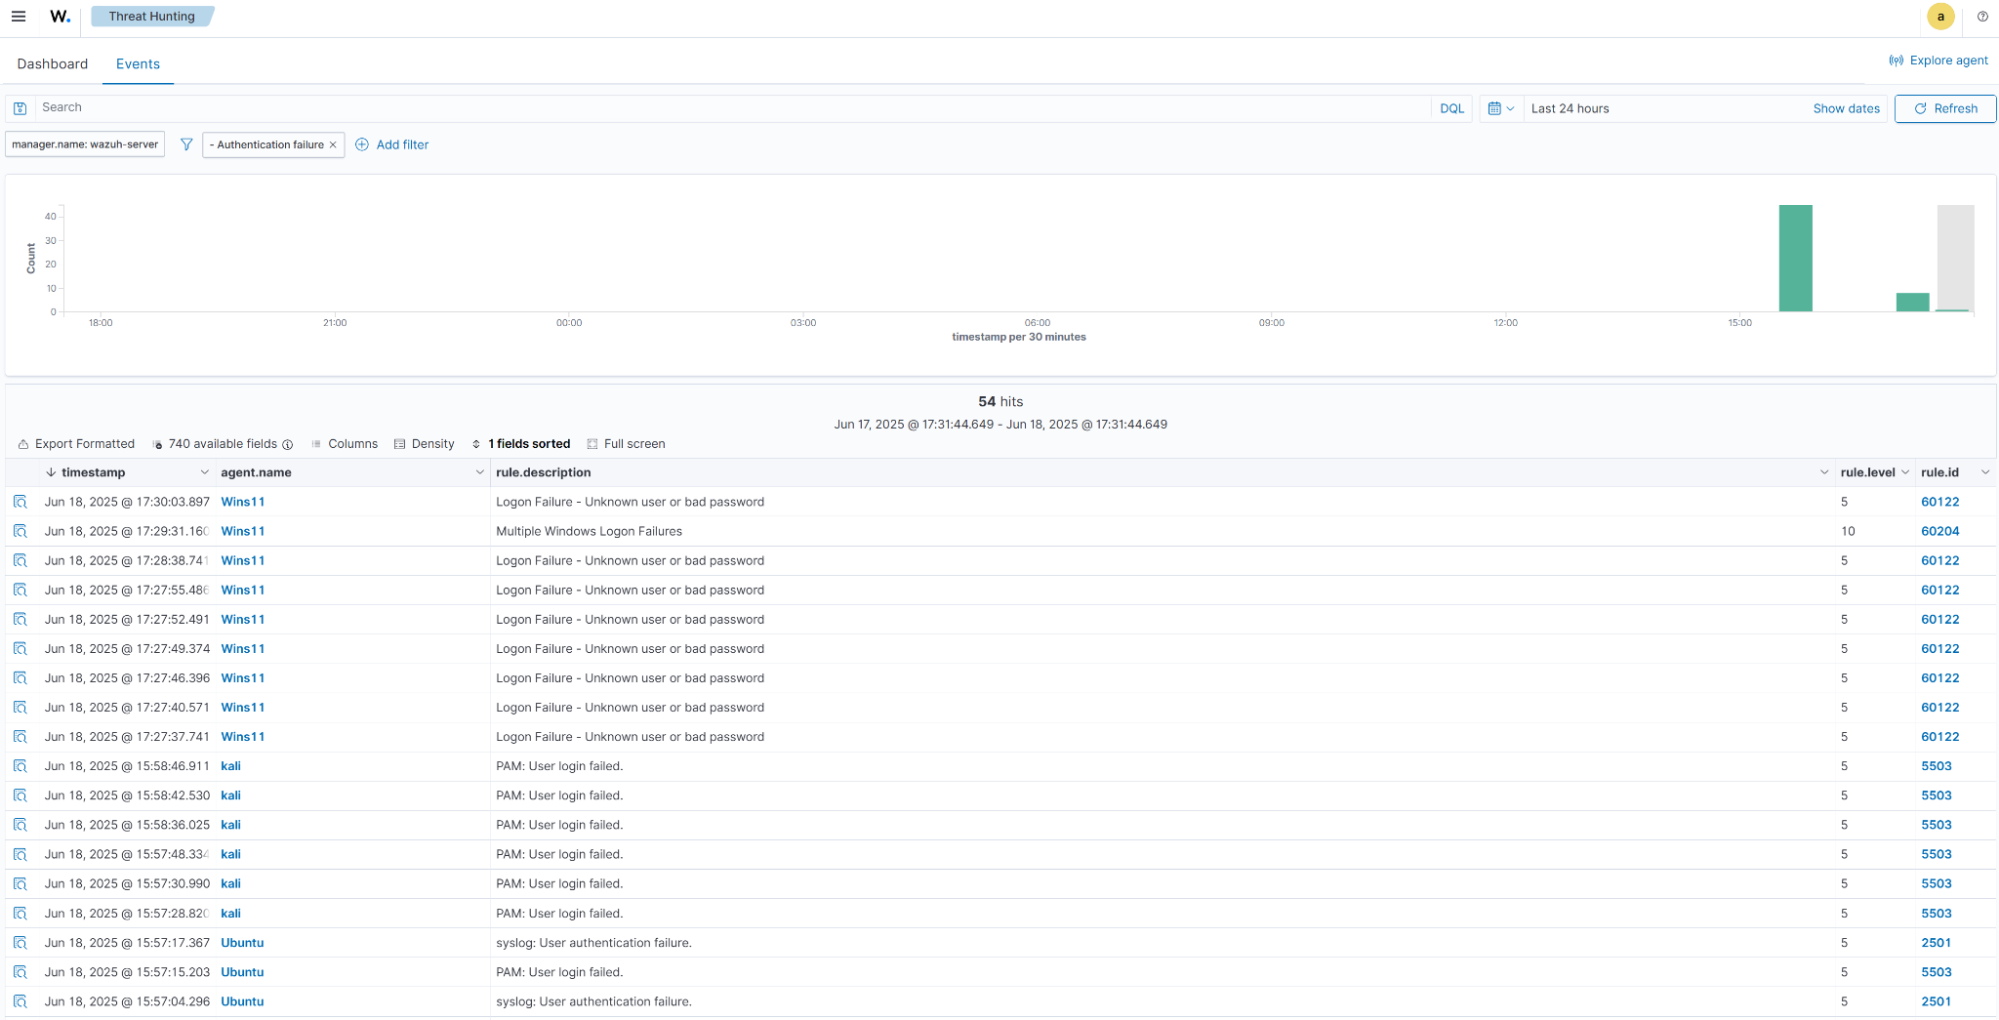
The image above shows unsuccessful logon attempts detected on the monitored endpoints by the Wazuh log data analysis engine.
Access control (AC)
The AC.L2-3.1.11 control states: to terminate (automatically) a user session after a defined condition. An administrator can predefine this condition using the Wazuh Active Response capability.
The steps below show you how to configure Wazuh active response to disable a Linux user account after five failed logon attempts.
Wazuh server
1. Add the rule below to the Wazuh server /var/ossec/etc/rules/local_rules.xml file:
<group name="pam,syslog,">
  <rule id="120100" level="10" frequency="5" timeframe="120">
    <if_matched_sid>5503</if_matched_sid>
    <description>Possible password guess on $(dstuser): five failed logins in a short period of time</description>
    <mitre>
      <id>T1110</id>
    </mitre>
  </rule>
</group>
This rule checks for five failed logon attempts on the same user account within 2 minutes.
2. Open the Wazuh server /var/ossec/etc/ossec.conf file and verify that a <command> block called disable-account with the following configuration is present within the <ossec_config> block:
  <command>
    <name>disable-account</name>
    <executable>disable-account</executable>
    <timeout_allowed>yes</timeout_allowed>
  </command>
The <command> block contains information about the action to be executed on the Wazuh agent.
<name>: Sets a name for the command. In this case,disable-account.<executable>: Specifies the active response script that must run after a trigger. In this case, it is thedisable-accountexecutable.<timeout_allowed>: Allows a timeout period. This tag is set to yes here, representing a stateful active response.
3. Add the <active-response> block below to the Wazuh server /var/ossec/etc/ossec.conf configuration file:
<ossec_config>
  <active-response>
    <disabled>no</disabled>
    <command>disable-account</command>
    <location>local</location>
    <rules_id>120100</rules_id>
    <timeout>300</timeout>
  </active-response>
</ossec_config>
<command>: Specifies the command to configure. This is the command namedisable-accountdefined in the previous step.<location>: Specifies where the command executes. Using the local value here means that the command executes on the monitored endpoint where the trigger event occurs.<rules_id>: The Wazuh Active Response module executes the command if rule ID 120100, which shows a possible password guess on$(dstuser)after five failed logon attempts.<timeout>: Specifies how long the active response action must last. In this use case, we configure it to last for 300 seconds. After that period, the Active Response reverts its action and re-enables the account.
4. Restart the Wazuh manager service to apply changes:
$ sudo systemctl restart wazuh-manager
Ubuntu
Create two users for testing purposes:
$ sudo adduser user1
$ sudo adduser user2
Kali
Create two users for testing purposes:
$ sudo adduser user1
$ sudo adduser user2
Test the configuration (Ubuntu)
To test our use case, sign in to user2 and attempt to switch to user1 using a wrong password.
1. Switch to user2 using the correct password:
$ su user2
2. Run the following command six(6) times and type in any wrong password for user1 when prompted to enter the password:
$ su user1
Test the configuration (Kali Linux)
To test our use case, sign in to user1 and attempt to switch to user2 using the wrong password.
1. Switch to user1 using the correct password:
$ su user1
2. Run the following commands five(5) times and type in any wrong password for the user2 when prompted to enter the password:
$ su user2
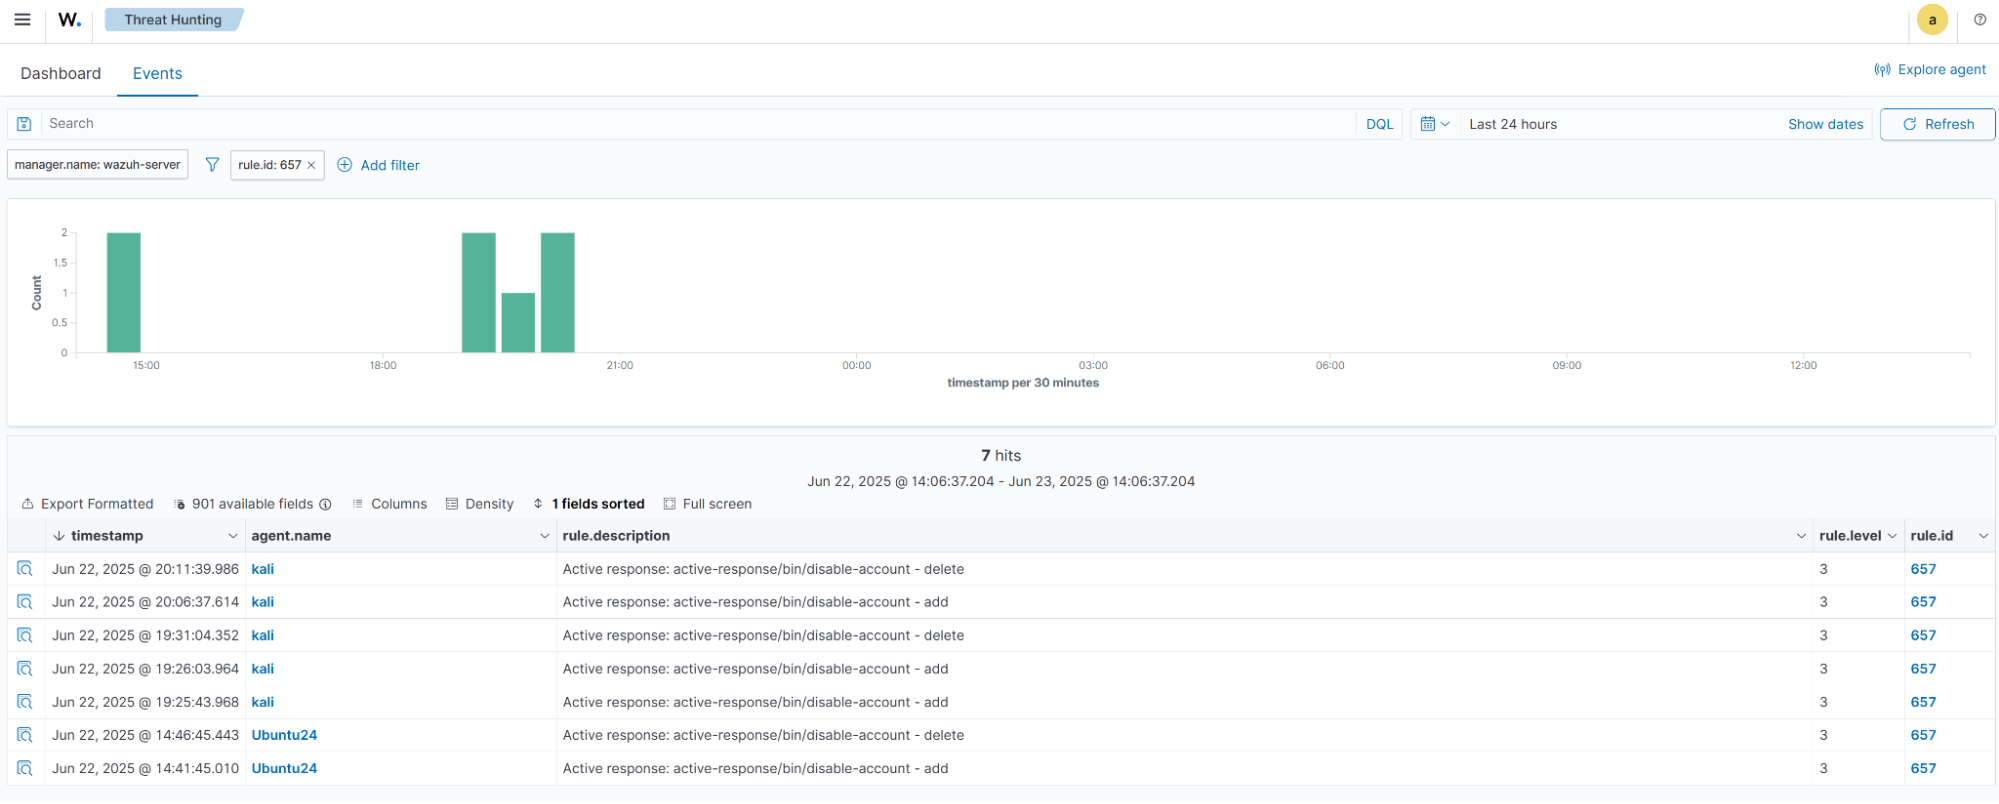
Wazuh dashboard
Perform the following steps on the Wazuh dashboard to verify that the accounts are disabled and the related alerts are displayed on the Wazuh dashboard..
1. Select the top left menu ☰, navigate to the Threat intelligence tab, and click on Threat Hunting.
2. Select the Events tab.
3. Add a filter to only show active response rule 657 alerts:
Where:
- Field is
rule.id. - Operator is
is. - Values is
657.
Risk assessment (RA)
The RA domain identifies and manages systems, data, and operational risks. It involves vulnerability scanning, threat and impact analysis, security categorization, and remediation planning. The RA.L2-3.11.2 control highlights the need for organizations to: scan for vulnerabilities in systems and applications periodically, and detect new vulnerabilities when they are introduced. Wazuh uses its vulnerability detection capability to perform risk assessments in compliance with CMMC.
Wazuh dashboard
Perform the following steps on the Wazuh dashboard to view the alerts generated.
1. Select the top left menu ☰, navigate to the Threat intelligence tab, and click on Vulnerability Detection.
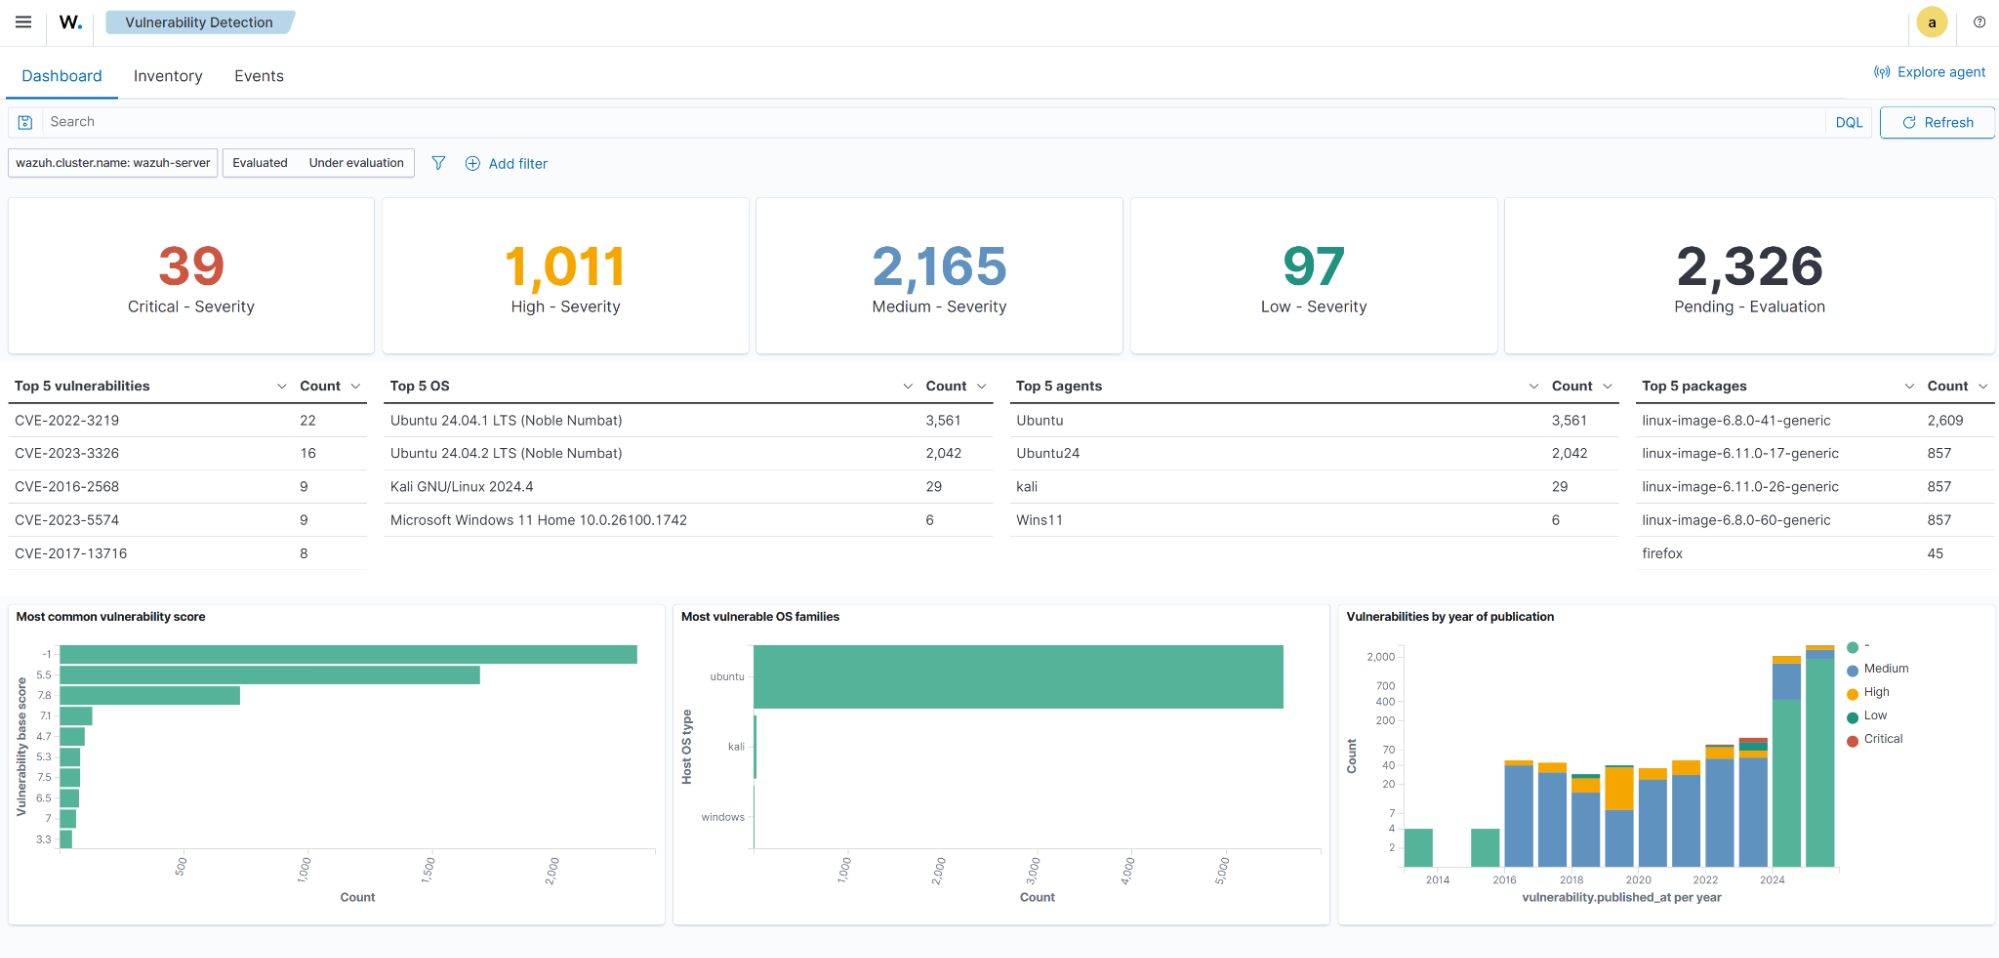
The dashboard above shows the vulnerabilities detected across your monitored endpoints
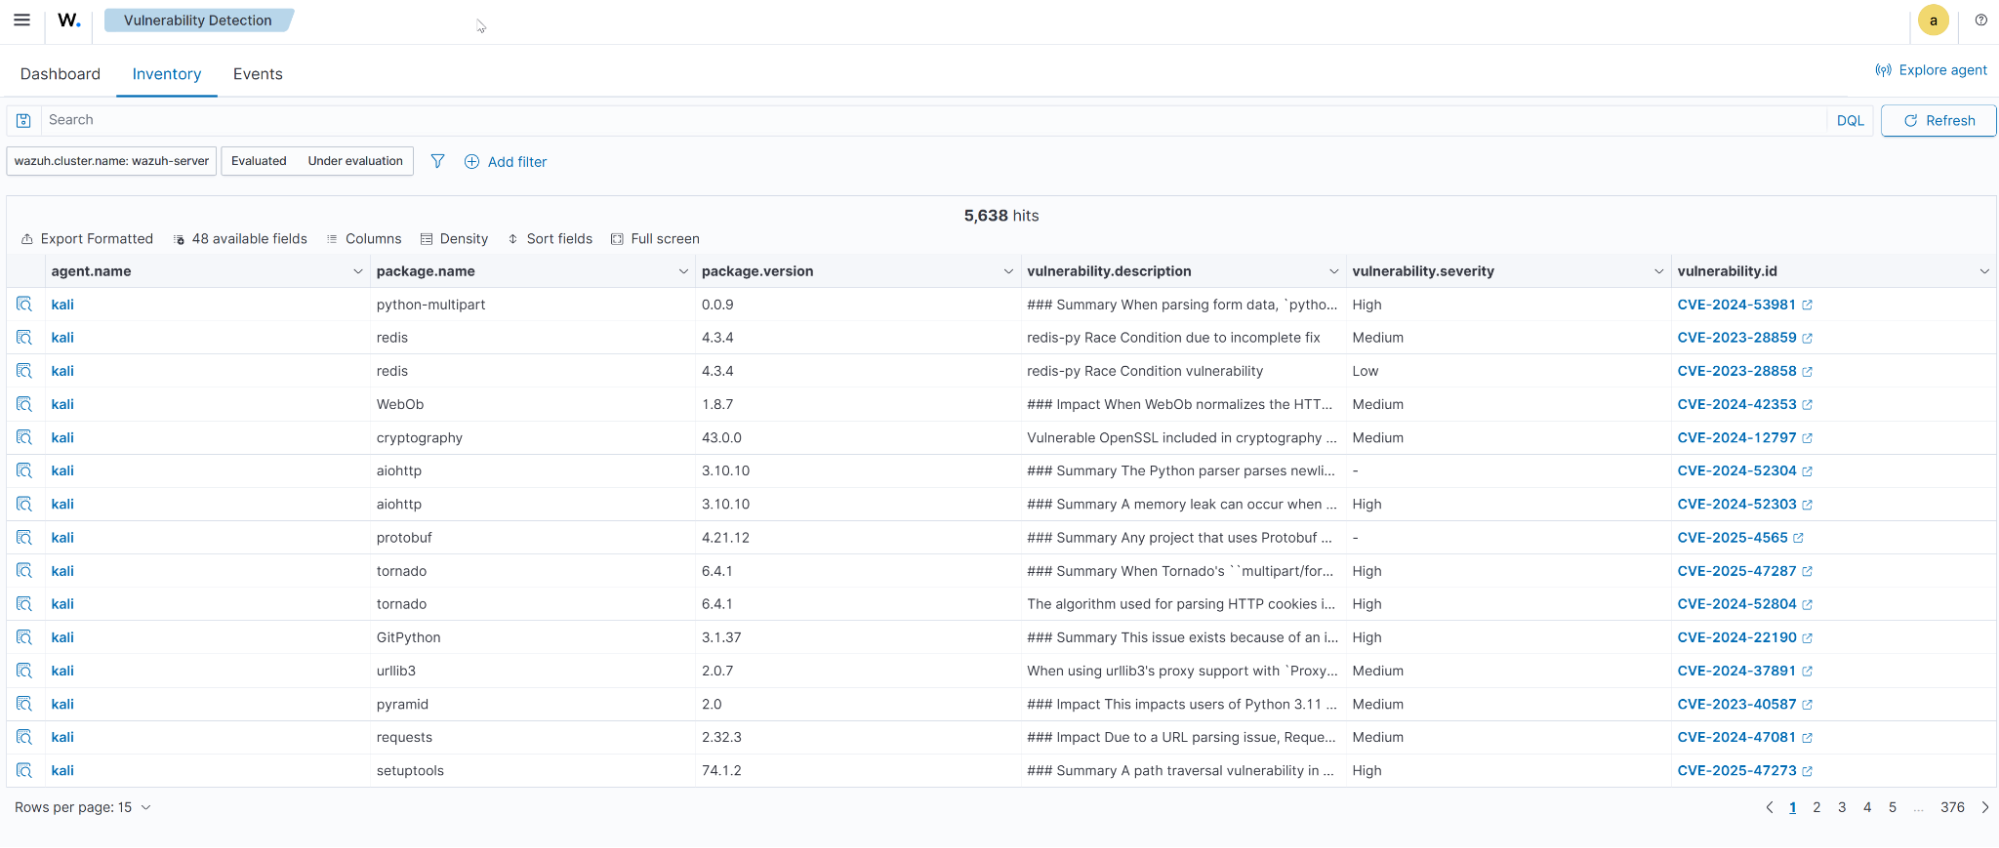
2. Select the Inventory tab to view the vulnerability alerts from your monitored endpoints.
Creating a custom CMMC dashboard
In this section, we create a custom Wazuh dashboard to visualize CMMC compliance for audit and accountability (AU), access control (AC), and risk assessment (RA). We also provide an option to import a ready-made version of the custom dashboard.
Creating the custom visualizations
We show a step-by-step approach to creating the custom CMMC dashboard. First, we create a visualization for audit and accountability, access control, and risk assessment. Then, we add the visualizations to a dashboard to unify them.
Audit and accountability visualization
Perform the following steps on the Wazuh dashboard to create a summary visualization for unsuccessful logon attempts on your monitored endpoints.
1. Select Visualize, under Explore, from the top left menu.
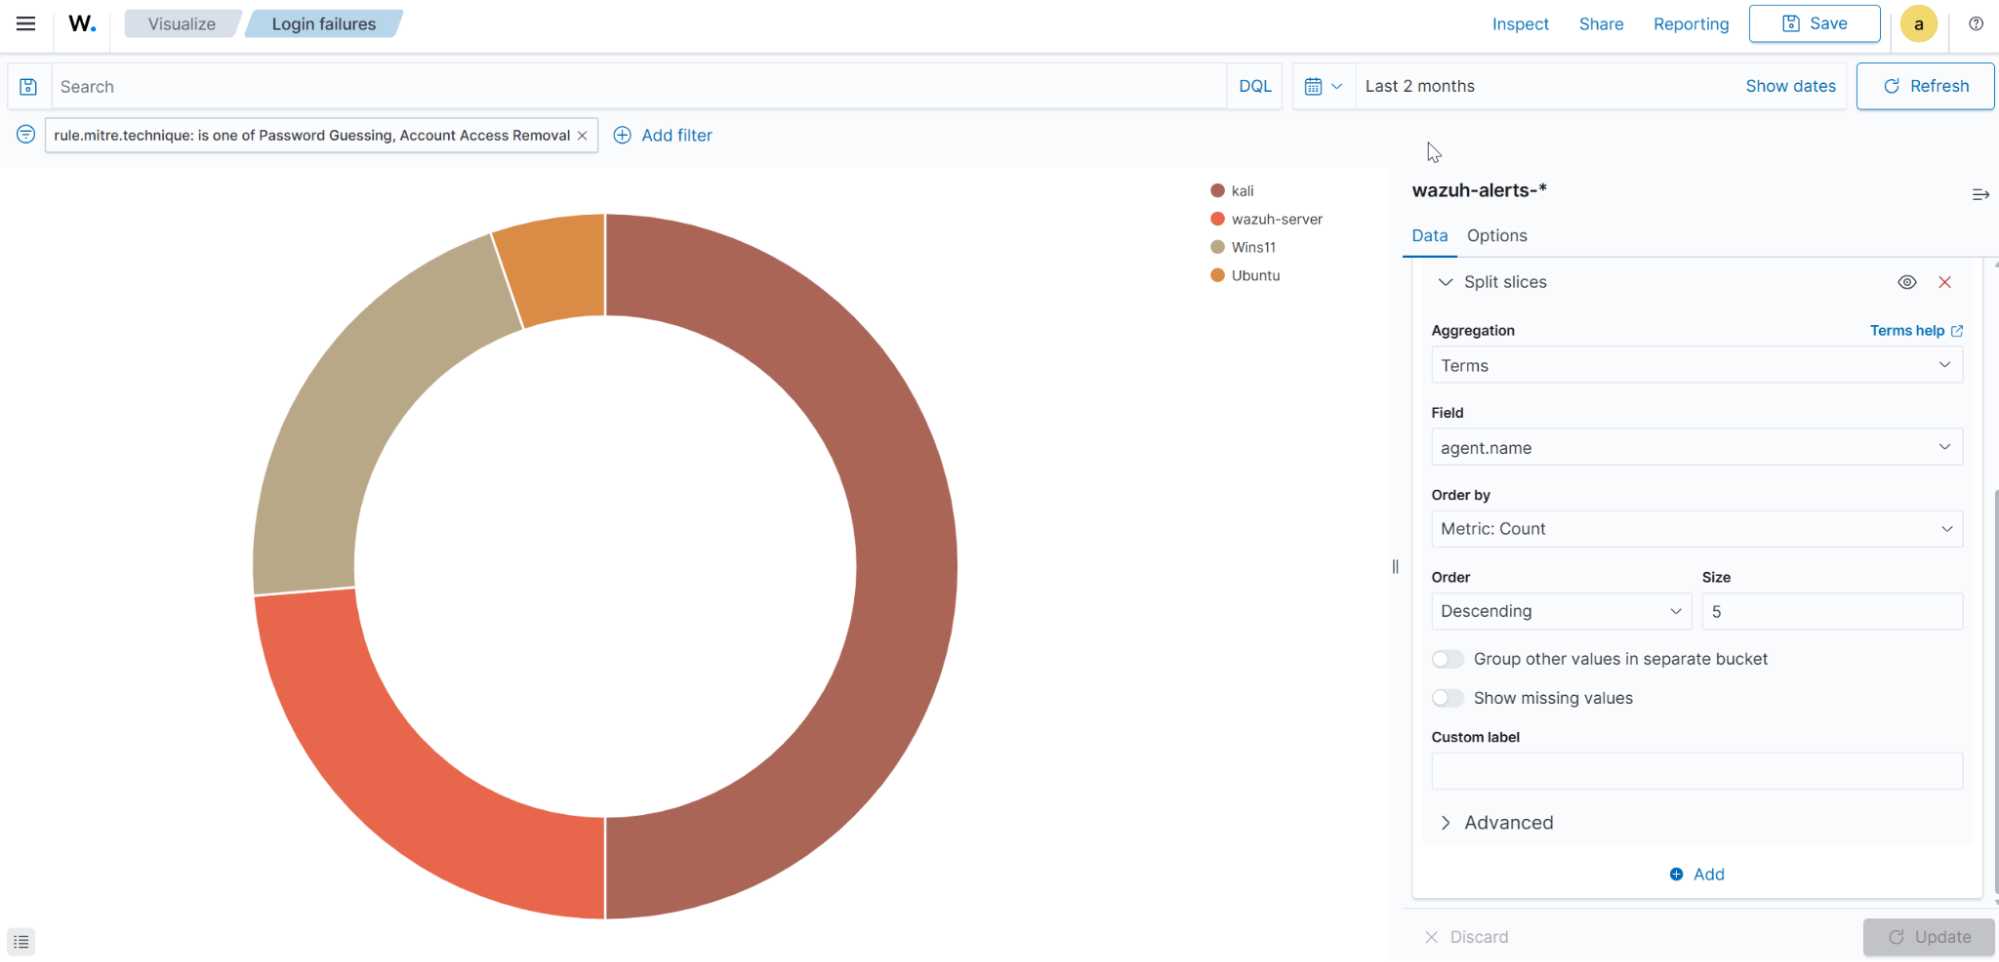
2. Click on Create new visualization, select Pie, and wazuh-alerts-*.
3. Select Count for Aggregation, under Metrics.
4. Add Split slices under Buckets, select Terms for Aggregation, and agent.name for Field, and leave everything else the same.
5. Click Add filter to include the MITRE techniques for detecting failed login attempts on Windows and Linux-based endpoints.
Where:
- Field is
rule.mitre.technique - Operator is
is one of. - Values are
Password Guessing, andAccount Access Removal.
Click on Save.
6. Click on Update and Save the visualization.
Access control visualization
Follow the steps below to create a visualization that displays the active response trigger on your monitored Linux endpoints.
1. Select Visualize, under Explore, from the top left menu.
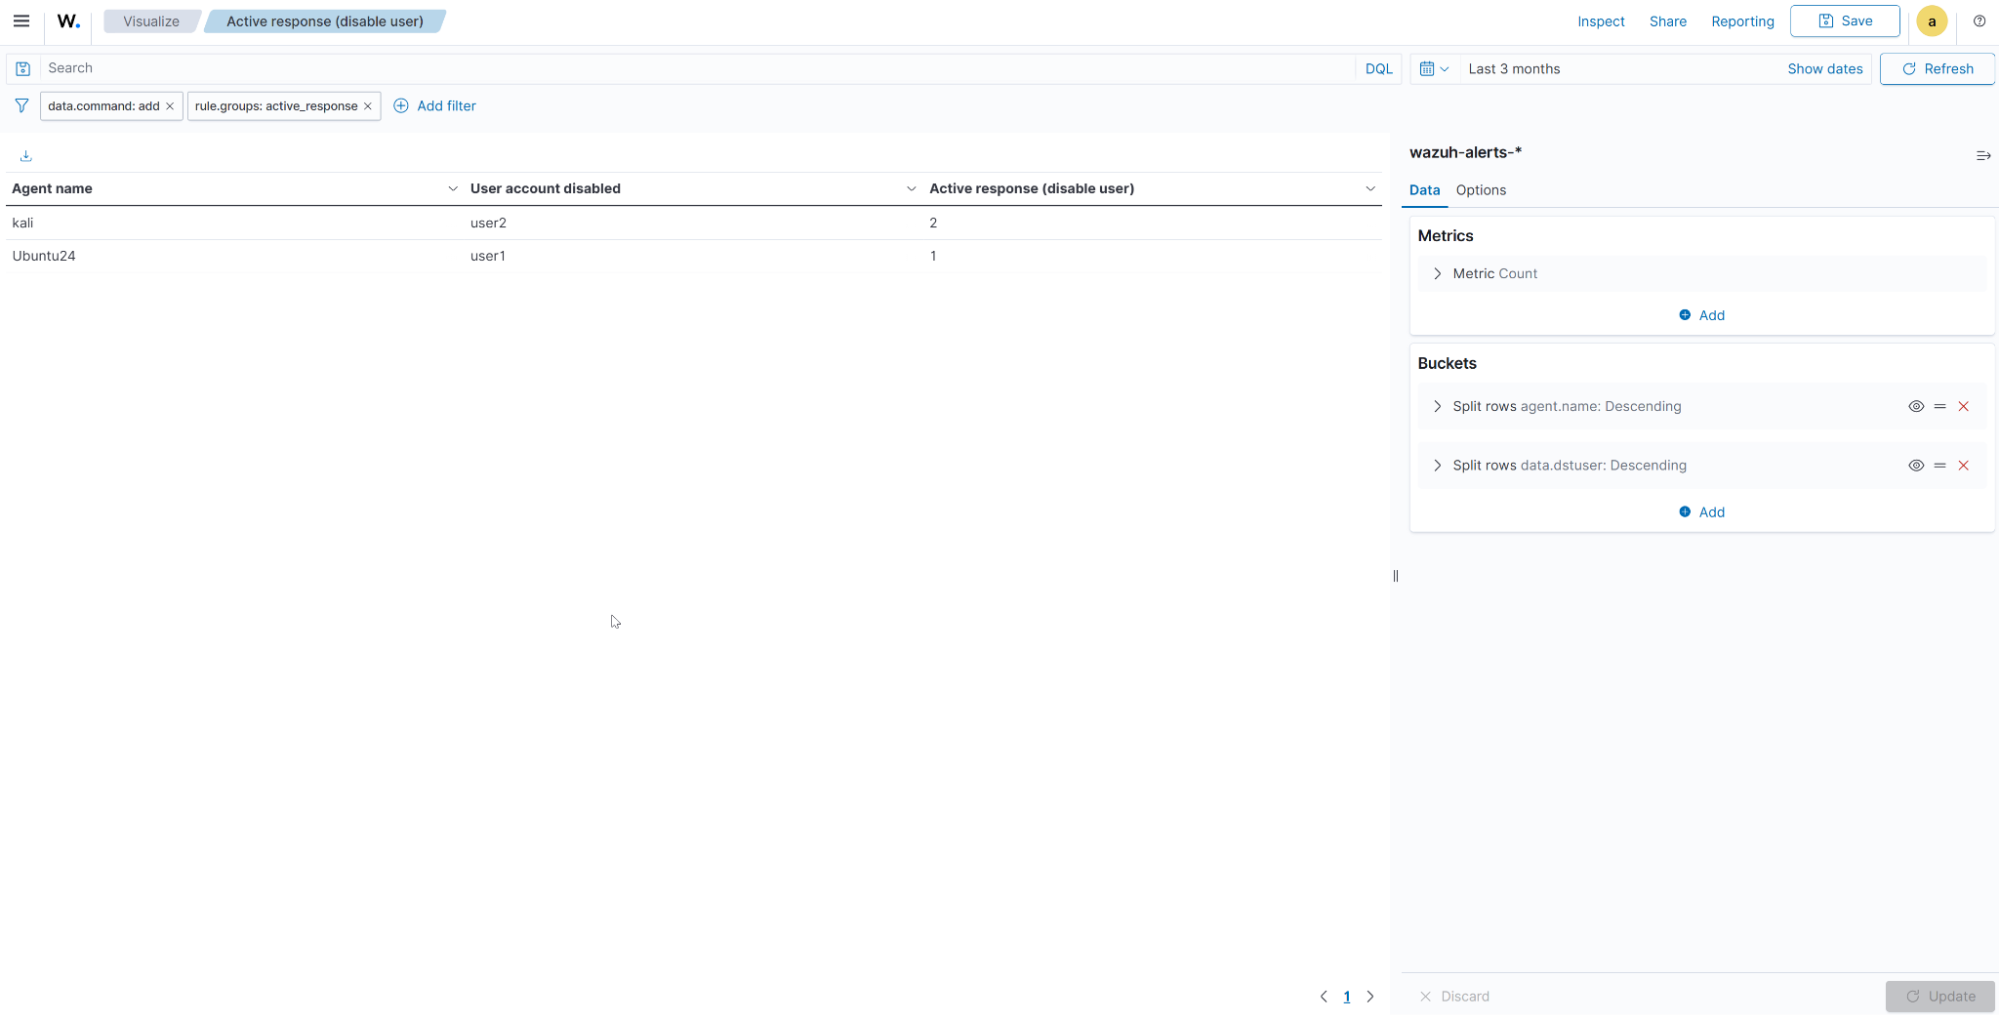
2. Click on Create visualization, select Data Table, and wazuh-alerts-*.
3. Use the following options for the Y-axis under Metrics:
- Aggregation is
Count. - Custom label is
Active response (disable user).
4. Click Add under Buckets and select split rows, with the following settings:
- Aggregation is
Terms. - Field is
agent.name. - Order by is
Metric: Active response (disable user). - Custom label is
User account disabled.
5. Click Add under Buckets and select split rows, and use the following settings:
- Aggregation is
Terms. - Field is
data.dstuser. - Order by is
Metric: Active response (disable user). - Custom label is
User account disabled.
6. Click on Update and Save the visualization.
7. Click Add filter to only show data for the active response command that adds the user to the disable list.
Where:
- Field is
data.command. - Operator is
is. - Values is
add.
Click on Save.
8. Add a filter to limit this visualization to active response alerts.
Where:
- Field is
rule.groups. - Operator is
is. - Value is
active_response.
Click on Save.
Risk assessment visualization
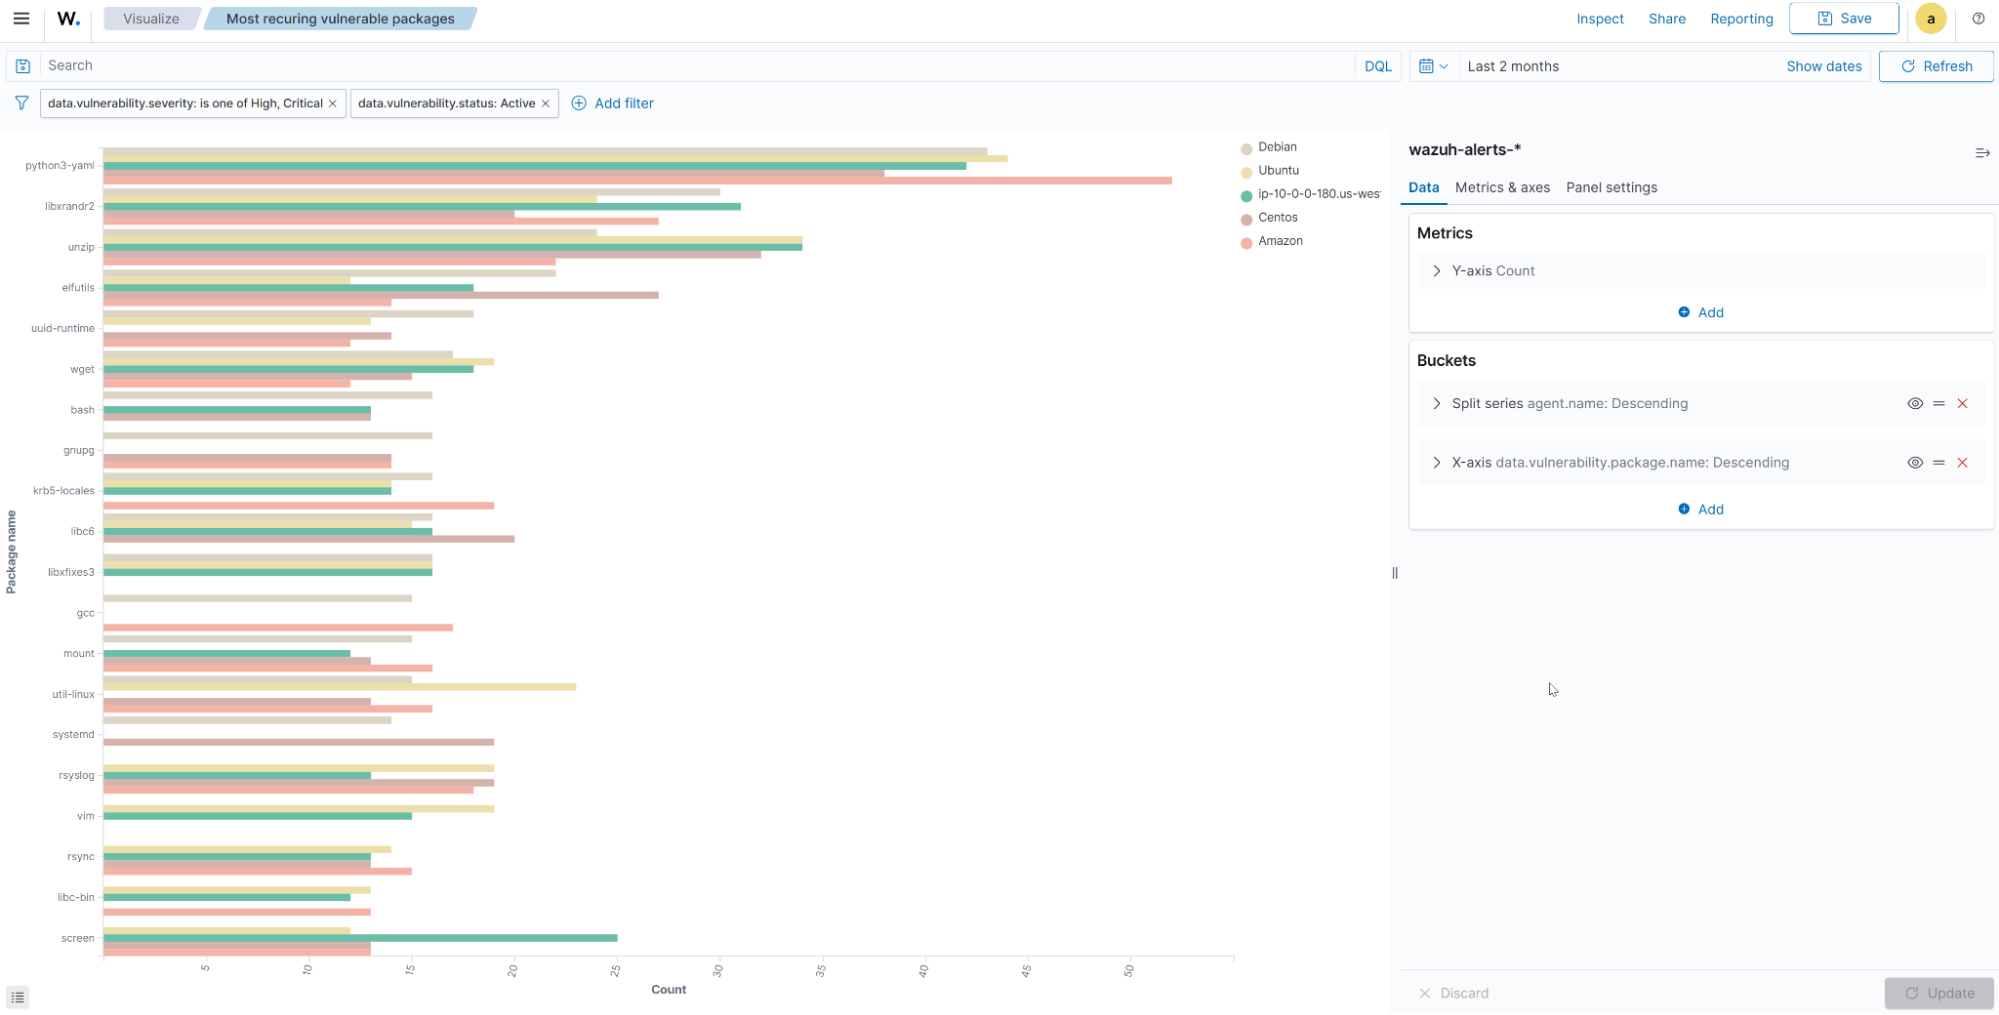
The steps below show you how to visualize this control by centralizing events for the most recurring vulnerable packages on monitored endpoints in your infrastructure.
1. Select Visualize, under Explore, from the top left menu.
2. Click on Create visualization, select Horizontal Bar, and wazuh-alerts-*.
3. Select count for Aggregation, under the Y-axis for Metrics.
4. Add a split series under Buckets, and use the following settings.
Where:
- Aggregation is
Terms. - Field is
agent.name. - Order by is
Metric: Count.
5. Click on Add to add a sub-bucket, select X-axis, and use the following settings.
Where:
- Sub aggregation is
Terms. - Field is
data.vulnerability.package.name. - Order by is
Metric: Count. - Size is
15. - Custom label is
Package name.
6. Click Add filter to only show data for high and critical severity vulnerabilities.
Where:
- Field is
data.vulnerability.severity. - Operator is
is one of. - Values are
HighandCritical.
Click on Save.
The Wazuh vulnerability detection for Windows does not show the vulnerable package name.
7. Add a filter to only include active, unresolved, vulnerable packages.
Where:
- Field is
data.vulnerability.status. - Operator is
is. - Value is
Active.
Click on Save.
8. Click on Update and Save the visualization.
Note
You can install the sample data under Indexer management > Sample data to enrich the visualization for the most recurring vulnerable packages. Remember to remove the data when you no longer need it to prevent false positives and maintain data integrity.
Adding visualizations to the dashboard
Follow the steps below to add the previously created visualization to a dashboard.
1. Select Dashboards, under Explore, from the top left menu.
2. Click on Create Dashboard.
3. Click on Add to include your previously created visualizations.
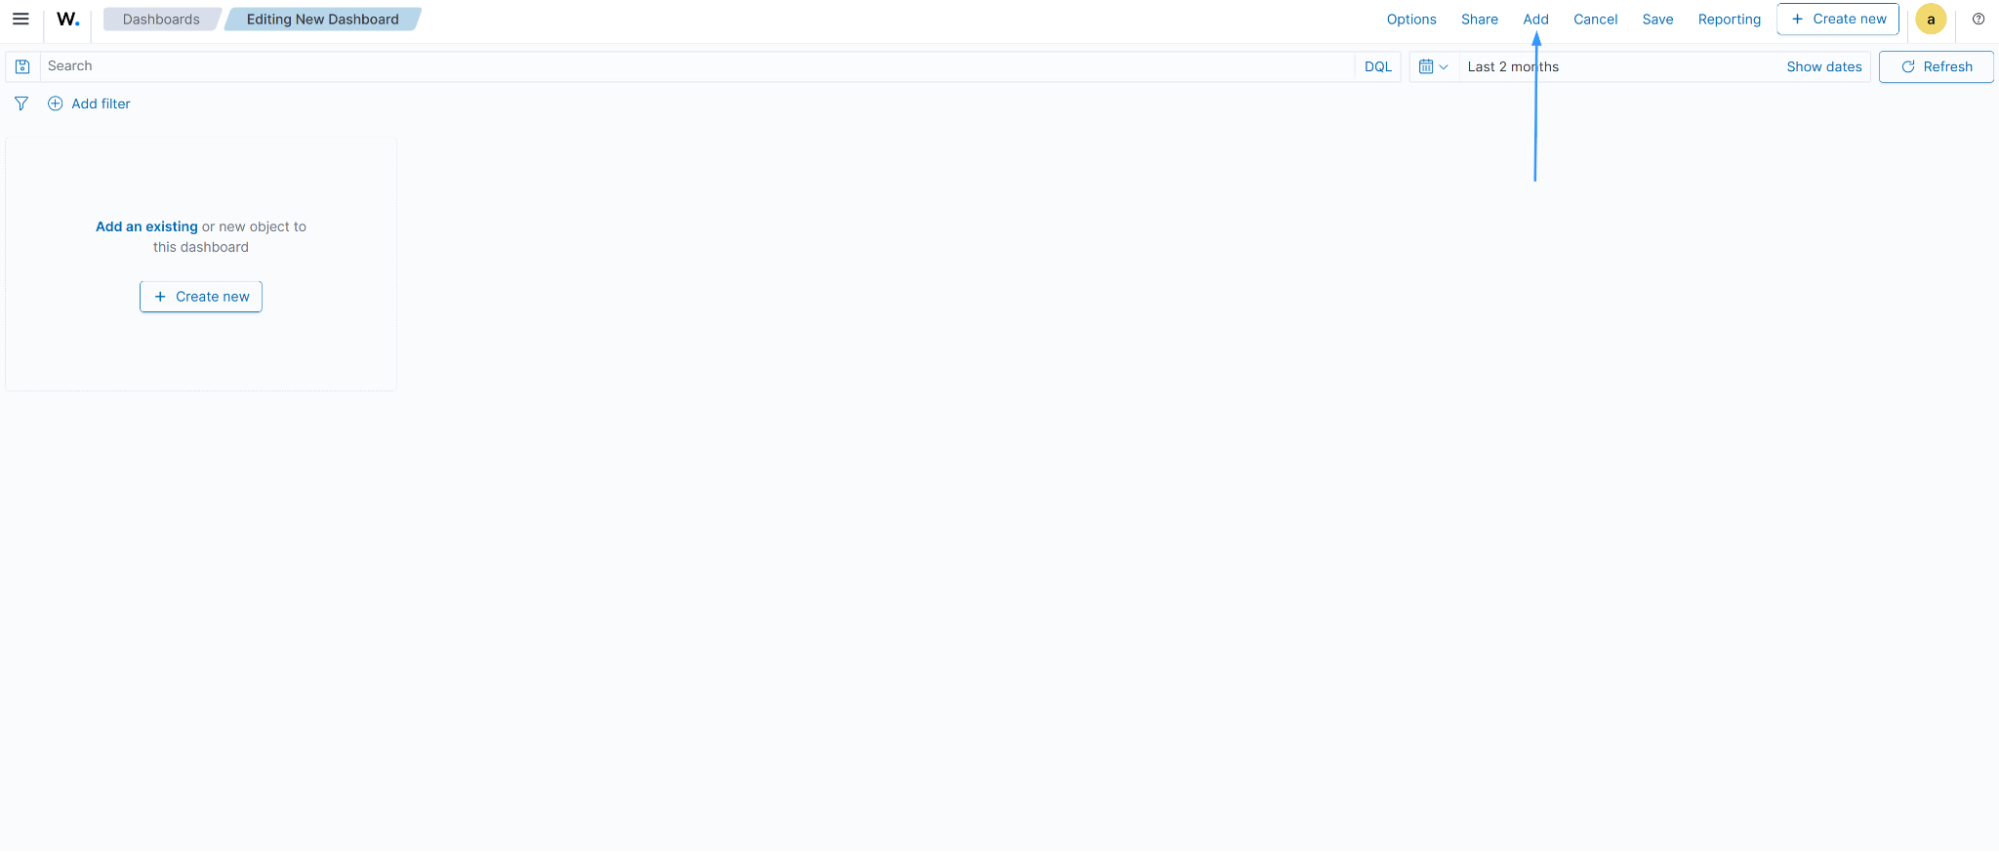
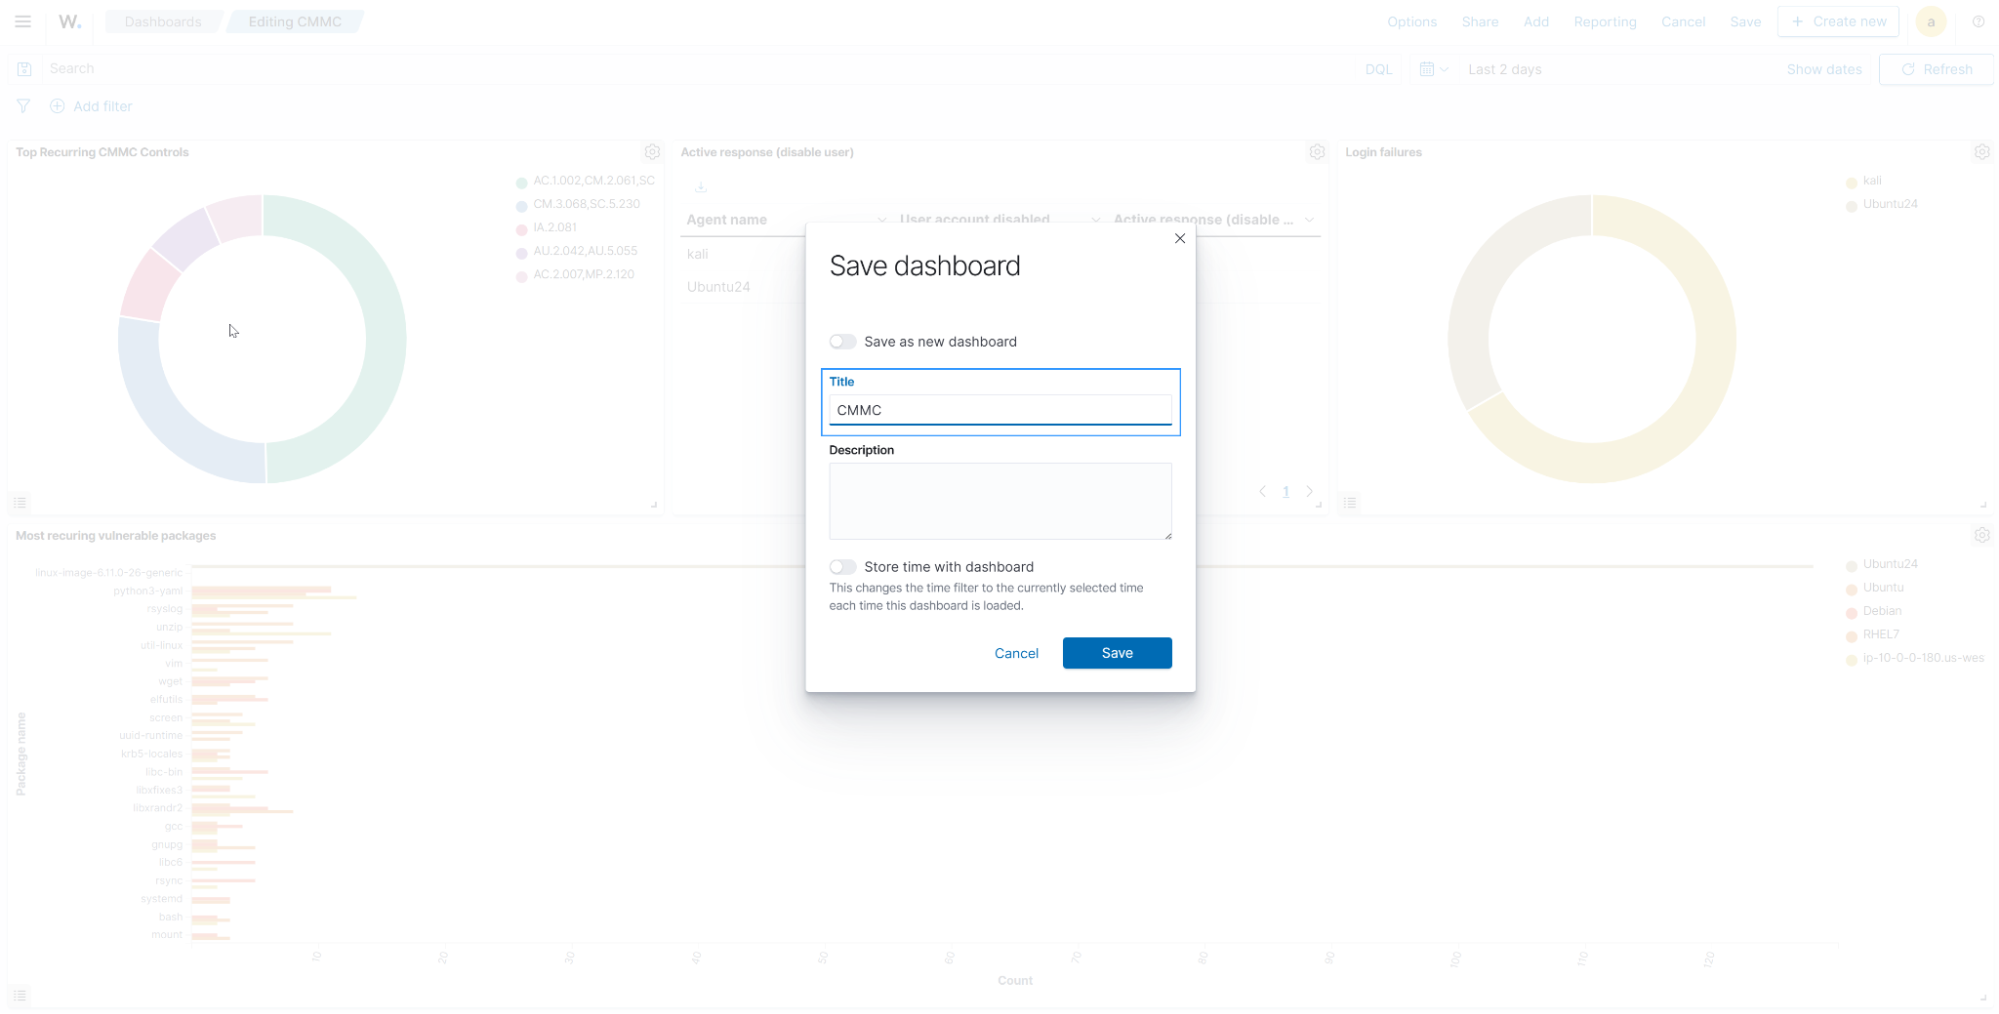
4. Click Save, input a name for your dashboard, and save.
Importing the custom CCMC Wazuh dashboard
Perform the following steps to import the custom CMMC Wazuh dashboard containing all the visualizations for the CMMC controls we created earlier:
Note
These steps should be done as an alternative to creating the visualizations and dashboard manually.
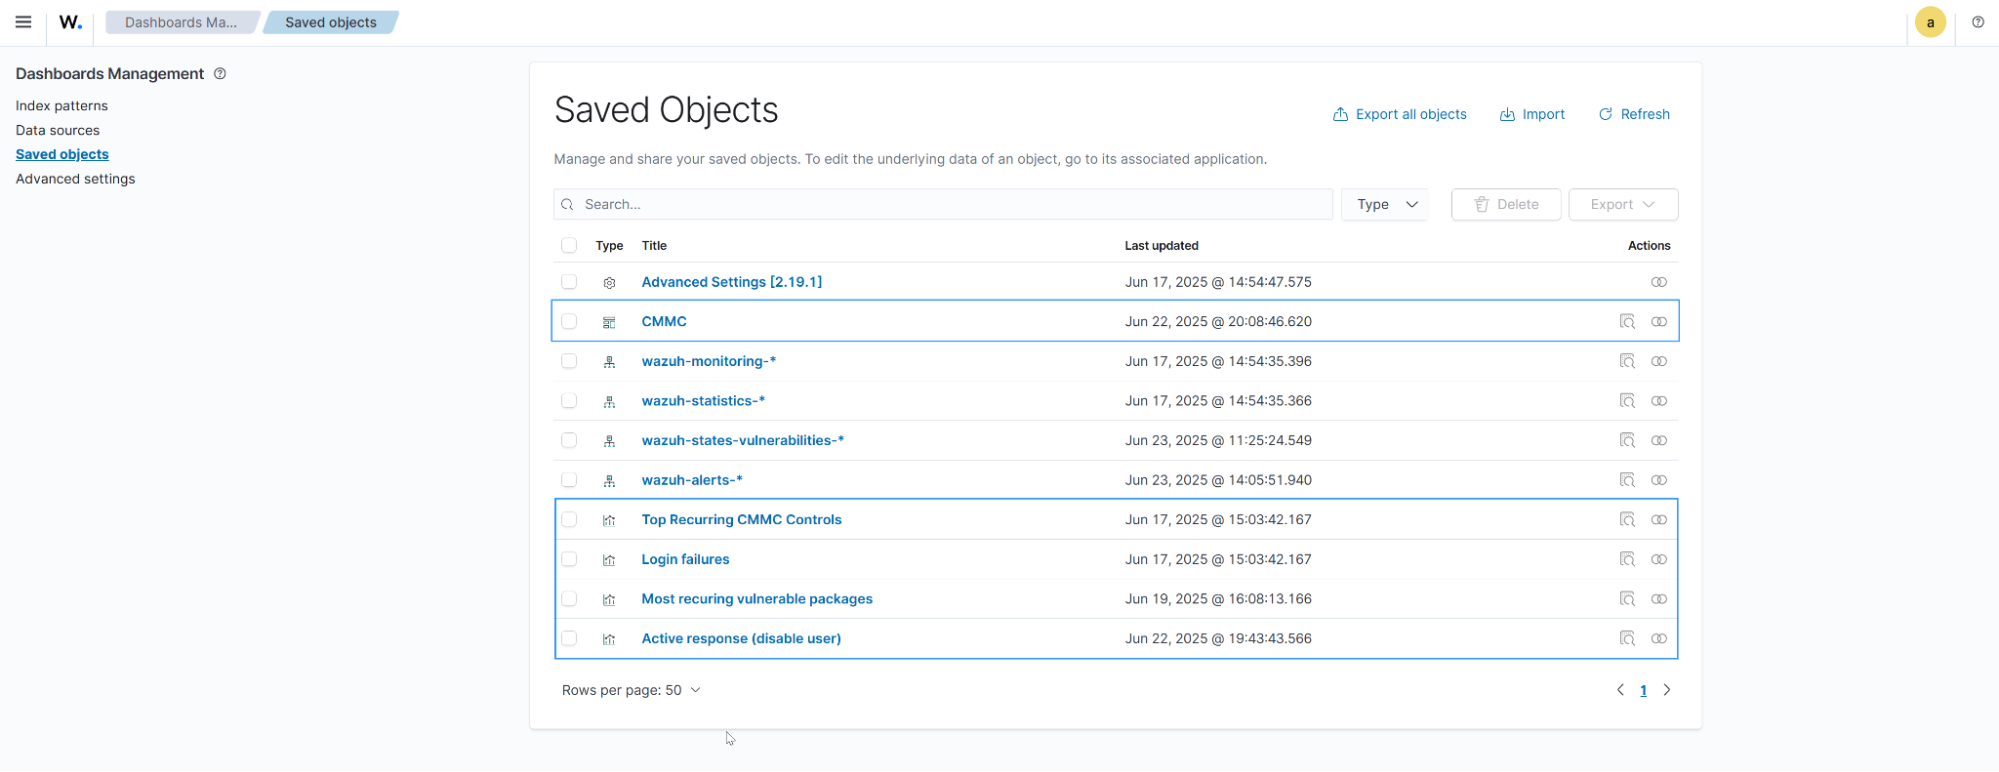
- Download the export.ndjson file to the endpoint you access the Wazuh dashboard from.
- Navigate to Dashboard management > Dashboards Management > Saved objects.
- Click Import in the top right-hand corner of the screen.
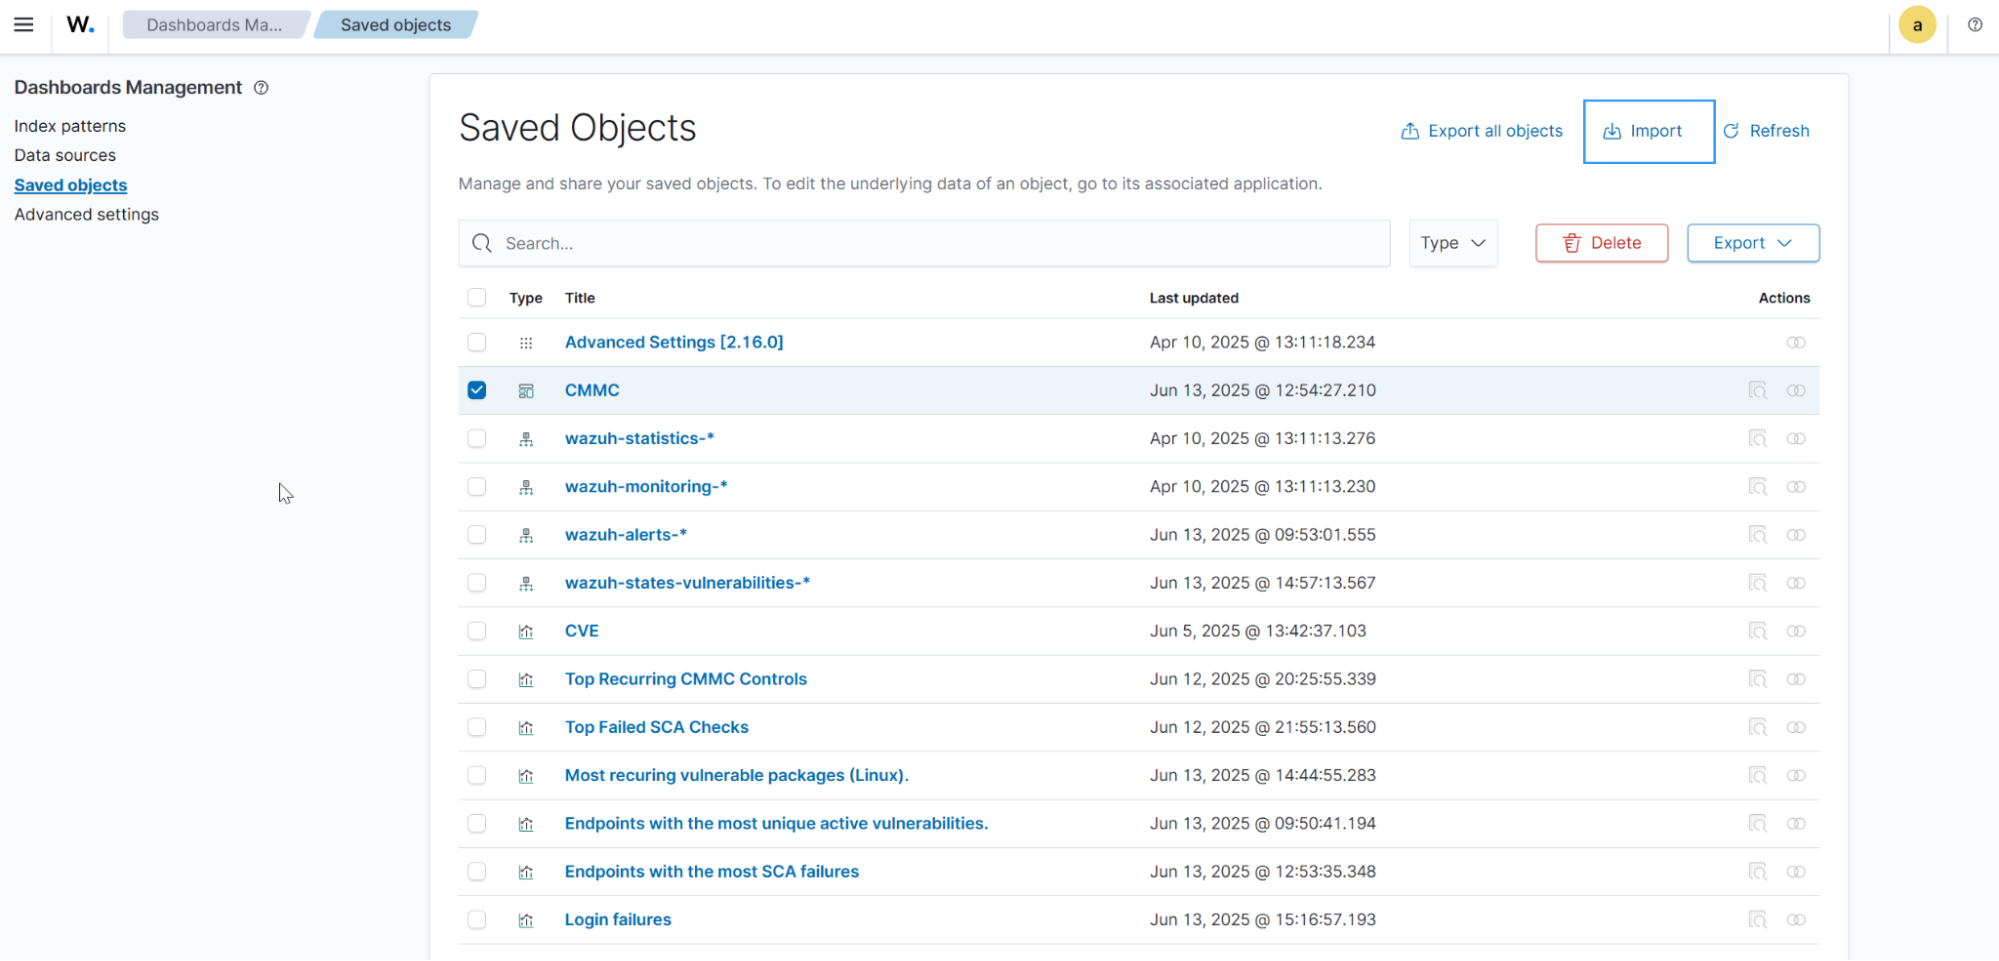
- Select the
export.ndjsonfile downloaded earlier, set the import options to “Request action on conflict”, and click Import.
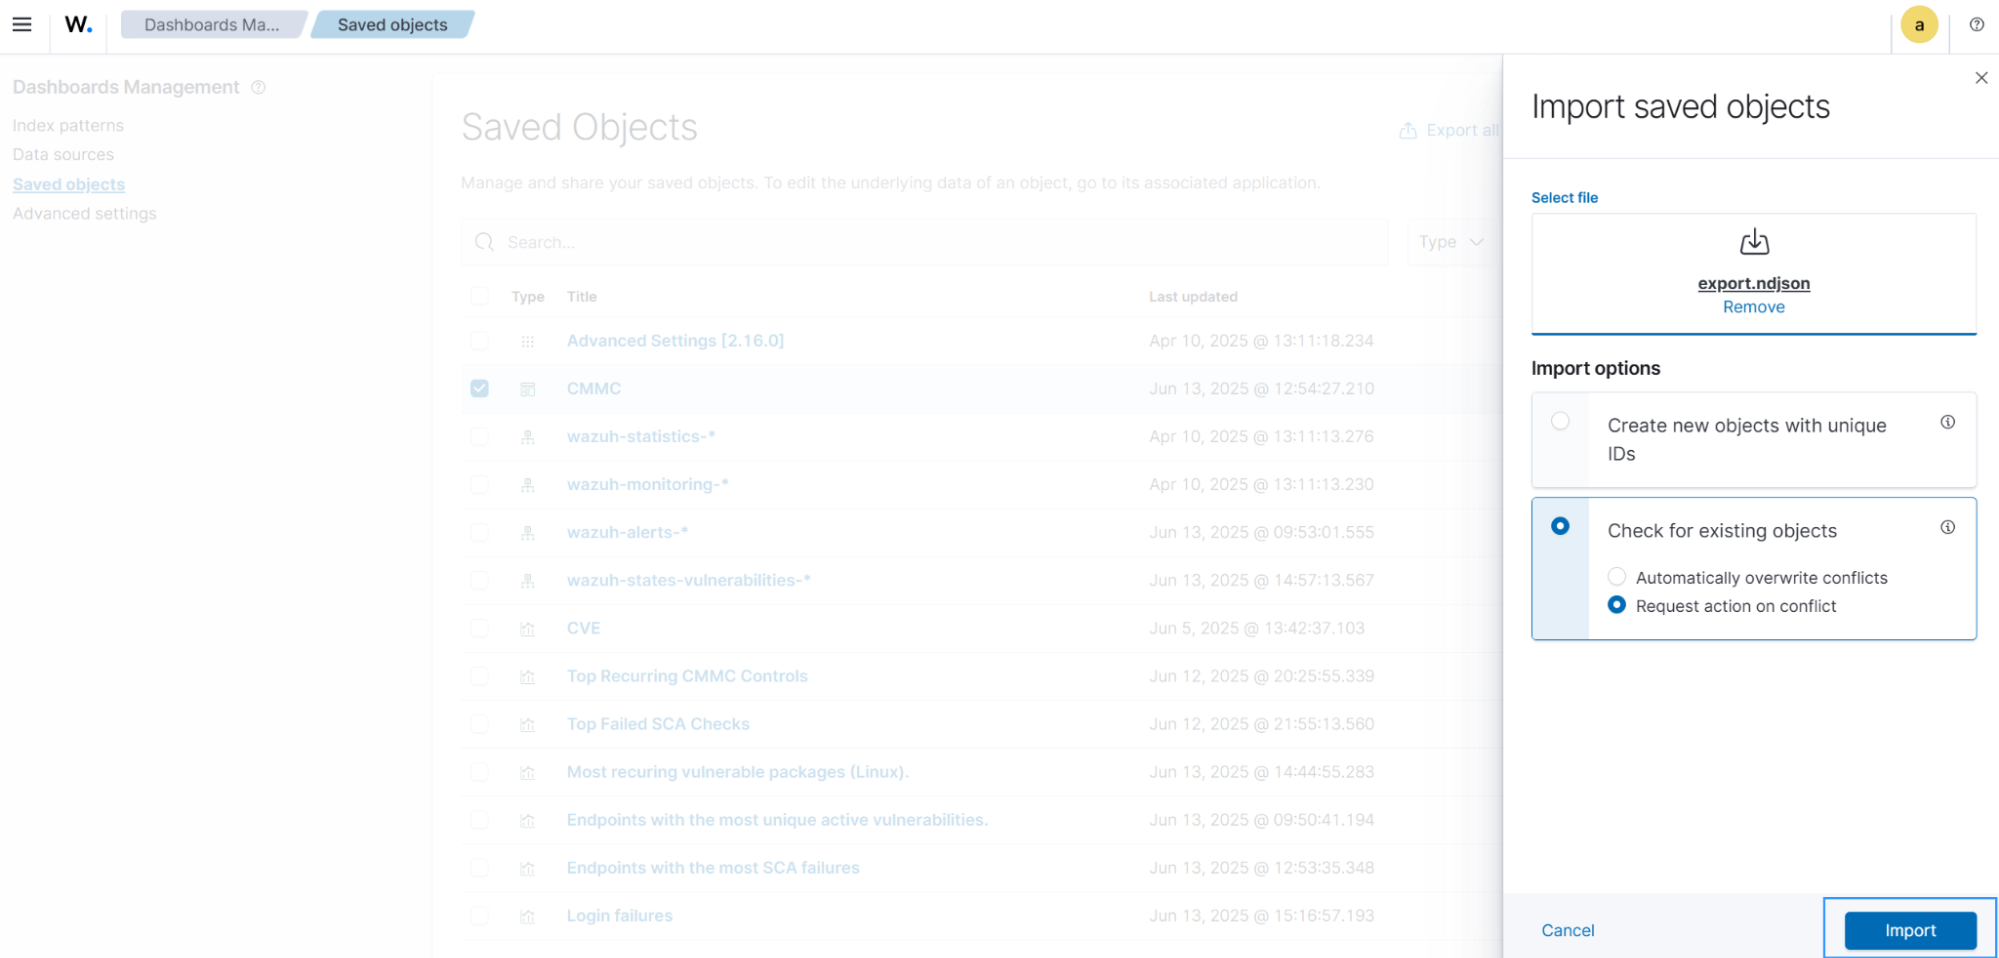
- Click Skip if you see a pop-up about a conflict in the
wazuh-alerts-*index pattern. - Click Done when the import is complete.
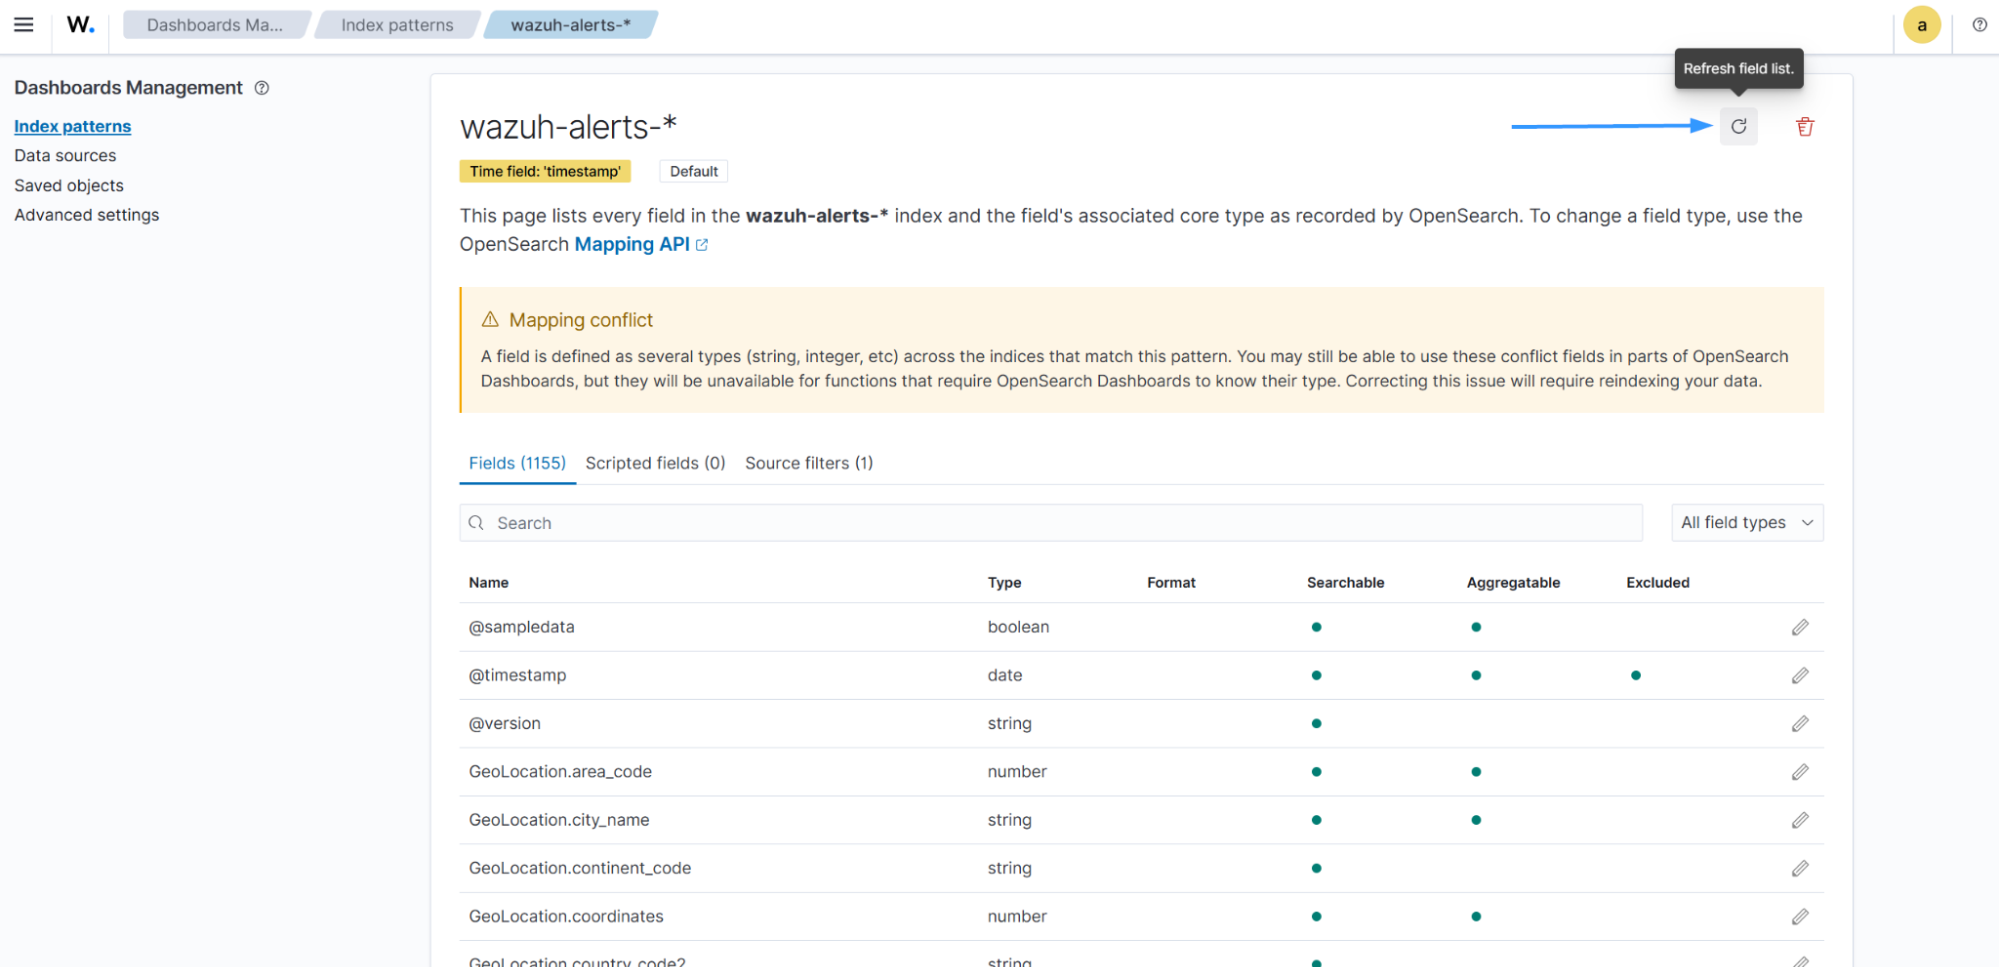
- Navigate to Dashboard management > Dashboards Management > Index patterns, select the
wazuh-alerts-*index. Click the refresh button in the top-right corner of the page to refresh the index pattern.
- Navigate to Explore > Dashboards, and select the CMMC dashboard to see the visualizations.
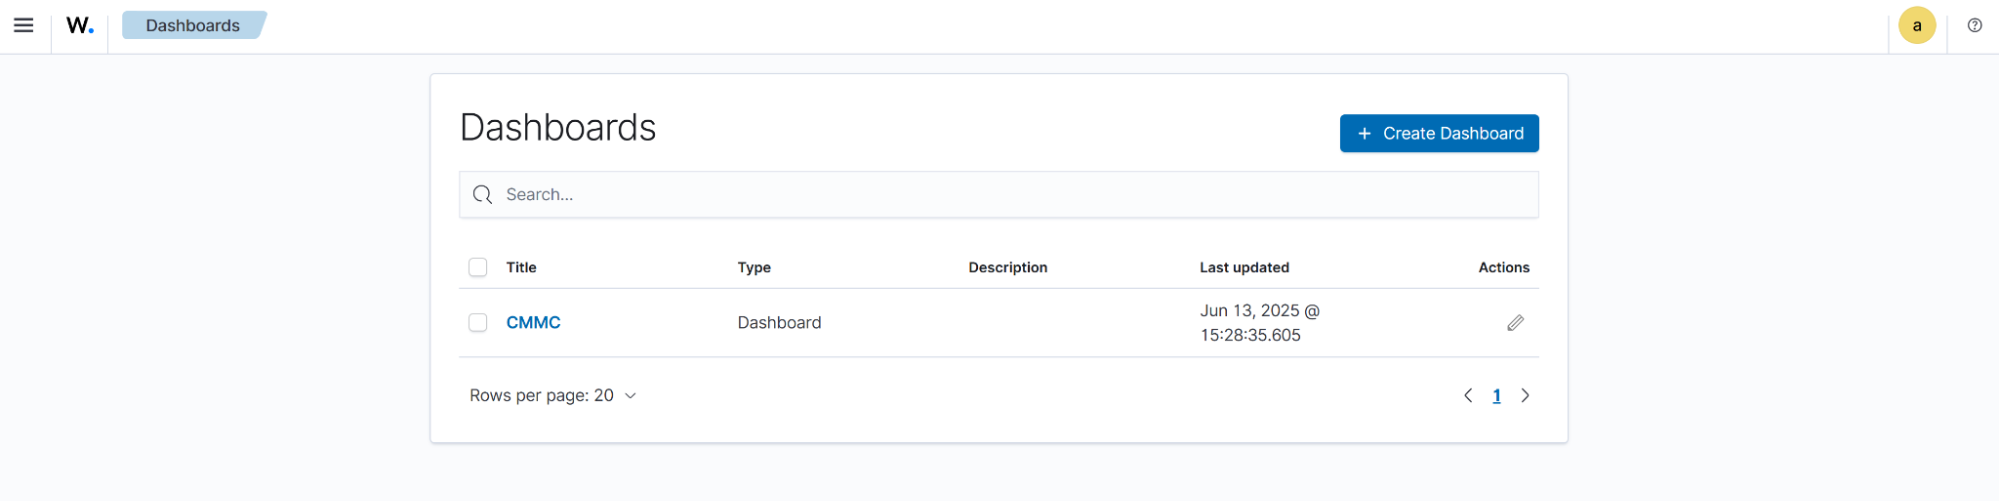
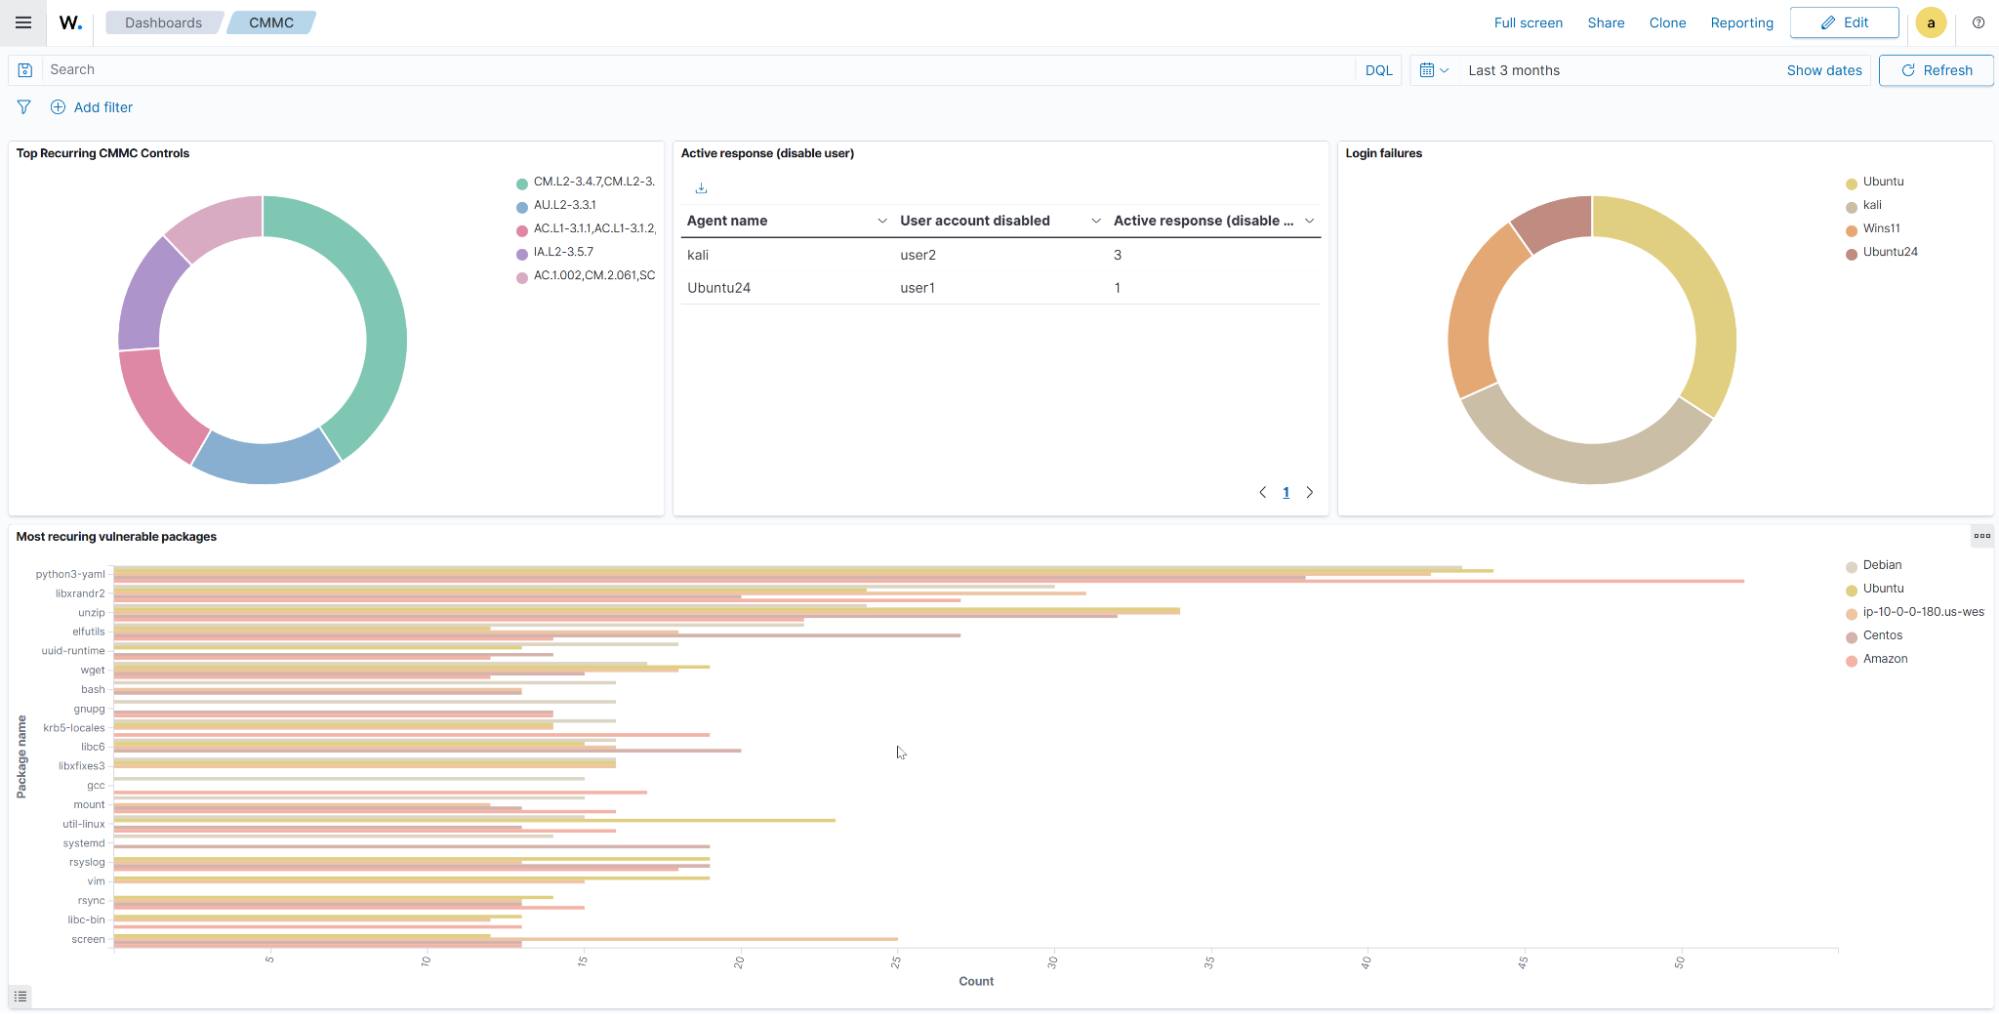
We show an example of what the CMMC metrics dashboard looks like in the image below:
Conclusion
Organizations can align their security operations with Department of Defense standards by monitoring their infrastructure using Wazuh capabilities. They can leverage Wazuh native capabilities, such as log data analysis, active response, and vulnerability management, to protect their digital assets and build actionable dashboards for CMMC Level 2 and 3 requirements. Integrating Wazuh into your compliance strategy creates a scalable foundation for meeting evolving regulatory demands.
You can ask questions about this blog post and other topics related to Wazuh in any of our community channels.