We use the following endpoints and simple use cases to demonstrate some Wazuh Cloud capabilities.

Requirements: Install the Wazuh agent on any or all of these endpoints - Windows, Linux, and macOS.
Estimated time: 20 minutes

Sample testing

Please refer to the Wazuh documentation for more information about other use cases.

Security Configuration Assessment (SCA)

Wazuh provides a Security Configuration Assessment (SCA) module that performs scans to detect misconfigurations and exposures on monitored endpoints and recommends remediation actions.

We demonstrate how to identify misconfigurations and system hardening settings on Windows, Ubuntu, and macOS endpoints.

Identifying a failed SCA check

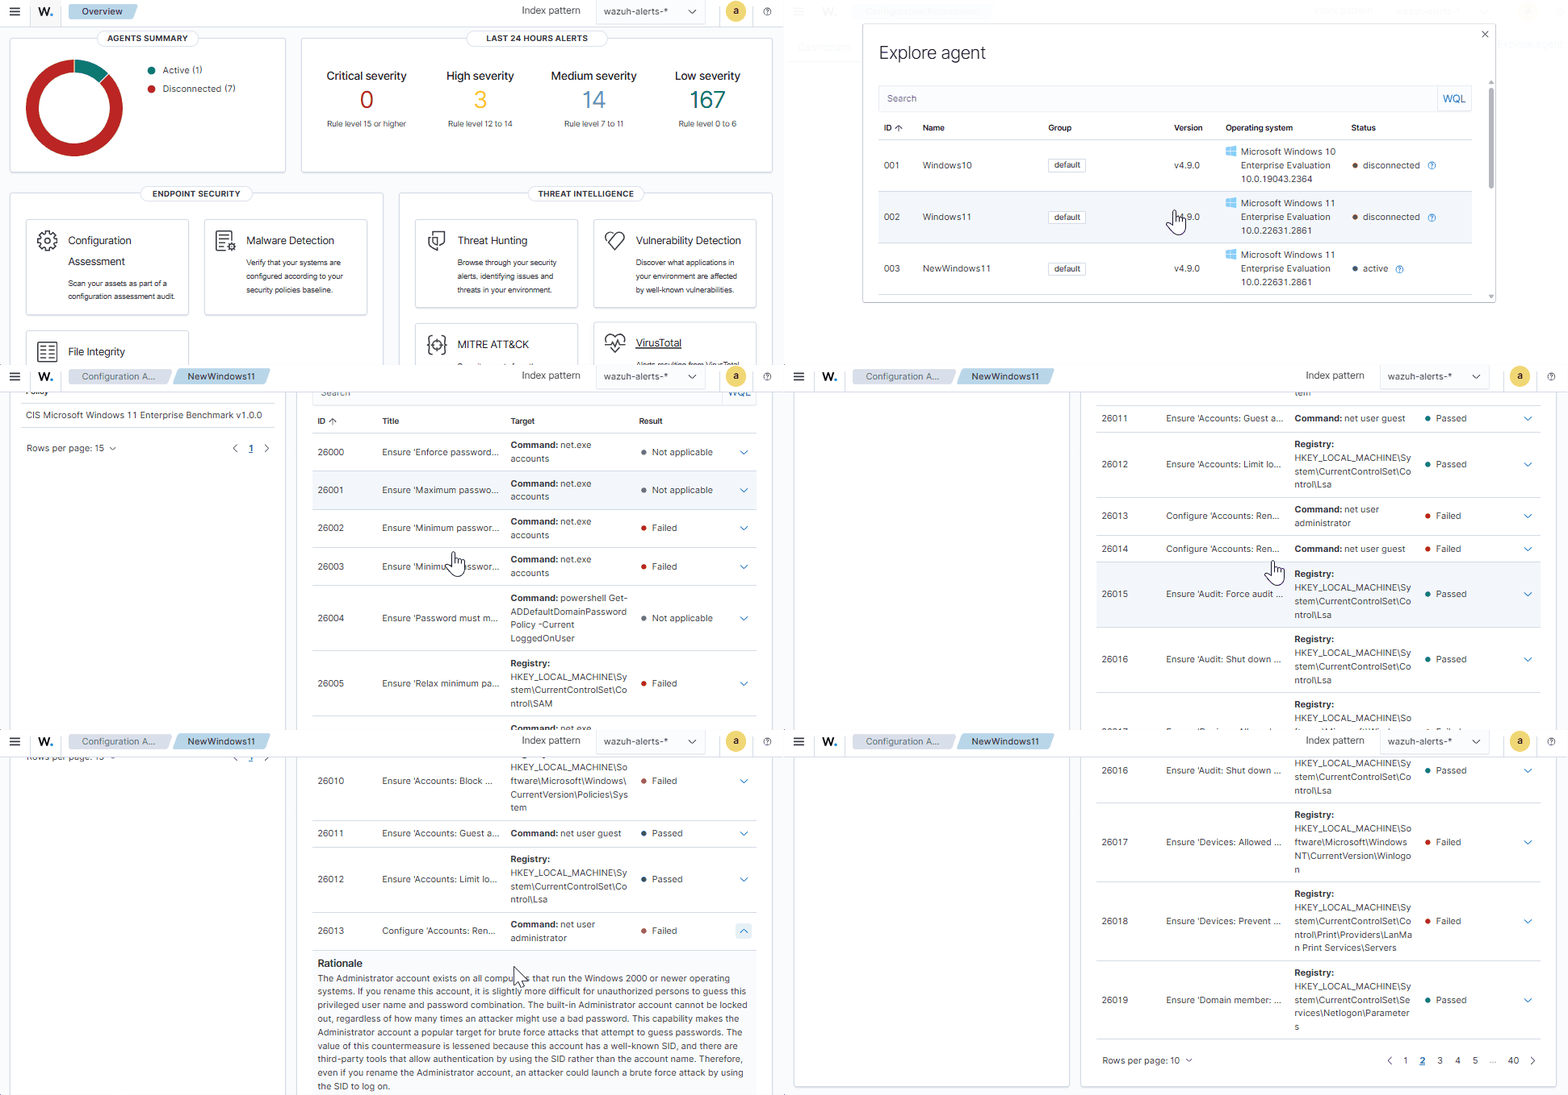
  1. Select Configuration Assessment under Endpoint Security.
  2. Click Select agent to view the list of monitored endpoints.
  3. Select the Windows endpoint to view the SCA policy, in our case - CIS Microsoft Windows 11 Enterprise Benchmark v3.0.0.
  4. Click on any failed SCA check, in our case, the SCA check with ID 26013, to view the remediation recommendations.
Remediation process

  1. Implement the recommended action on the Windows endpoint to remediate this.
  2. Restart the Wazuh agent and refresh the Wazuh dashboard.
  3. Navigate to the Events tab to view the remediation actions carried out.
  4. Select the remediated entry to view more details. Status changed from failed to passed.

Identifying a failed SCA check

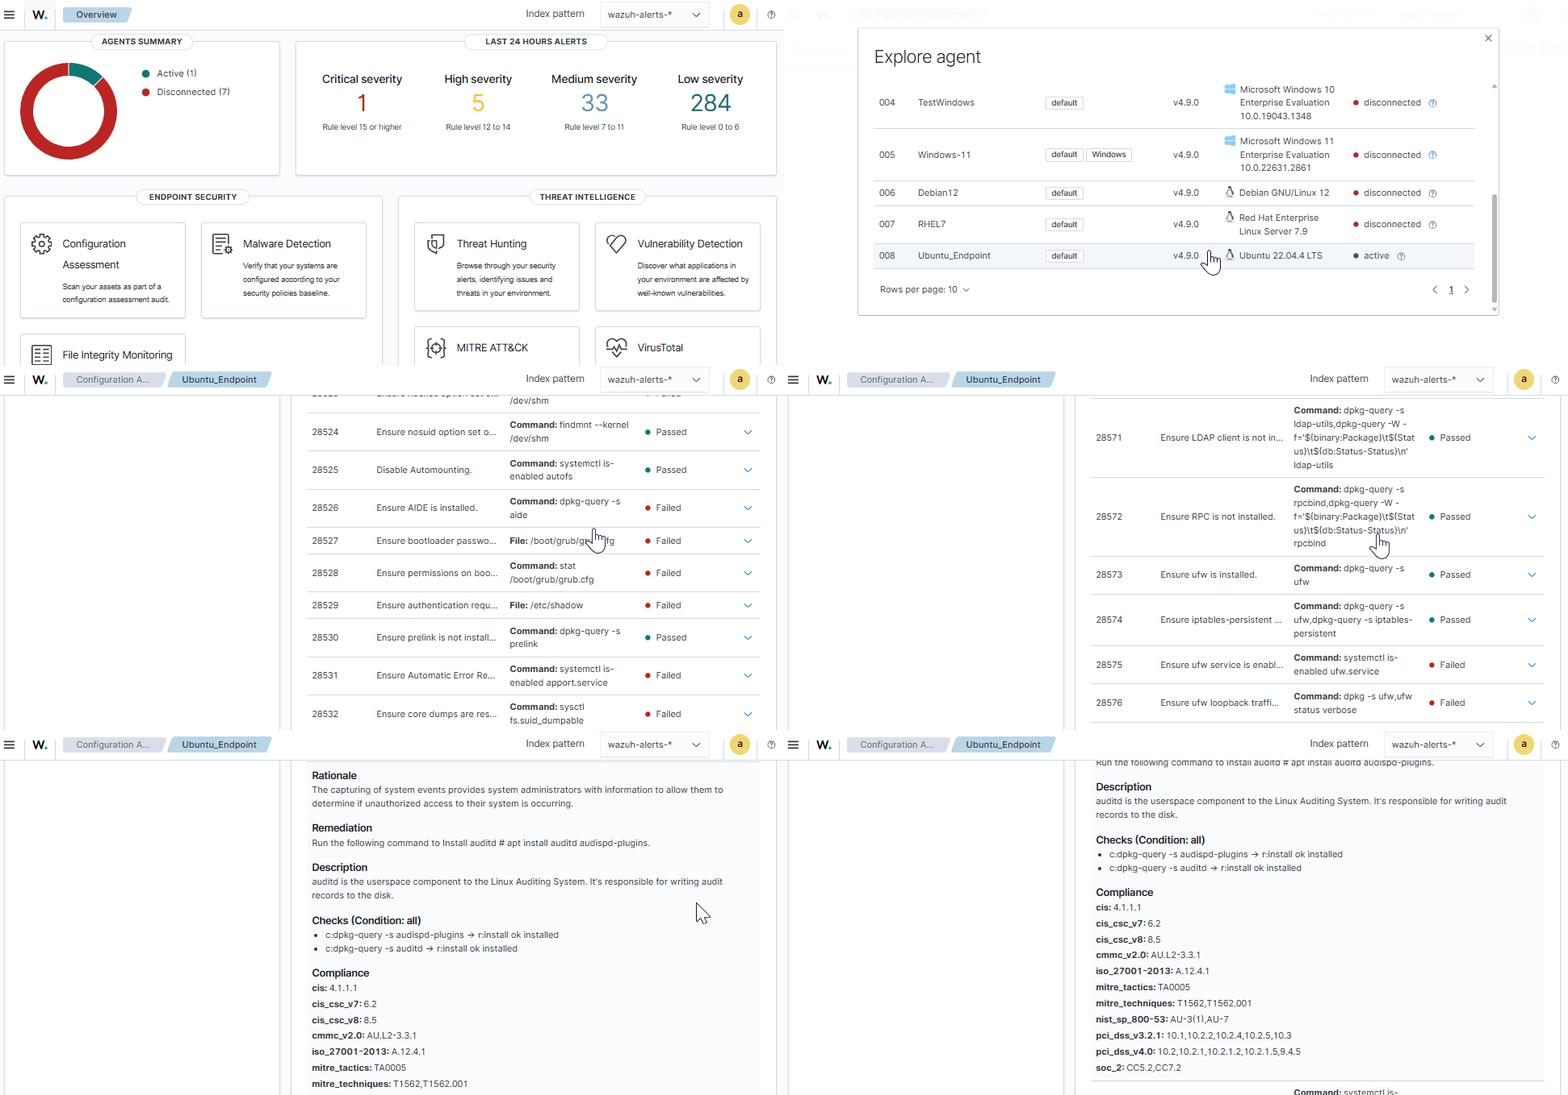
  1. Select Configuration Assessment under Endpoint Security.
  2. Click Select agent to view the list of monitored endpoints.
  3. Select the Ubuntu 24 endpoint to view the SCA policy, in our case - CIS Ubuntu Linux 24.04 LTS Benchmark v1.0.0.
  4. Click on any failed SCA check, in our case, the SCA check with ID 28590, to view the remediation recommendations.
Remediation process

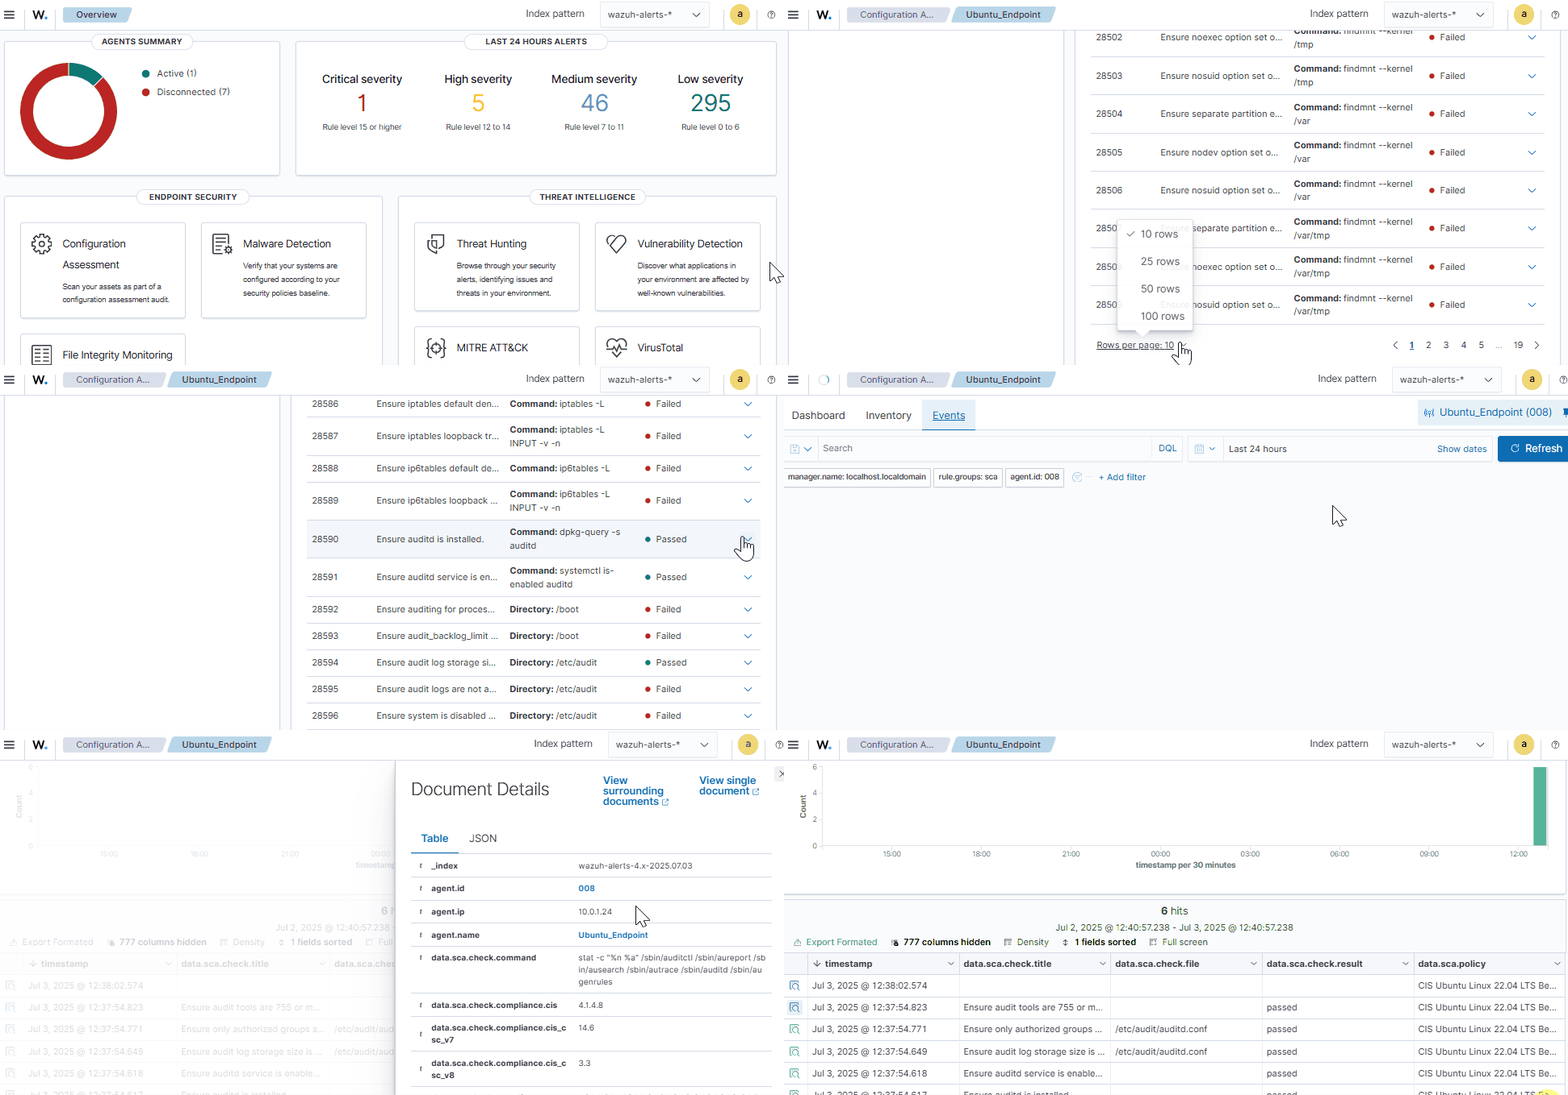
  1. Implement the recommended action on the Linux endpoint to remediate this.
  2. Restart the Wazuh agent and refresh the Wazuh dashboard.
  3. Navigate to the Events tab to view the remediation actions that were carried out.
  4. Select the remediated entry to view more details. Status changed from failed to passed.
Identifying a failed SCA check

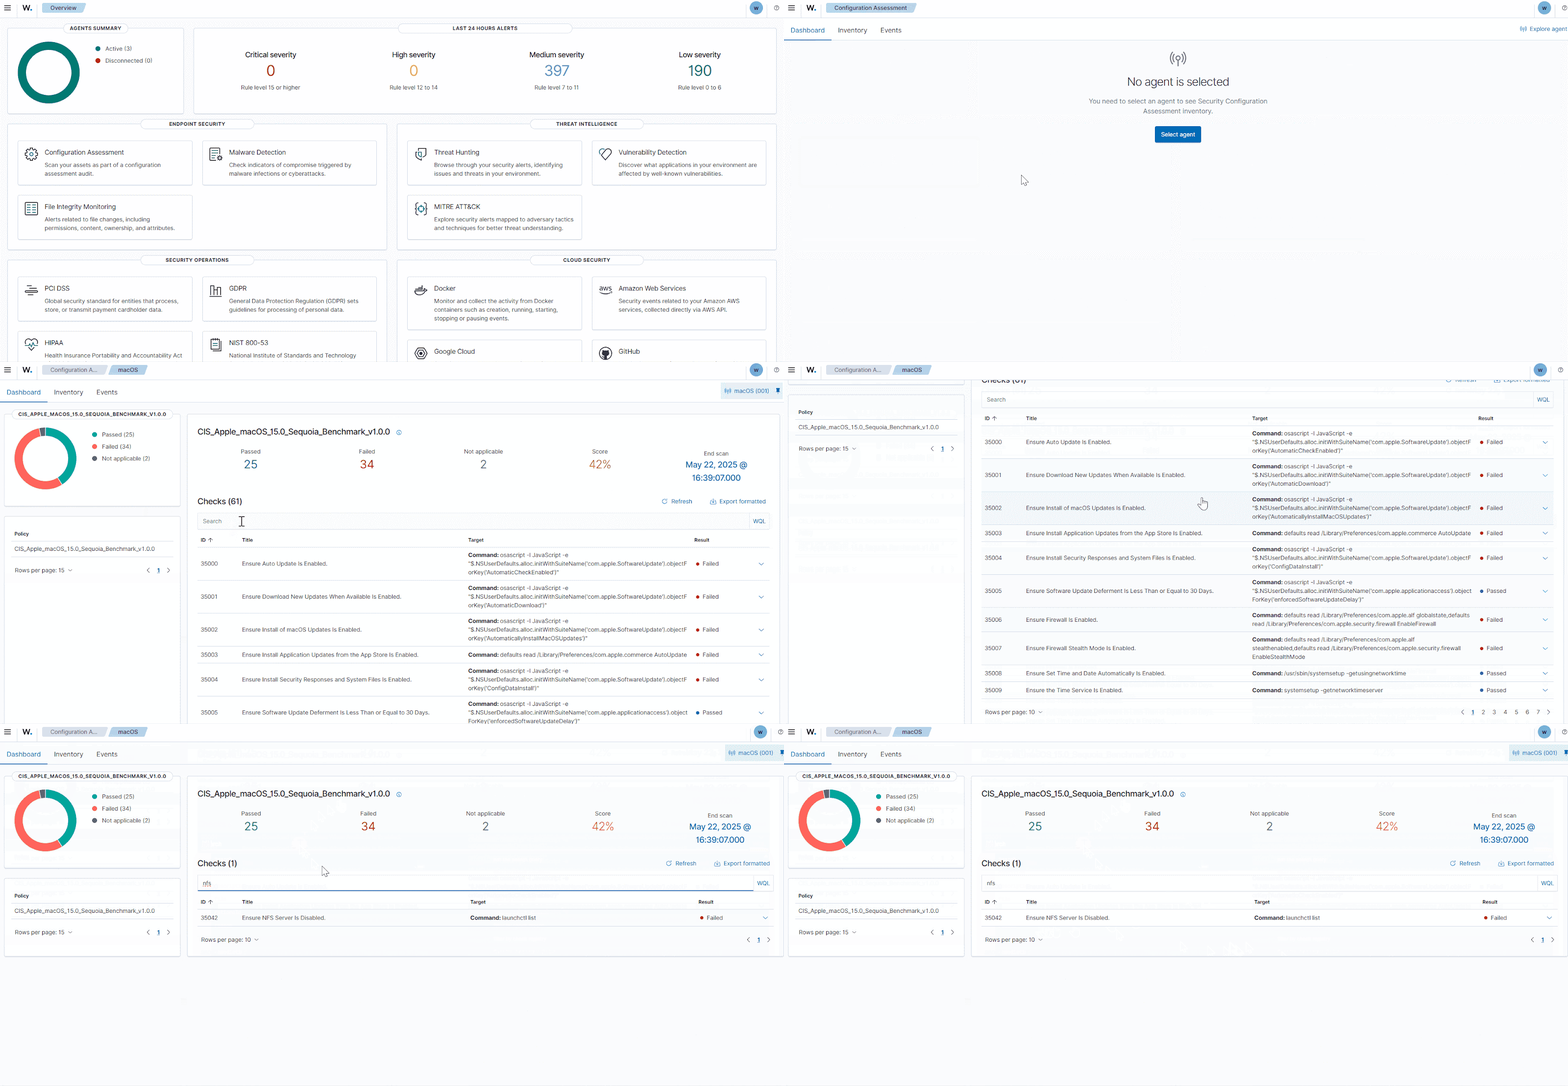
  1. Select Configuration Assessment under Endpoint Security.
  2. Click Select agent to view the list of monitored endpoints.
  3. Select the macOS endpoint to view the SCA policy, in our case - CIS_Apple_macOS_15.0_Sequoia_Benchmark_v1.0.0.
  4. Click on the failed SCA check with ID 35042 to view the remediation recommendations.
Remediation process

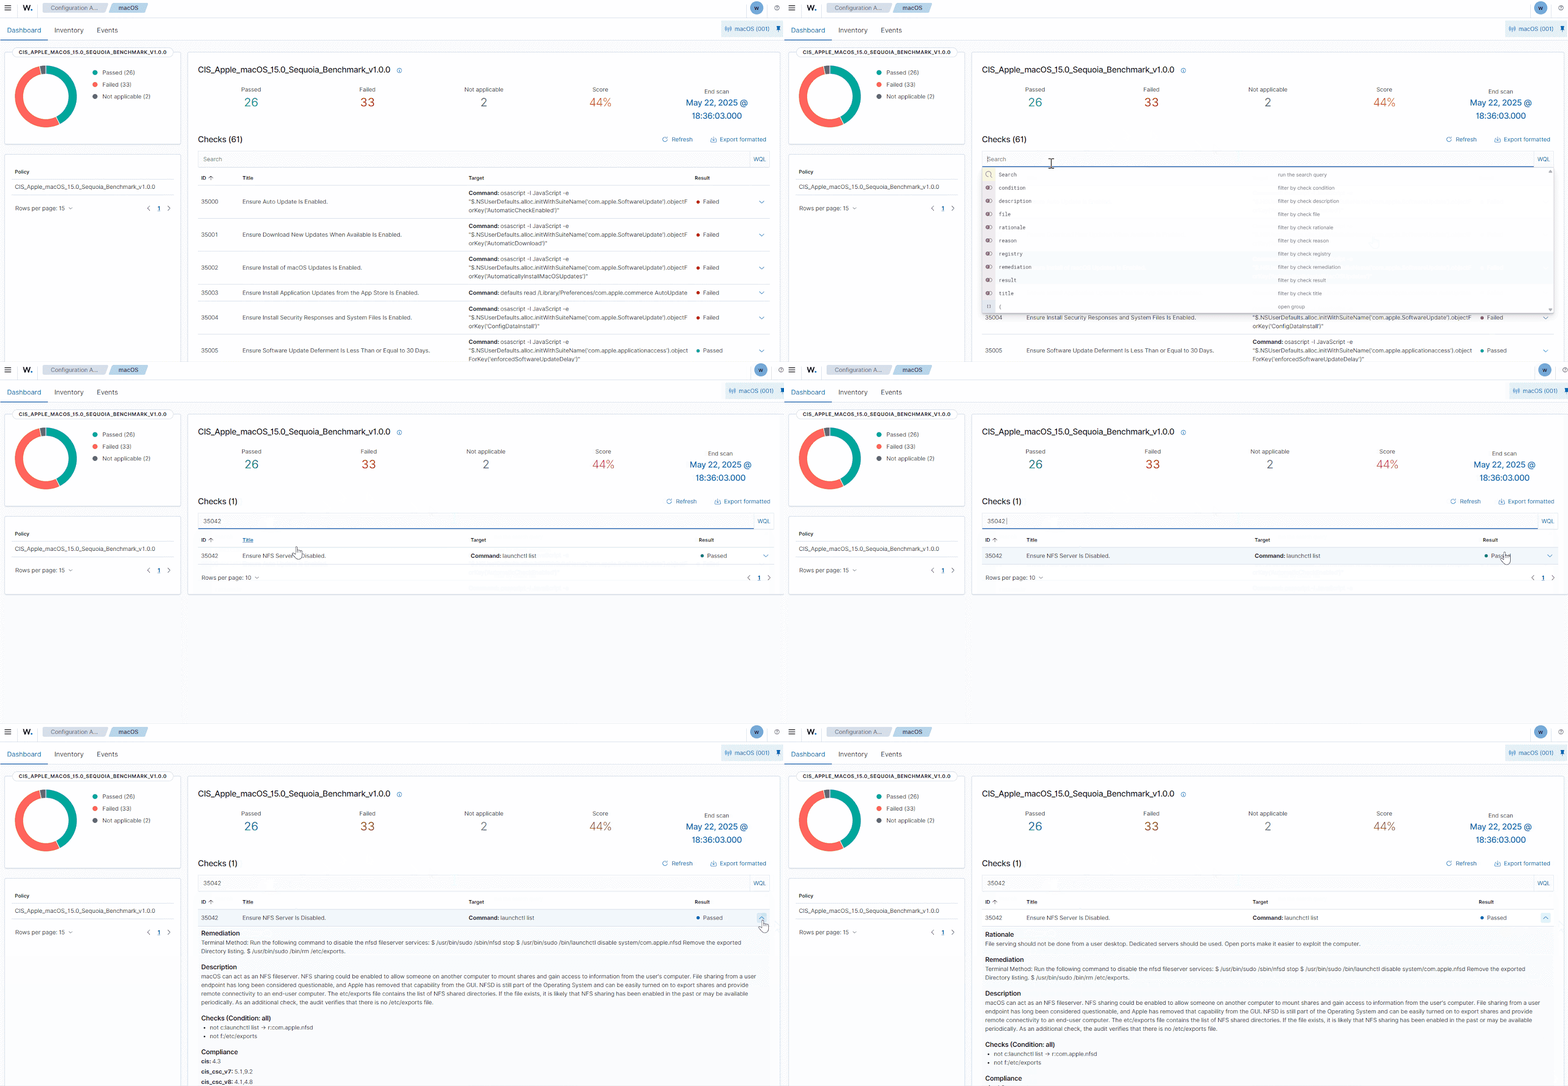
  1. Implement the recommended action on the macOS endpoint to remediate this.
  2. Restart the macOS endpoint and refresh the Wazuh dashboard.
  3. Navigate to the Events tab to view the remediation actions that were carried out.
  4. Select the remediated entry to view more details. Status changed from failed to passed.
Vulnerability detection

The Wazuh Vulnerability Detection module helps users discover vulnerabilities in the operating system and applications installed on the monitored endpoints. Wazuh CTI provides access to a comprehensive database of vulnerabilities, enabling you to quickly identify and address potential risks.

Viewing vulnerabilities on the Wazuh dashboard

The Wazuh Vulnerability Detection module is enabled by default to run scans every hour. More information can be found in the Vulnerability Detection section of our documentation.

All vulnerability data associated with monitored endpoints is shown in the Wazuh dashboard.

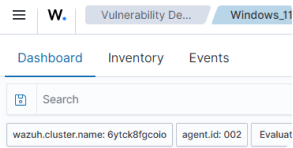
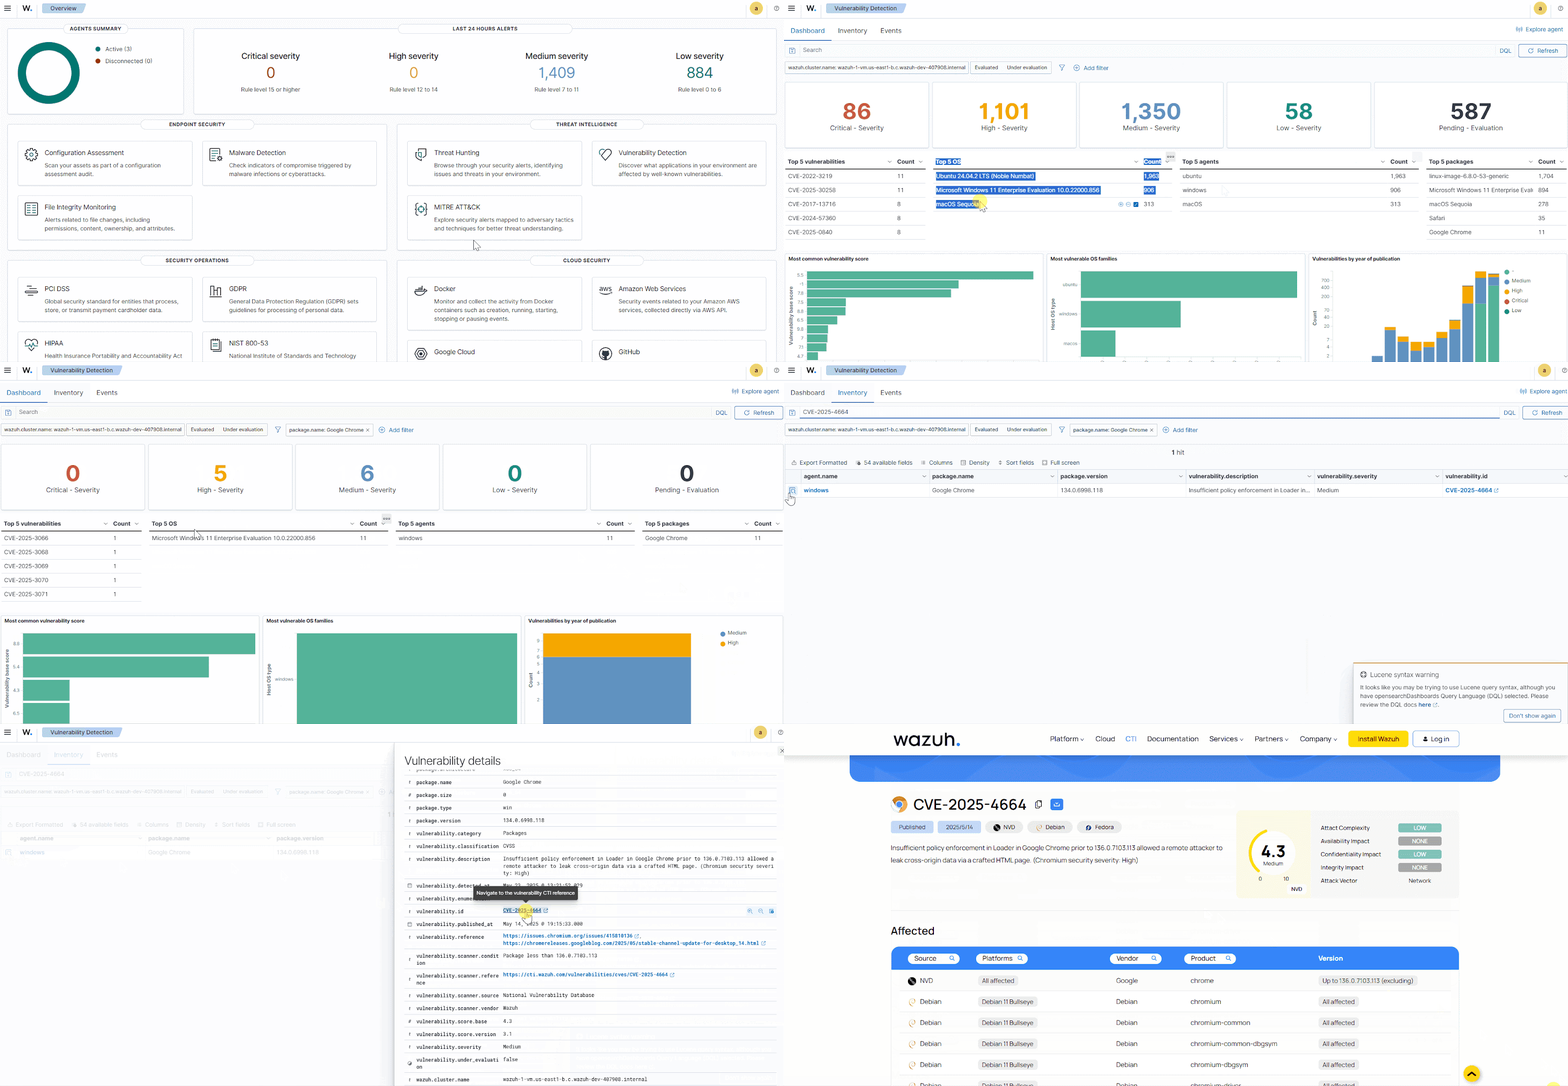
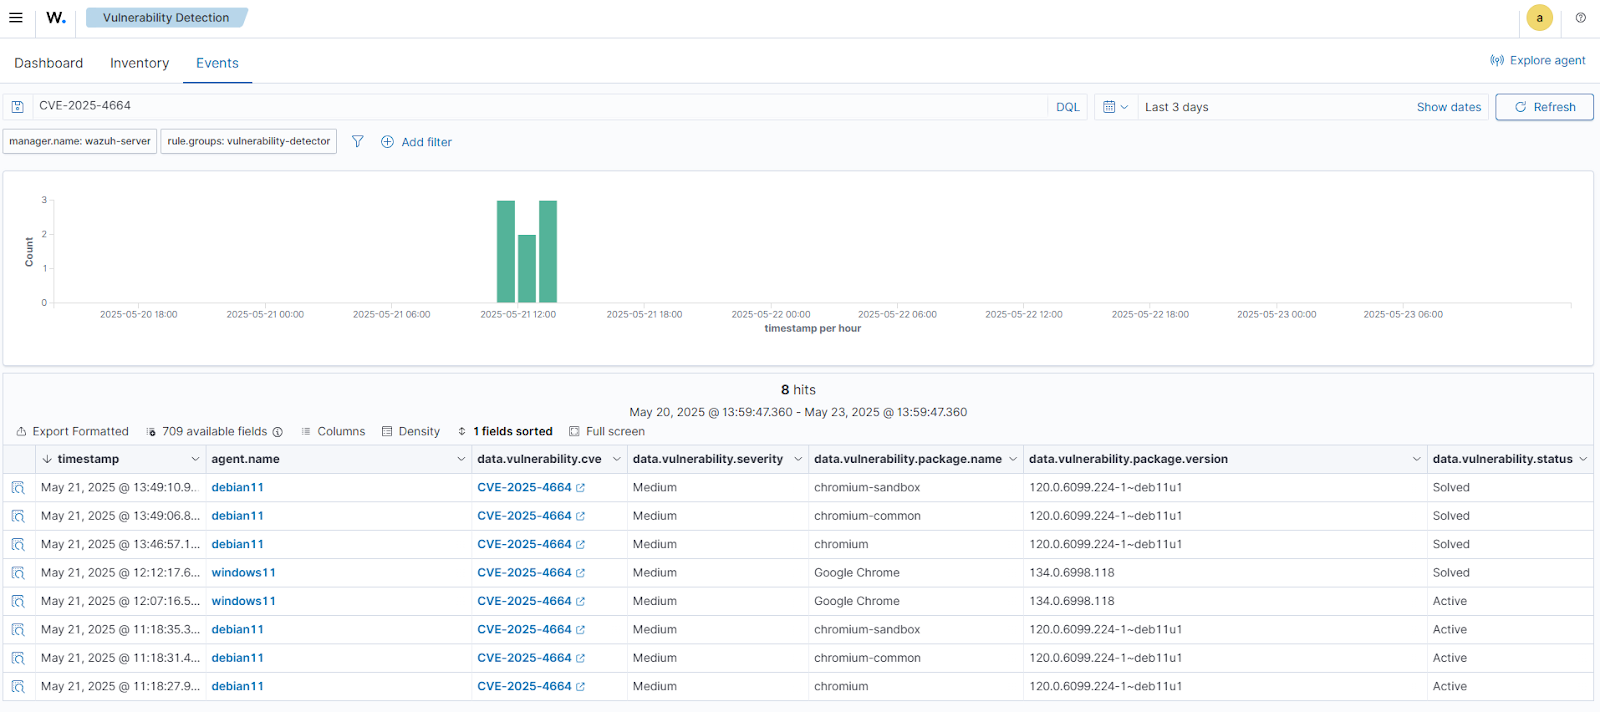
To view this, from the Wazuh dashboard, select Vulnerability Detection under Threat Intelligence. There are three sections displayed: Dashboard, Inventory, and Events.

Dashboard section
The Dashboard section provides a global summary of all vulnerabilities discovered across the monitored endpoints.
Inventory section
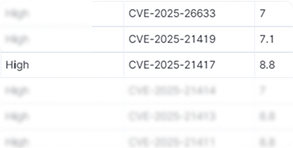
The Inventory section gives a more detailed view of the vulnerabilities and their related information.
Events section
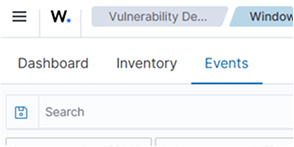
The Events section shows changes
to the state of vulnerabilities on
monitored endpoints.

Investigate vulnerabilities affecting monitored endpoints by utilizing the search option on the dashboard. You can use filters such as Common Vulnerabilities and Exposures (CVE) ID, package name, status, severity, and others in the search bar. Visit the Wazuh vulnerability detection guide for more information.

In this example, we're using the following vulnerability as a reference. We investigate the Chrome web browser CVE-20205-4664 vulnerability discovered on the Windows endpoint. A vulnerable version of Chrome 134.0.6998.118 is installed on the Windows endpoint, triggering this alert on the Wazuh dashboard.

After fixing the vulnerability, and after the Wazuh agent performs a scan, the events are shown on the Events dashboard with the state of the vulnerability changing from Active to Solved.

PCI DSS compliance reporting

Wazuh helps ensure PCI DSS compliance by performing log data analysis, file integrity monitoring, configuration assessment, threat detection, incident response, and real-time alerting. More information about this can be found in the Using Wazuh for PCI DSS compliance section of the Wazuh documentation.

To demonstrate how to use this:

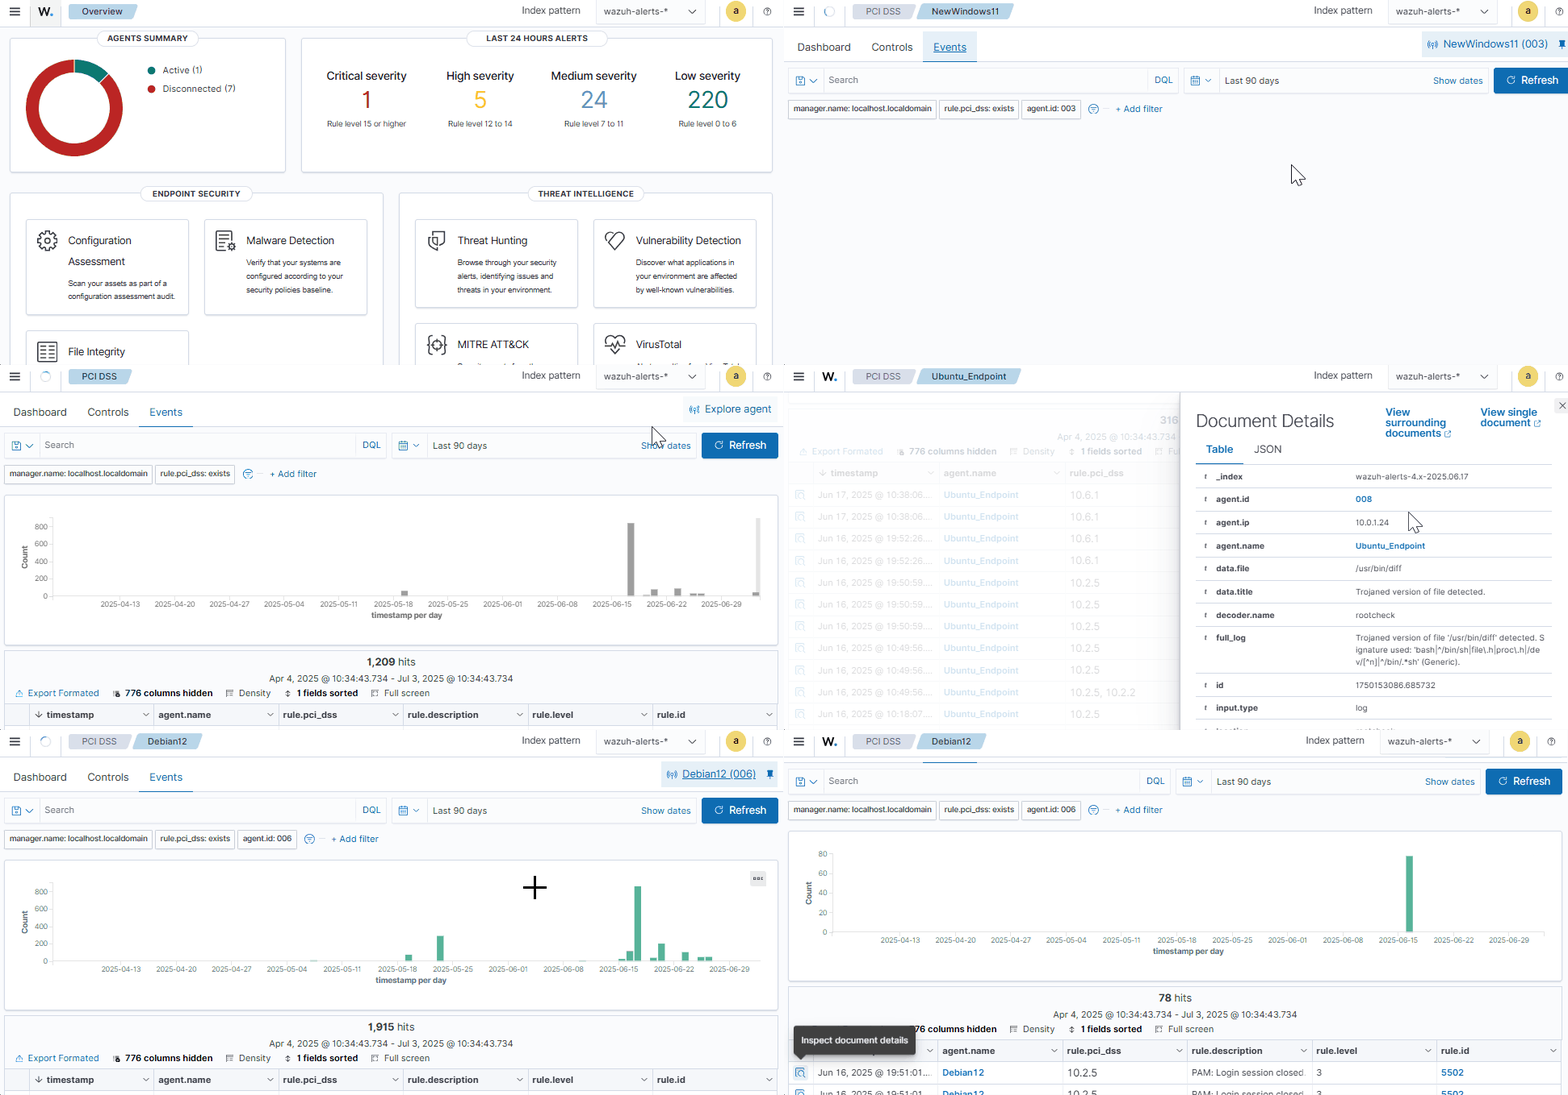
  1. From the Wazuh dashboard, select PCI DSS under SECURITY OPERATIONS.
  2. Switch to the Controls tab to view all the PCI DSS requirements.
  3. Select any of the displayed requirements to view additional details and events related to this on a monitored endpoint.
  4. Click Explore agent to view the requirements for specific monitored endpoints.
  5. Switch to the Events tab to view more information about alerts generated for each PCI DSS requirement.

MITRE ATT&CK Mapping

Wazuh has an out-of-the-box integration with the MITRE ATT&CK framework, which allows users to map alerts generated by Wazuh to specific tactics and techniques. This gives security teams a better understanding of the nature of the threats they are facing and helps them develop effective mitigation strategies.

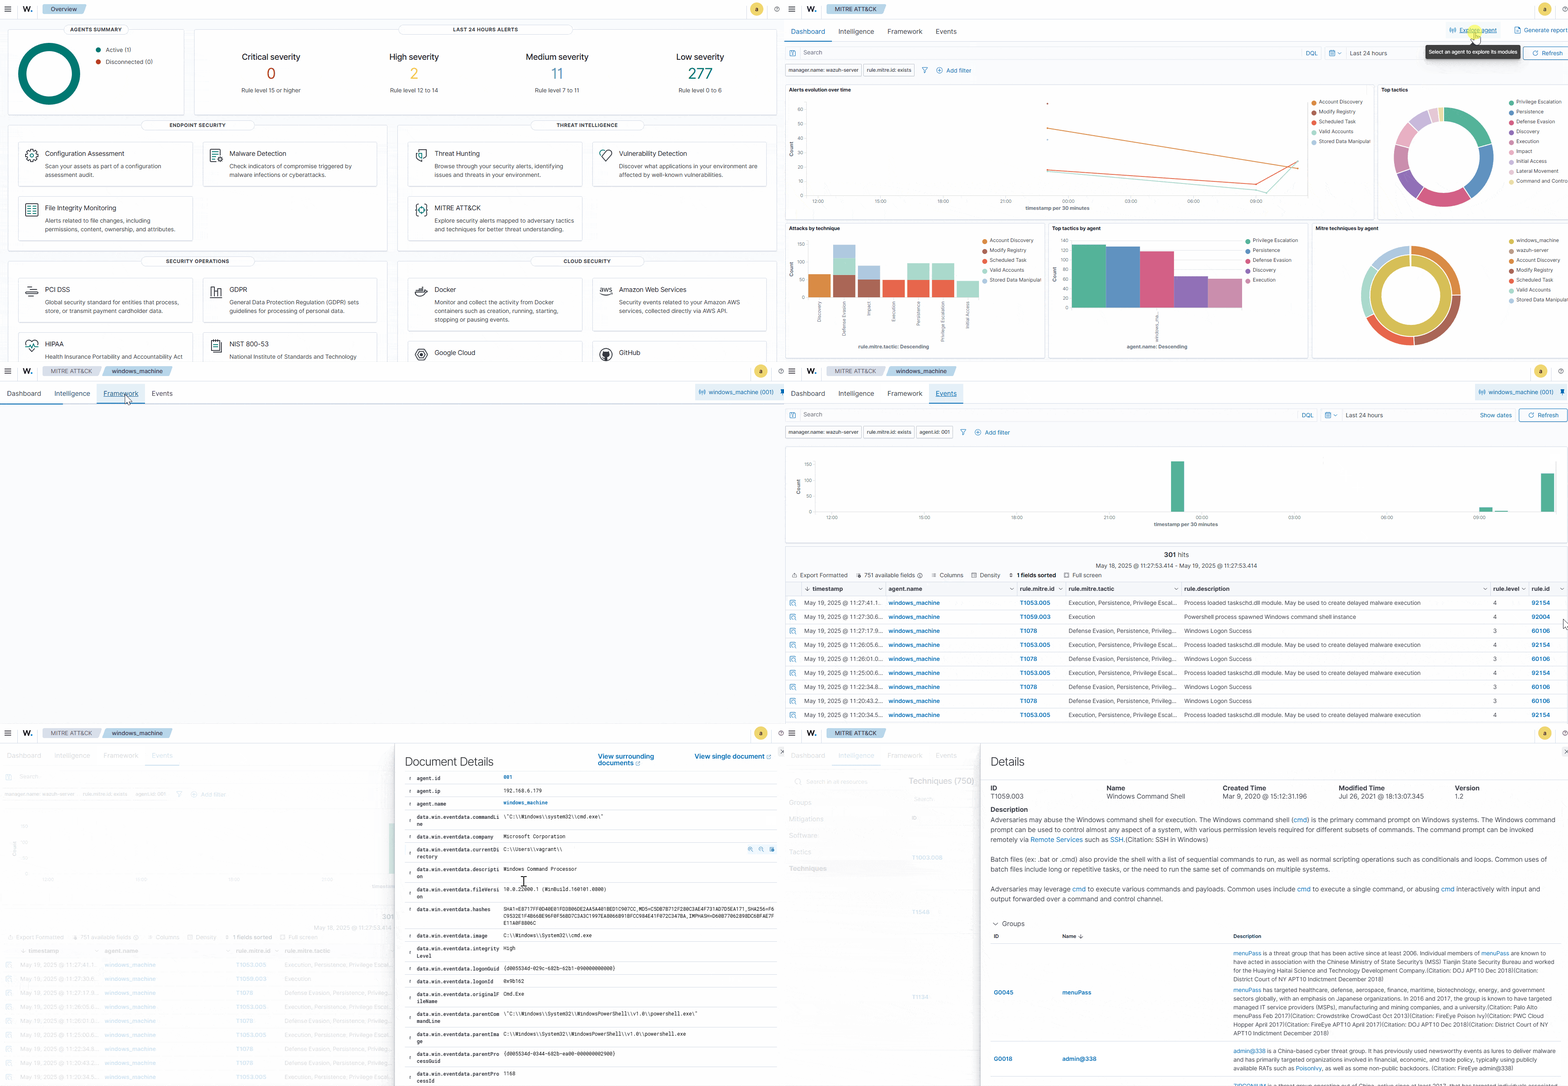
  1. From the Wazuh dashboard, select MITRE ATT&CK under THREAT INTELLIGENCE. You will see different tabs concerning MITRE ATT&CK information: Dashboard, Intelligence, Framework, Events. You can find detailed information about these tabs in the MITRE ATT&CK framework section of our documentation.
  2. From the Windows 11 endpoint, run PowerShell as an administrator and run the command cmd.exe.
  3. Still on the MITRE ATT&CK tab of the Wazuh dashboard, select the Windows 11 endpoint to see related events. On the Events tab, search for the rule ID 92004.
  4. Click on the related MITRE ID T1059.003 to view its information.

Enjoy a free
14-day trial