Security alerting enables organizations to promptly detect potential security incidents, allowing for rapid response and risk mitigation. Organizations can immediately prevent breaches, comply with regulatory requirements, and optimize operational efficiency by receiving timely alerts. Automated security alerting streamlines incident response processes, minimizing downtime and optimizing resource usage while demonstrating a commitment to proactive security measures.
Wazuh uses the OpenSearch Alerting and Notifications plugins to generate security notifications based on predefined policies and thresholds. In this blog post, we explore alerting options in Wazuh that benefit security teams, ensuring they are notified immediately upon detecting suspicious activities or anomalies.
Infrastructure
- A pre-built, ready-to-use Wazuh OVA 4.8.0 that includes the Wazuh core components (Wazuh server, Wazuh indexer, and Wazuh dashboard). Follow the virtual machine (OVA) – installation alternatives guide to download and set up the Wazuh virtual machine.
- An Ubuntu 22.04.3 endpoint with Wazuh agent 4.8.0 installed and enrolled to the Wazuh server.
- A Kali Linux 2024.2 endpoint. Please refer to the official guide for the installation procedure. This endpoint is used to emulate attacks for a use case in this scenario.
Configuration
We configure the Alerting plugin in the Wazuh dashboard to monitor critical security events and send alert notifications once the predefined policies are met. We also set up a notification channel in the Notifications plugin to determine how and where the alerts are delivered. Wazuh promptly delivers enhanced security notifications by leveraging its configured methods, diverse data sources, query indexing, and scheduling capabilities.
First, we show how the configuration works to help understand better the different options and then we perform the actual configurations with real scenarios.
Wazuh dashboard
Perform the steps below to configure the OpenSearch Notifications and Alerting plugins in your Wazuh dashboard.
Notifications configuration
Notifications are messages dispatched to users upon triggering alerts. By activating the Notifications and Alerting plugins, we can efficiently notify users whenever new alerts are triggered. We have options to choose the notification channel type such as Slack, Chime, Amazon SNS, Microsoft Teams, Email, or any other, using a custom webhook. This blog post demonstrates how to configure Slack for receiving security notifications.
Follow the next steps to configure the Notifications plugin to send alerts to a Slack channel:
1. Create a Slack incoming webhook to send security notifications to a Slack channel. Follow the sending messages using incoming webhooks guide to create a Slack incoming webhook.
Note: Copy the Slack webhook URL after creating and activating the Slack incoming webhook.
2. Navigate to Notifications under the Explore section in the Wazuh dashboard.
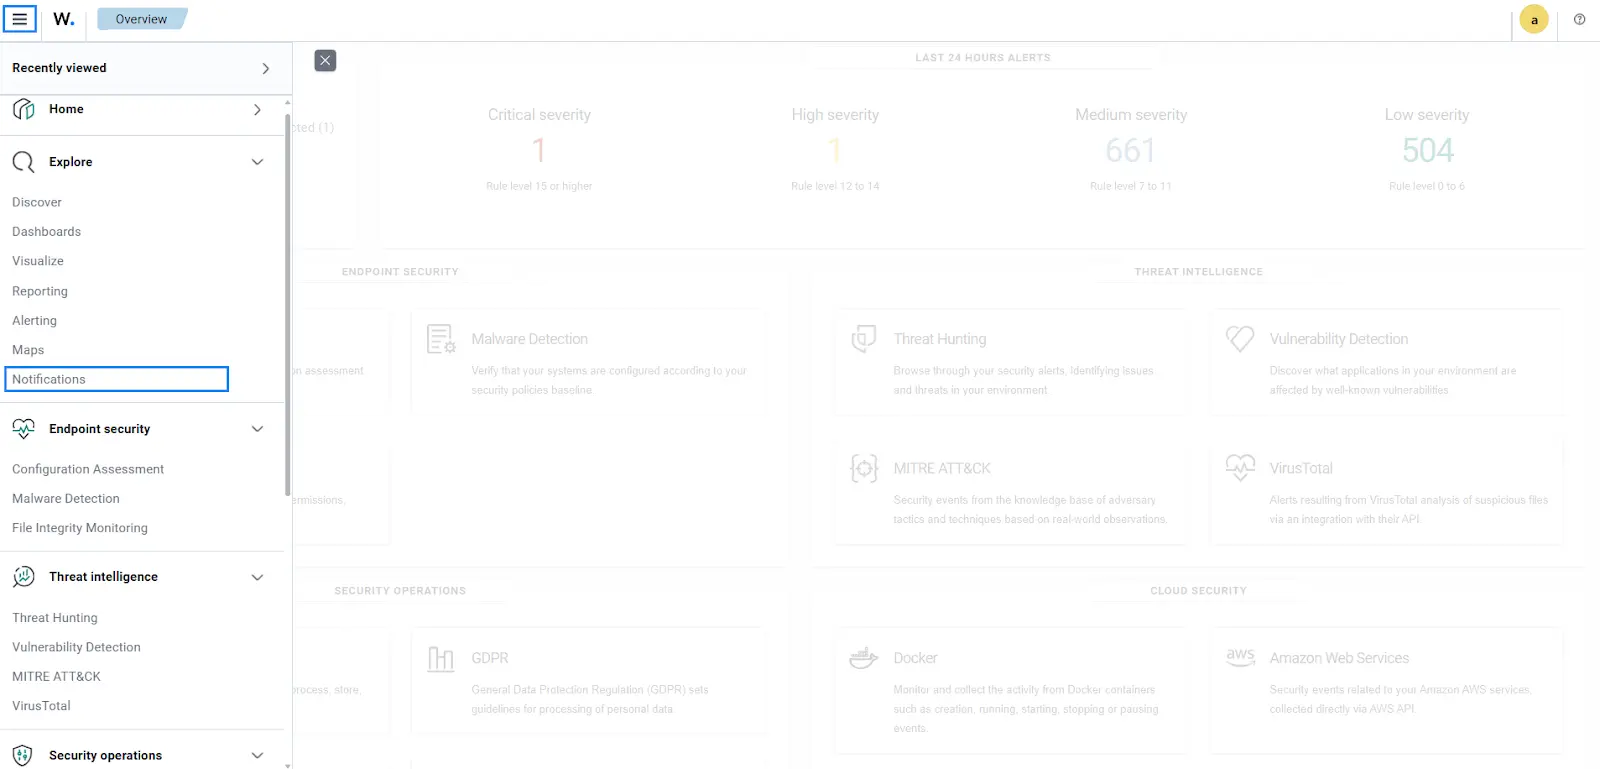
3. Click on Create channel to create a Slack channel.

4. Define the channel name. For this case, we use Slack channel as a name. Select Slack as the channel type, and insert the Slack webhook URL:
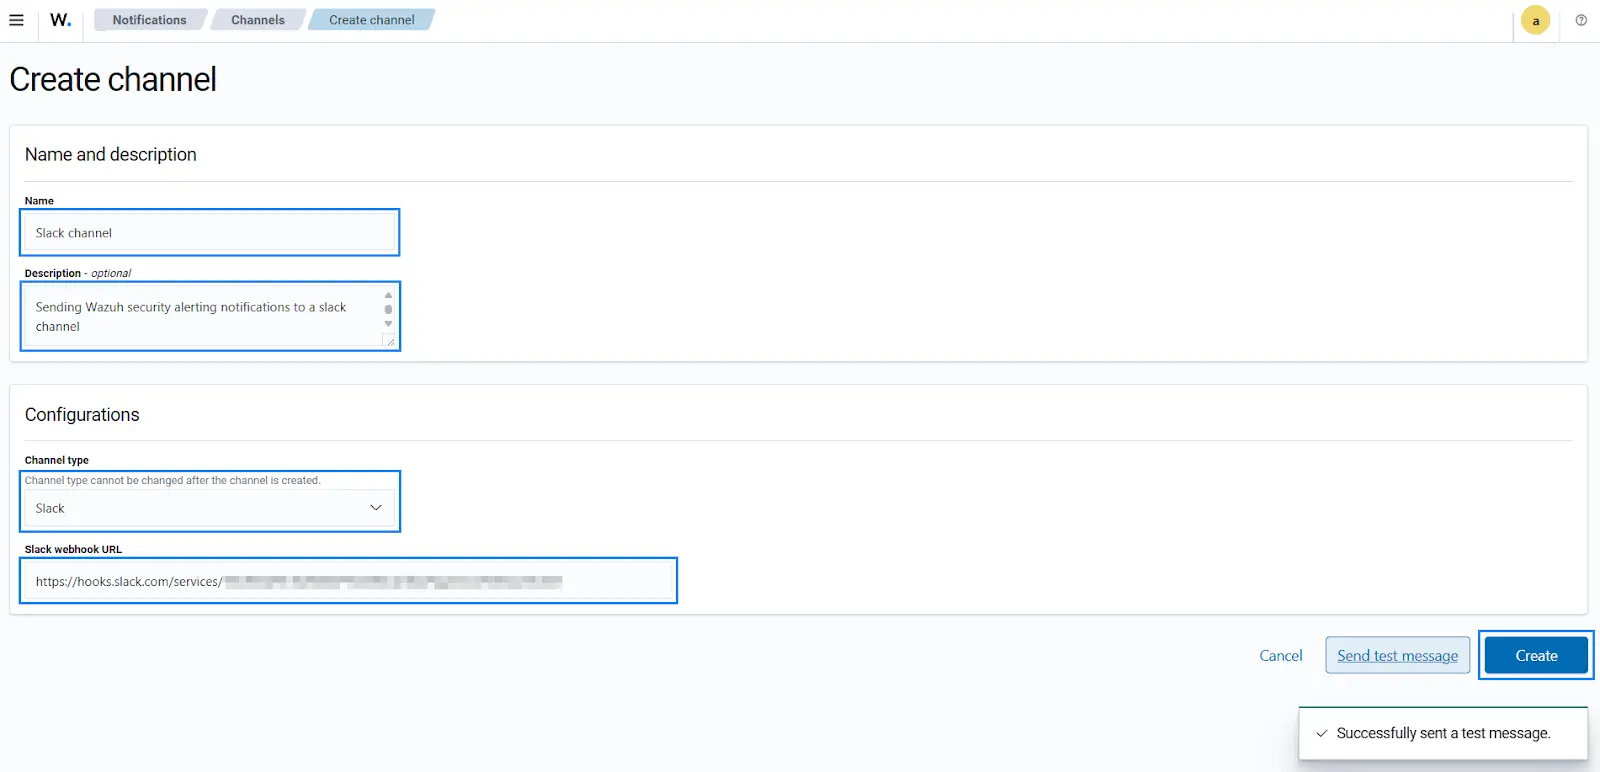
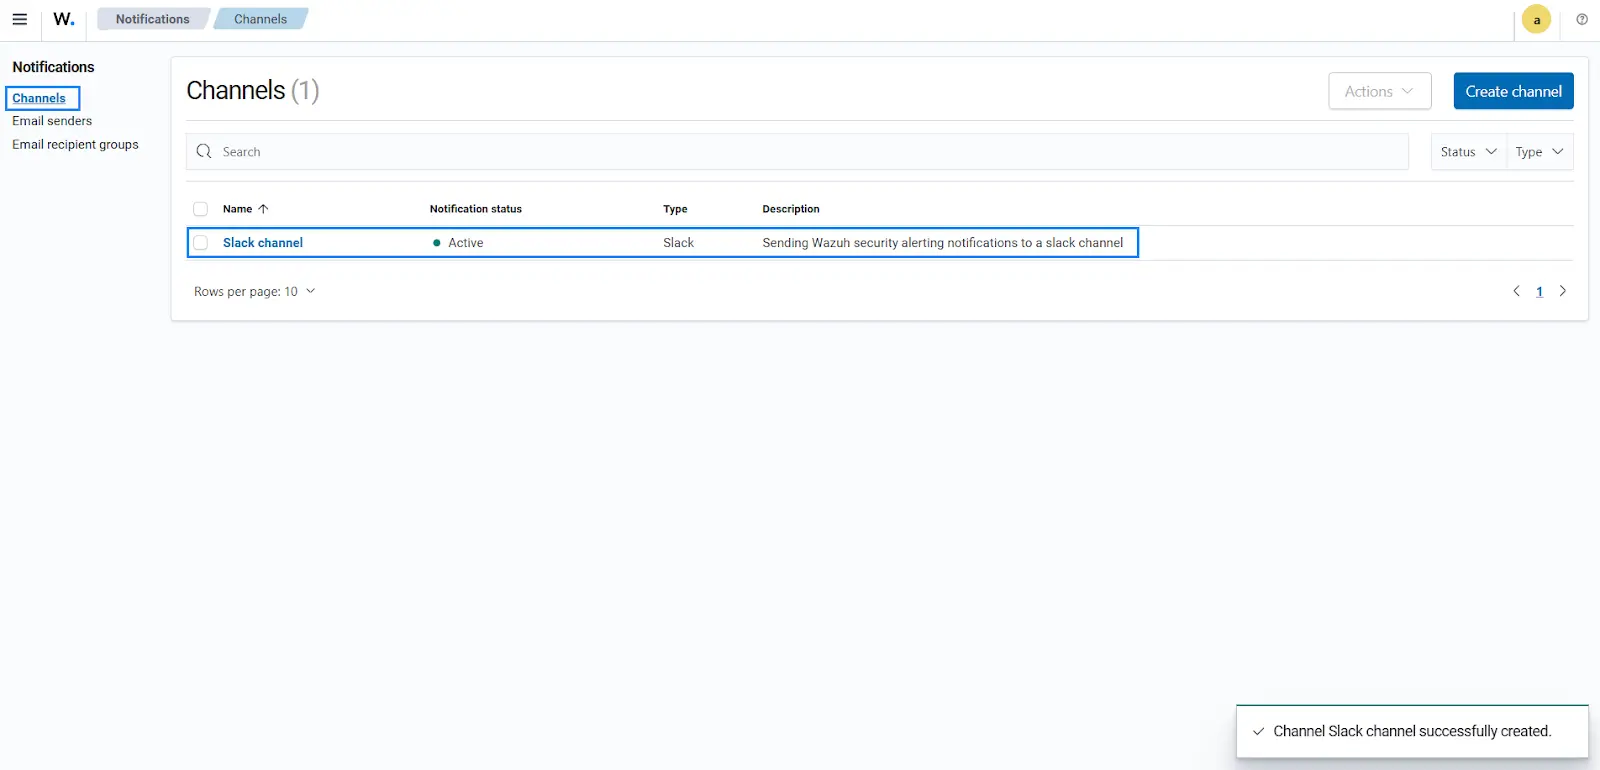
After successfully creating the Slack channel, you should be able to see the below image. Make sure the Notification status shows Active.
Alerting configuration
We configure alerting in Wazuh to monitor significant activities that require prompt attention. A comprehensive alerting configuration includes monitoring details, data sources, query information, and trigger conditions to generate notifications.
The steps below describe the requirements to configure the Alerting plugin in the Wazuh dashboard.
1. Navigate to the Alerting page under the Explore section in the Wazuh dashboard.
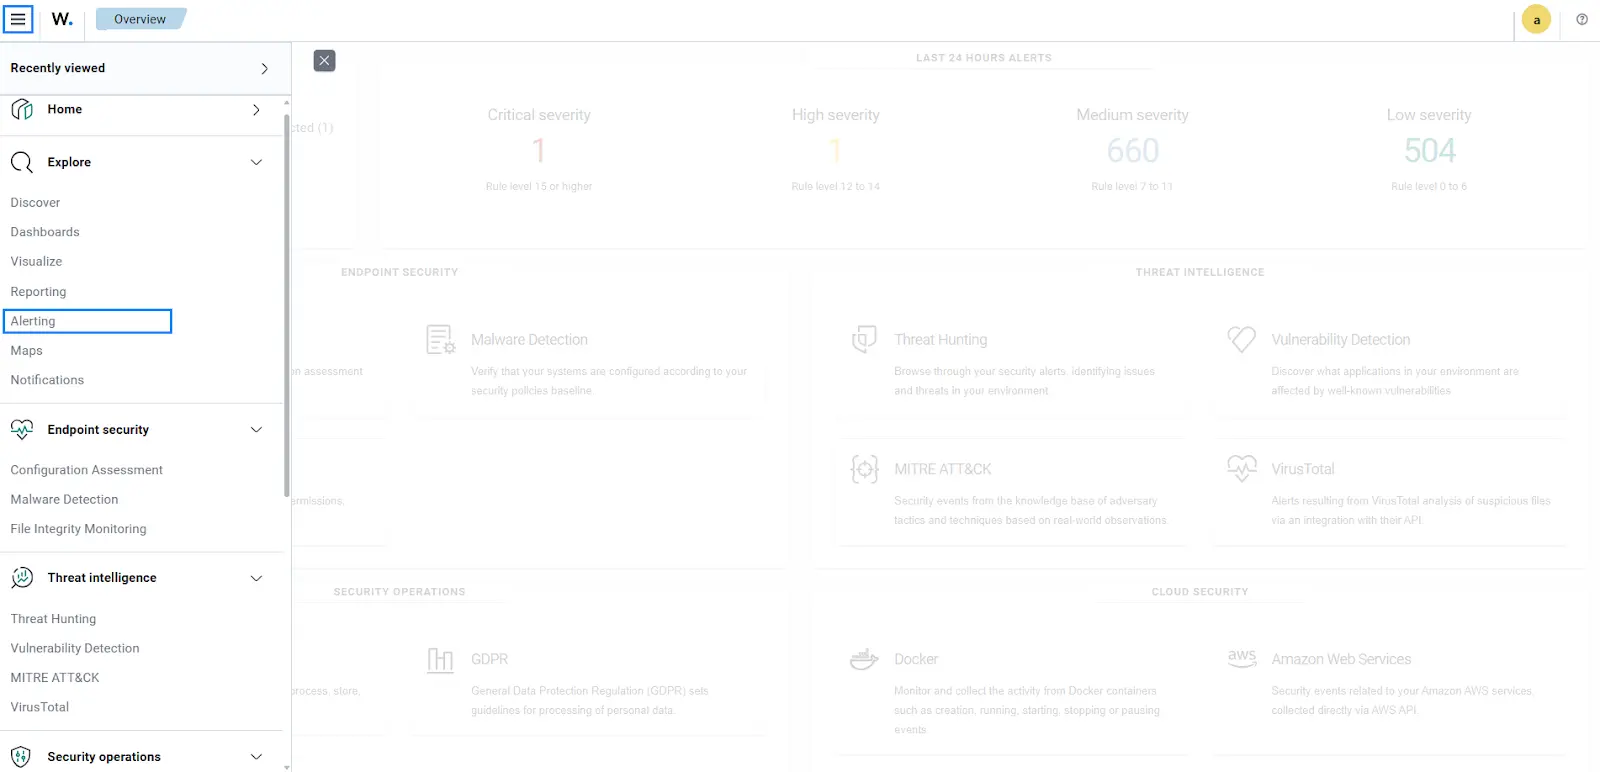
2. Select Create monitor to configure your first monitor.

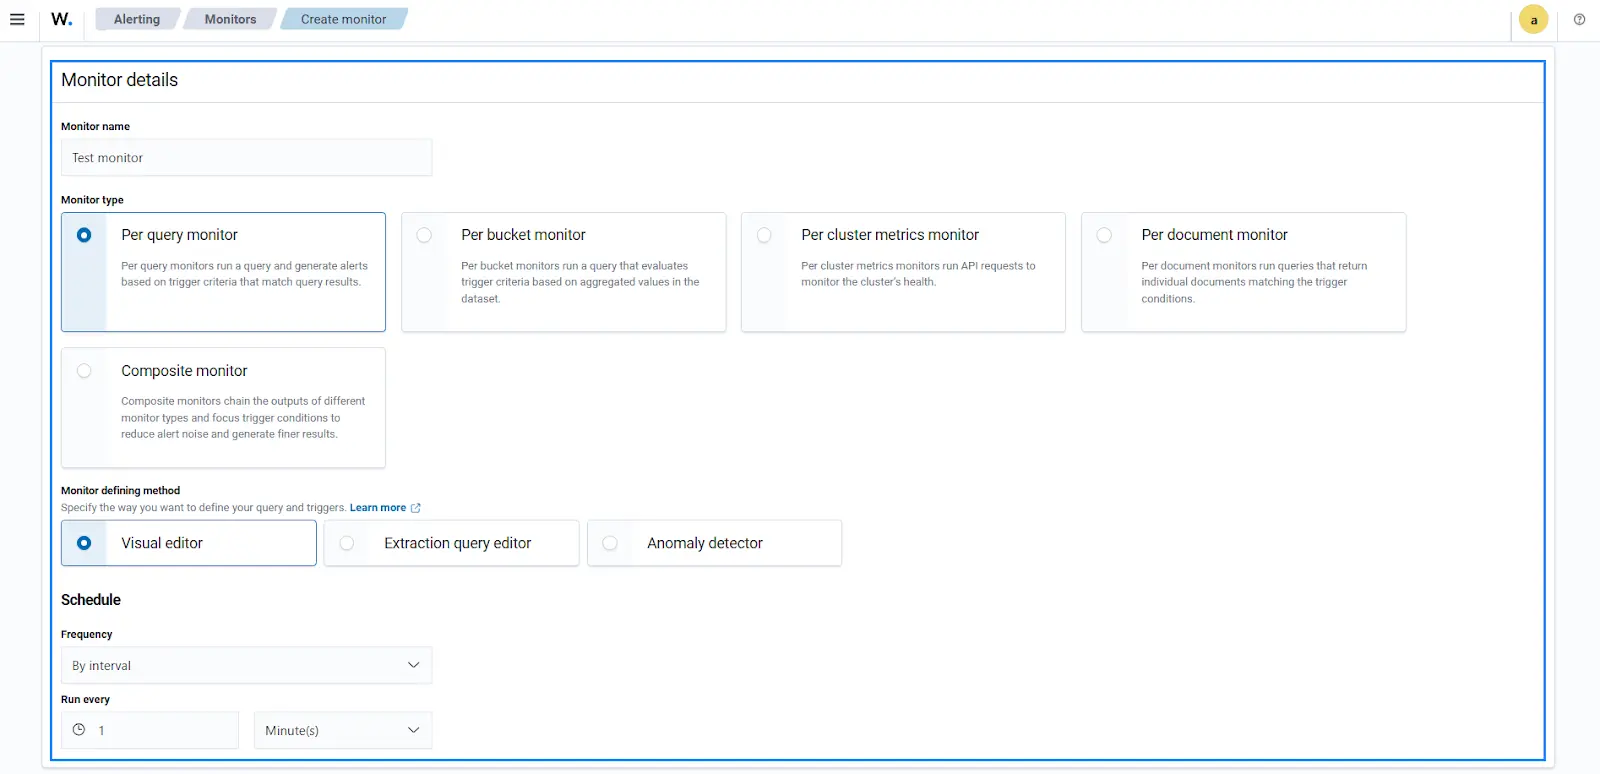
3. Define the Monitor name and select the Monitor type. The Monitor details section provides the list of monitor types we can configure. These include –
Per query monitorexecutes a query and generates alerts based on specified trigger criteria that align with the query results.Per bucket monitorexecutes queries that assess trigger criteria by evaluating aggregated values within each dataset segment.Per cluster metrics monitorexecutes API requests to assess and ensure the overall health of each cluster.Per document monitorexecutes queries to retrieve individual documents that meet specified trigger conditions.Composite monitorcombines outputs from various monitor types, refining trigger conditions to minimize alert noise and produce more precise results.
4. Choose a Monitor defining method. The Visual editor provides a graphical interface to define alerting queries whereas the Extraction query editor allows one to write alerting queries.
5. Select the appropriate Frequency to define how frequently we run the monitor under the Schedule section from the options below:
- By interval
- Daily
- Weekly
- Monthly
- Custom cron expression
6. Select the interval to Run every few minutes, hours, or days under the Schedule section.
7. Specify the wazuh-alerts-* Index to get security data from Wazuh and timestamp as a Time field under the Data source section. We perform this to specify where the monitor should collect security events based on a defined timestamp.

8. Configure the required parameters if you choose the Visual editor in step 4 or define your query for the Extraction query editor.
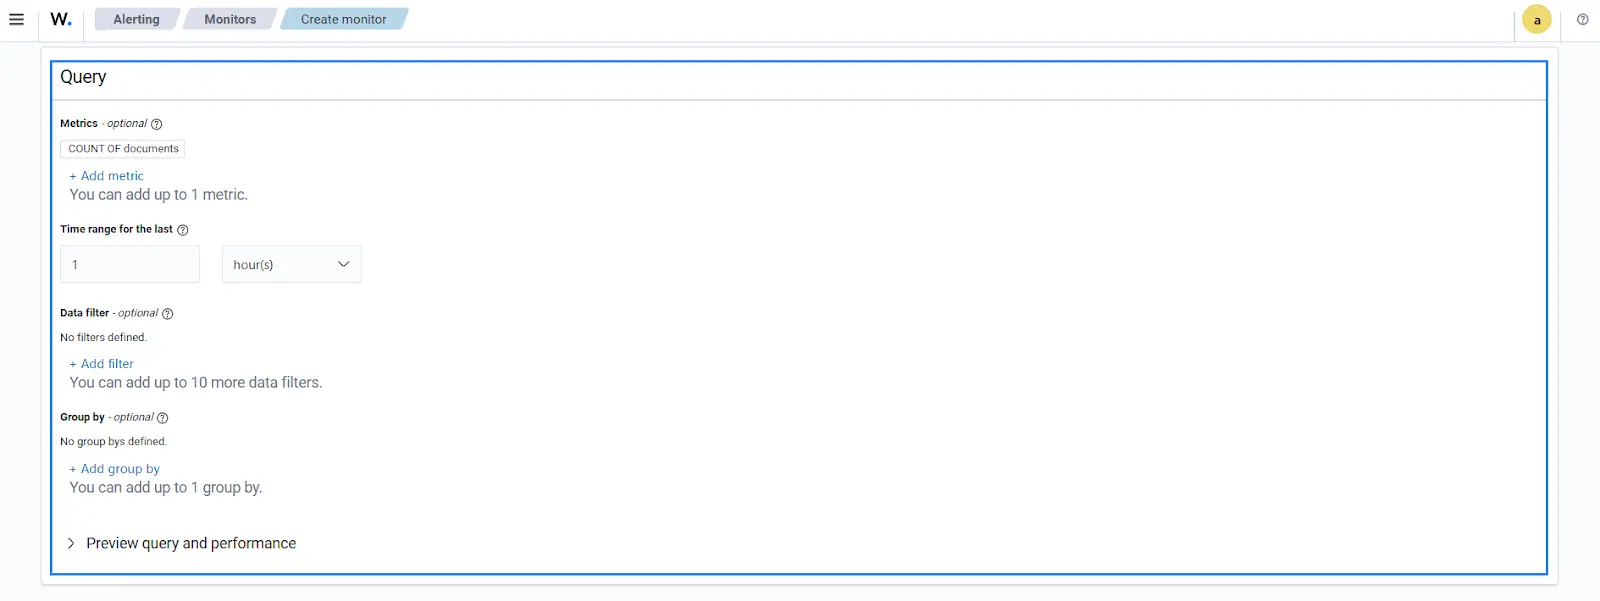
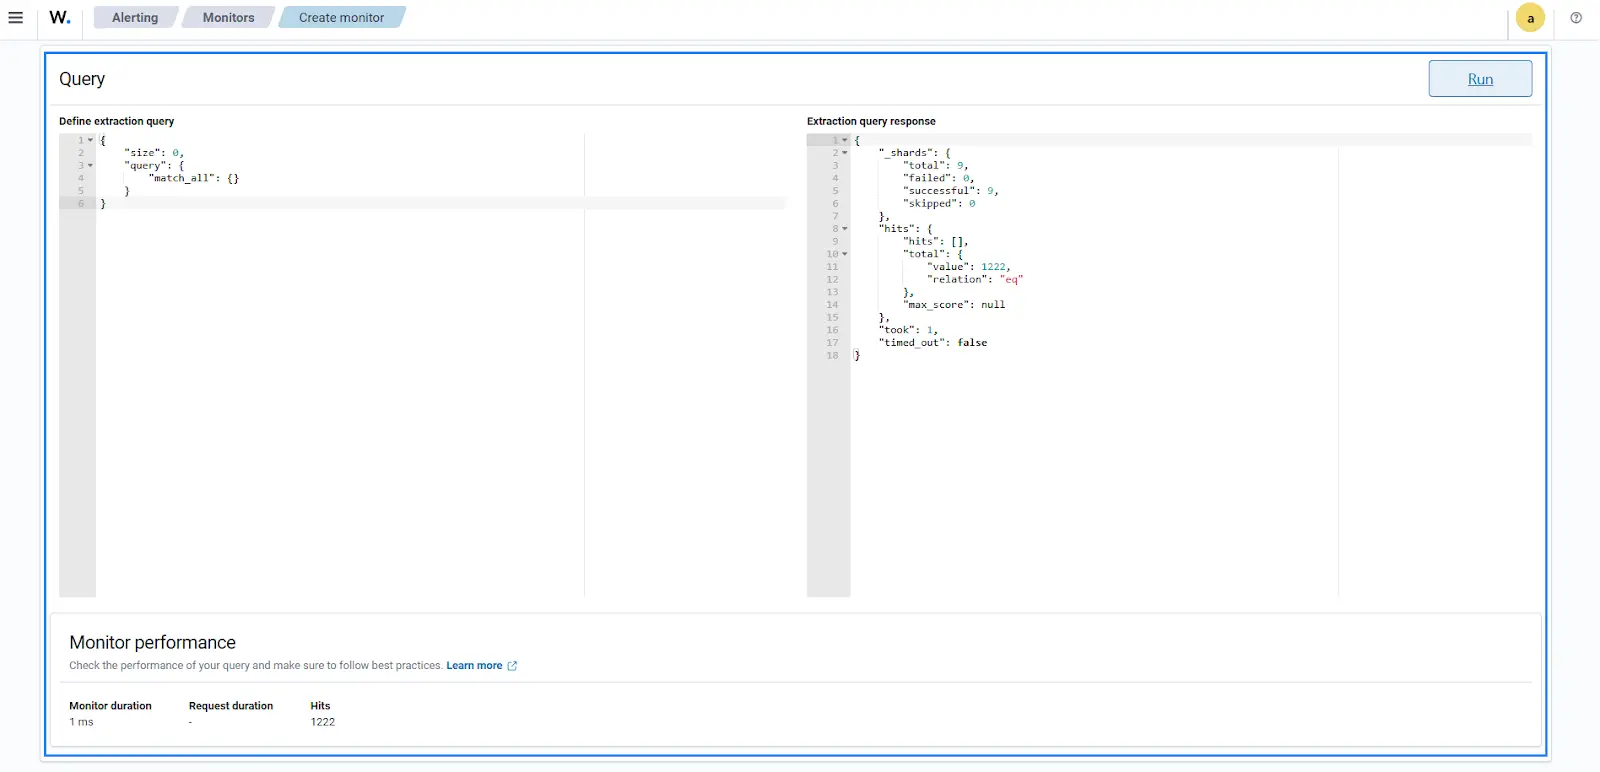
9. Click on Add trigger to specify a trigger that will generate an alert once the monitor conditions are satisfied. Triggers are conditions that, if met, will generate alerts.
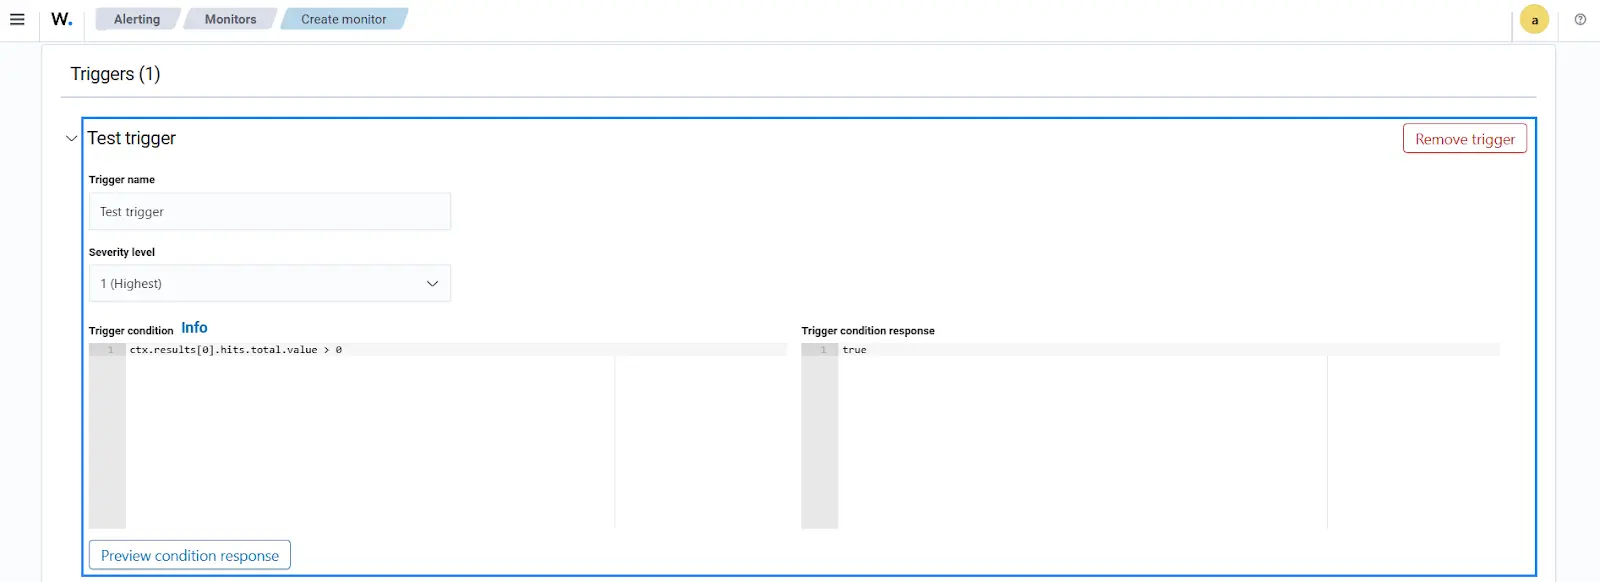
Once the trigger is created, an Action can be created to send the triggered alerts to the notification channel created earlier.
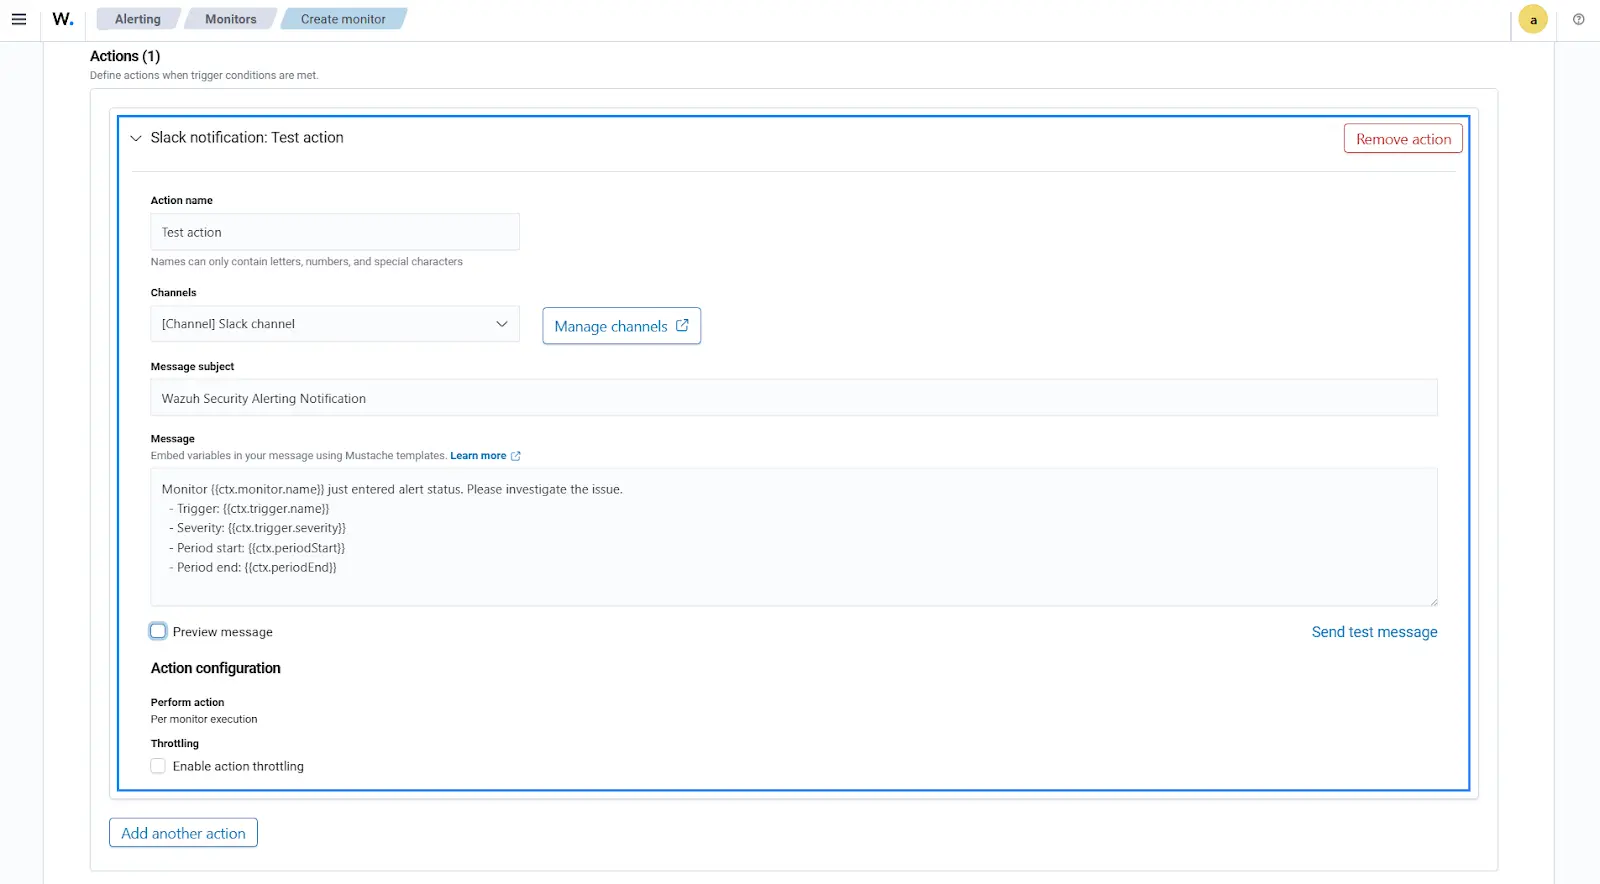
Wazuh alerting use cases
We configure different use cases to demonstrate the practical applications and scenarios where Wazuh alerting can be effectively utilized. Below are the examples of two use cases that will be discussed extensively in this blog post:
- Anomaly detection monitoring using Per query monitor
- Detecting abnormal file deletion activities using Per bucket monitor
Anomaly detection monitoring using per query monitor
In this section, we install and configure the OpenSearch Anomaly Detection plugin on the Wazuh dashboard. We also configure the Per query monitor in the Alerting plugin to monitor for anomaly detection. This setup enables Wazuh alerting to generate security notifications upon detecting anomalies related to failed login attempts.
Wazuh dashboard
Perform the steps below on your Wazuh dashboard to install and configure the Anomaly Detection and Alerting plugin.
Anomaly Detection plugin installation
Wazuh 4.8.0 is based on OpenSearch 2.10.0. Follow the steps below to install the OpenSearch Anomaly Detection plugin because it is disabled by default in Wazuh.
1. Execute the following command to install the Anomaly Detection plugin:
# sudo -u wazuh-dashboard /usr/share/wazuh-dashboard/bin/opensearch-dashboards-plugin install anomalyDetectionDashboards
Output
Attempting to transfer from anomalyDetectionDashboards
Attempting to transfer from https://ci.opensearch.org/ci/dbc/distribution-build-opensearch-dashboards/2.10.0/latest/linux/x64/tar/builds/opensearch-dashboards/plugins/anomalyDetectionDashboards-2.10.0.zip
Transferring 17603752 bytes....................
Transfer complete
Retrieving metadata from plugin archive
Extracting plugin archive
Extraction complete
Plugin installation complete
2. Restart the Wazuh dashboard for the changes to take effect:
# systemctl restart wazuh-dashboard
3. Verify that the plugin is installed correctly:
# sudo -u wazuh-dashboard /usr/share/wazuh-dashboard/bin/opensearch-dashboards-plugin list
Output
alertingDashboards@2.10.0.0
anomalyDetectionDashboards@2.10.0.0
customImportMapDashboards@2.10.0.0
ganttChartDashboards@2.10.0.0
indexManagementDashboards@2.10.0.0
notificationsDashboards@2.10.0.0
reportsDashboards@2.10.0.0
securityDashboards@2.10.0.0
wazuh@4.8.0-12
wazuhCheckUpdates@4.8.0-12
wazuhCore@4.8.0-12
You should find the Anomaly Detection plugin visible under the OpenSearch Plugins upon refreshing your Wazuh dashboard.
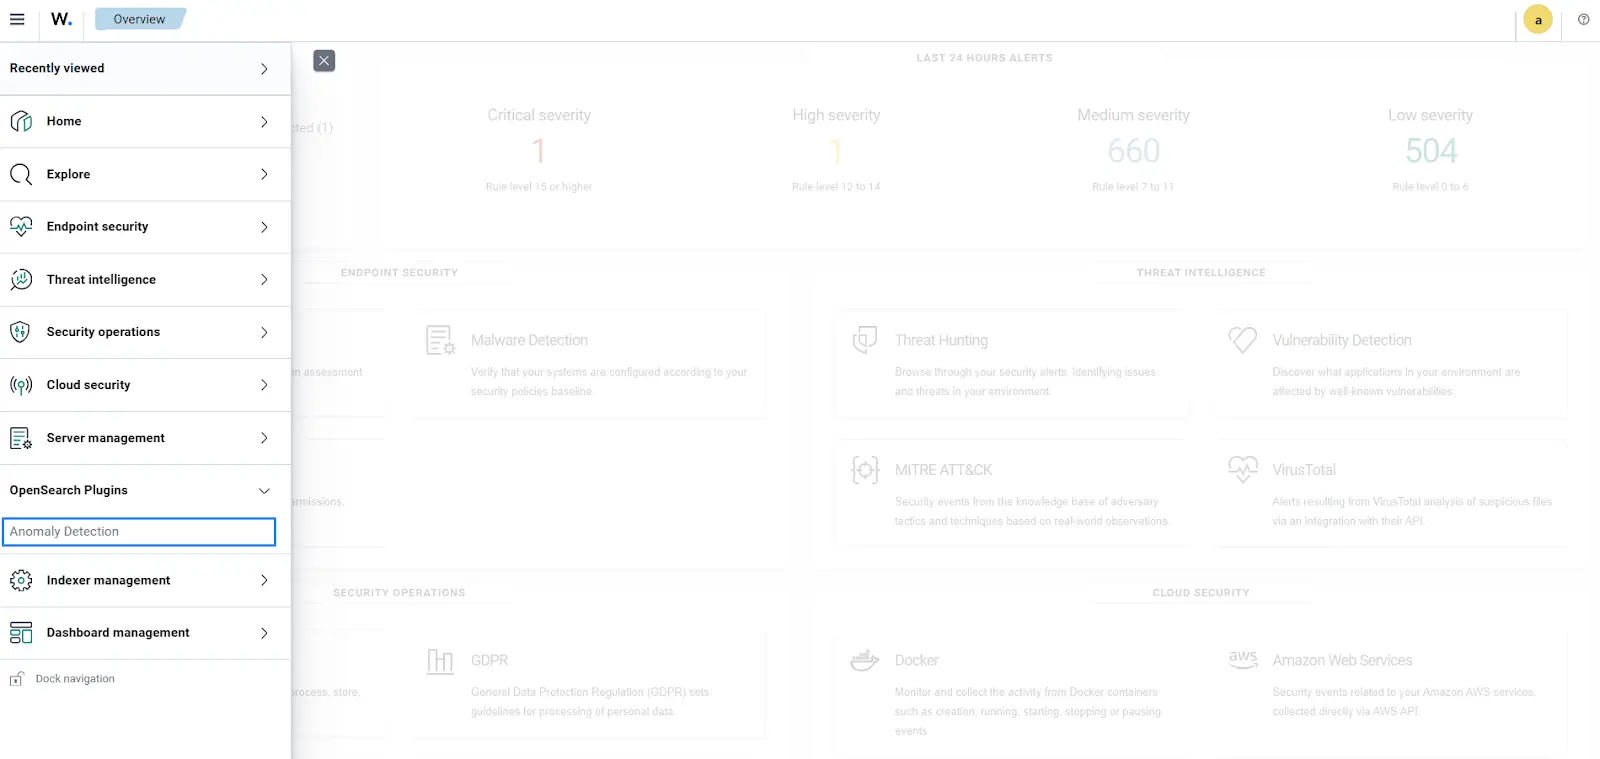
Anomaly Detection plugin configuration
We now configure the Anomaly Detection plugin in the Wazuh dashboard to identify anomalies related to failed logins. Utilizing this feature, we will create an anomaly detection monitor that generates security notifications, sending them to our designated Slack channel.
Follow the configuration steps of the Failed logins anomaly section in this blog post enhancing IT security with anomaly detection in Wazuh to create an anomaly detector from the failed logins.
Per query monitor configuration
This section includes the steps of configuring a monitor to send security notifications when a failed login anomaly is generated above a certain confidence level. Perform the steps below to configure the Per query monitor for anomaly detection.
1. Select Explore > Alerting > Create monitor to create a new monitor for anomaly detection.

2. Specify “Anomaly detection monitoring” as a Monitor name and select Per query monitor as the Monitor type.
3. Select the Anomaly detector as the Monitor defining method and select failed-logins-anomaly as the Detector.
4. Schedule the monitor to run every 2 minutes.
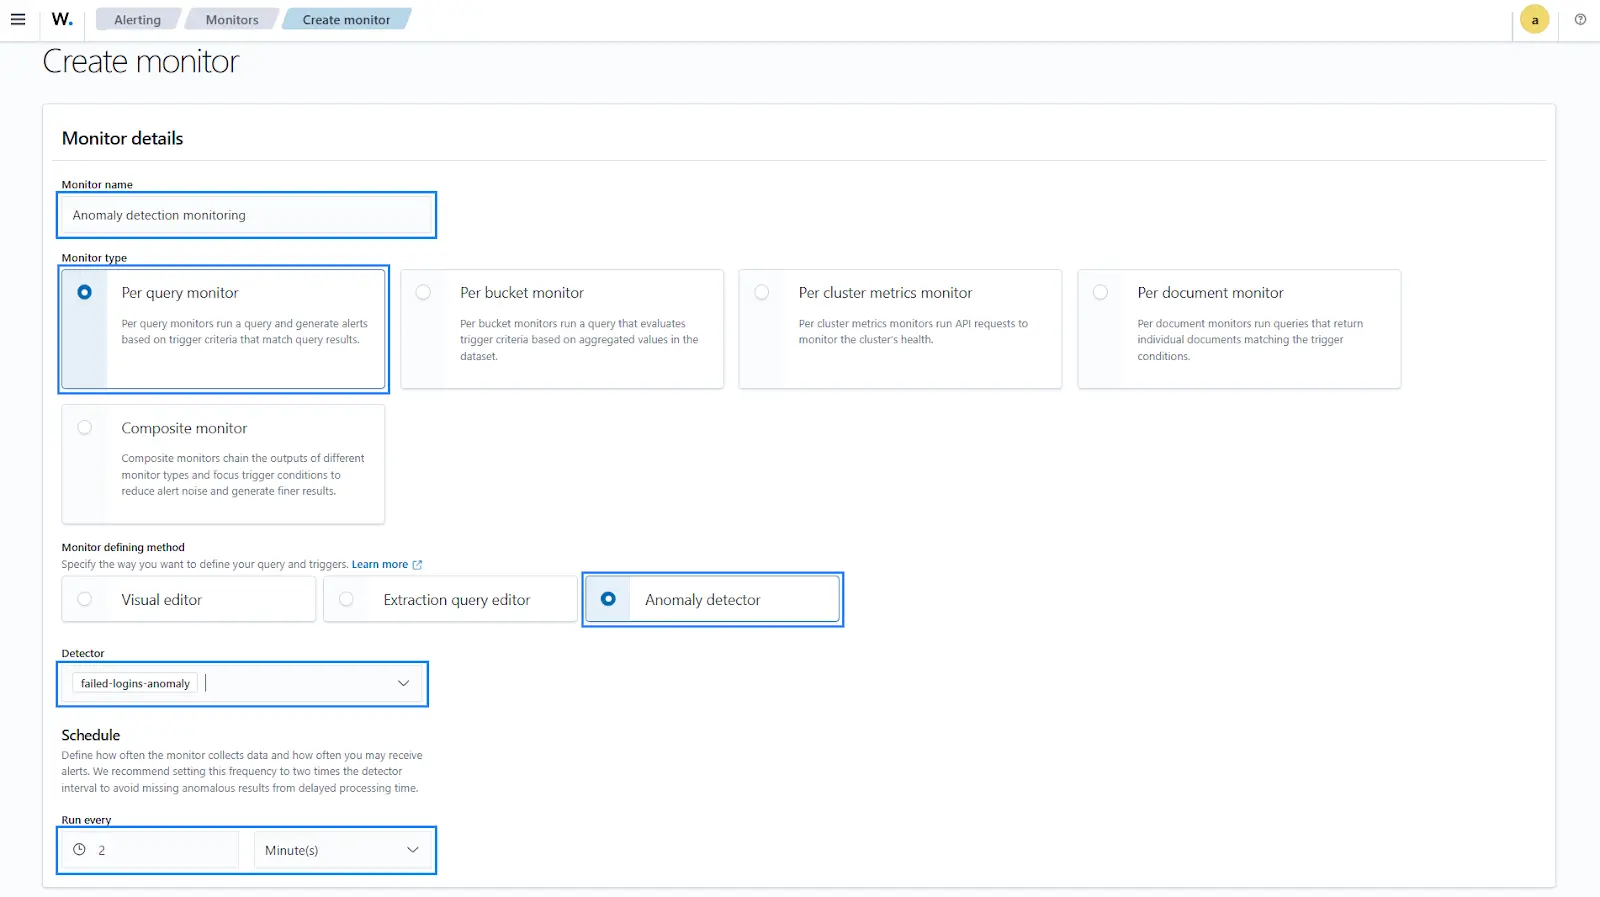
5. Select Add trigger to define conditions and actions.
6. Specify “Anomaly detection monitoring trigger” as the Trigger name and select 1 (Highest) as the Severity level.
7. Select Anomaly detector grade and confidence as Trigger type.

8. Set Anomaly grade threshold and Anomaly confidence threshold to IS ABOVE 0.75.
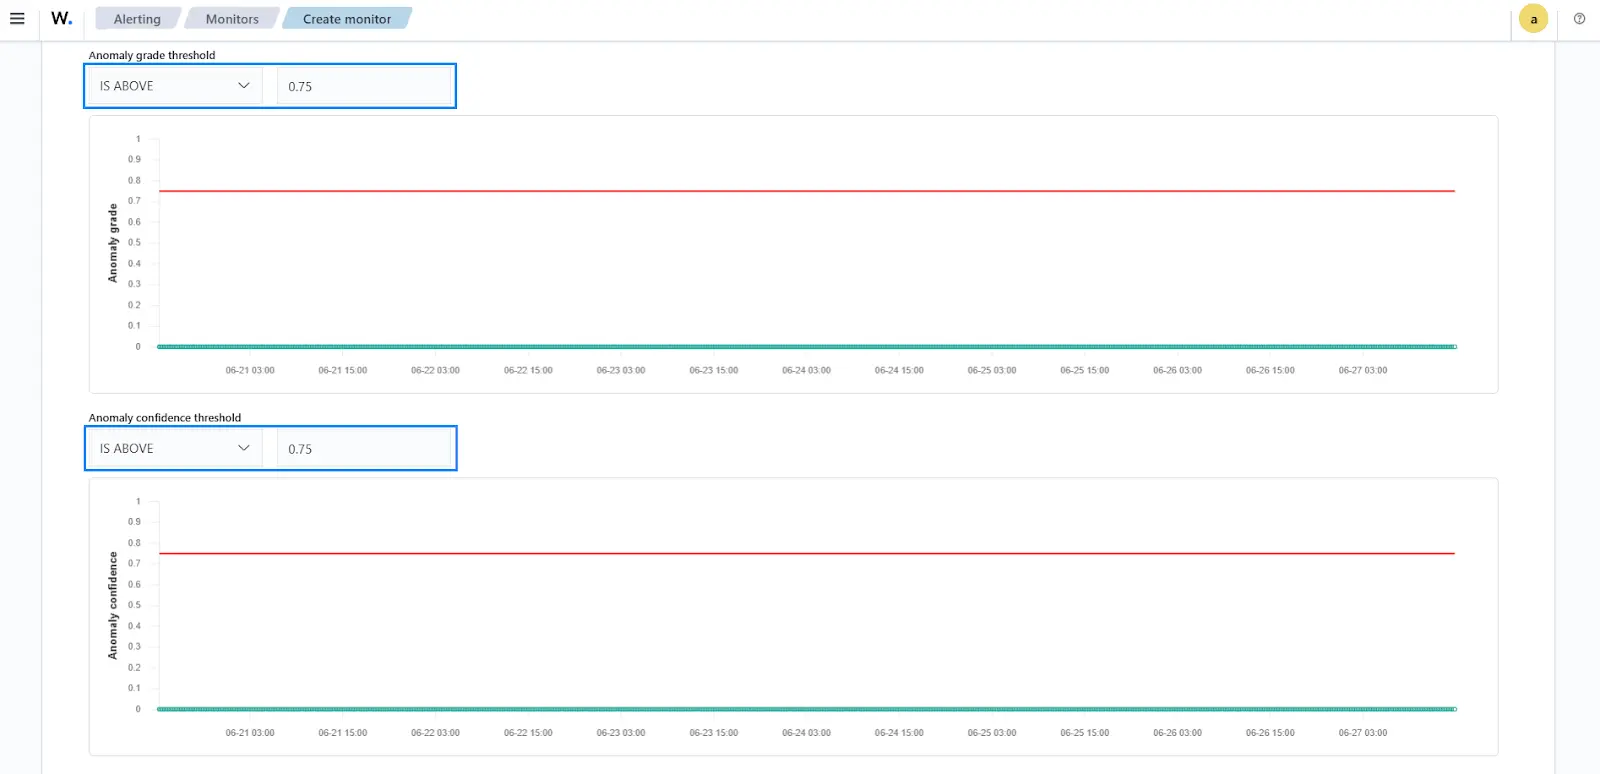
9. Specify “Anomaly detection monitoring notification” as the Action name to send Slack notifications.
10. Select Slack channel from the Channels option that we created earlier.
11. Set “Wazuh Alerting Notification” as the Message subject.
We will use the default Message contents here. Click the Preview message to see what the message will look like. Additionally, clicking the Send test message will send a test notification for this monitor.
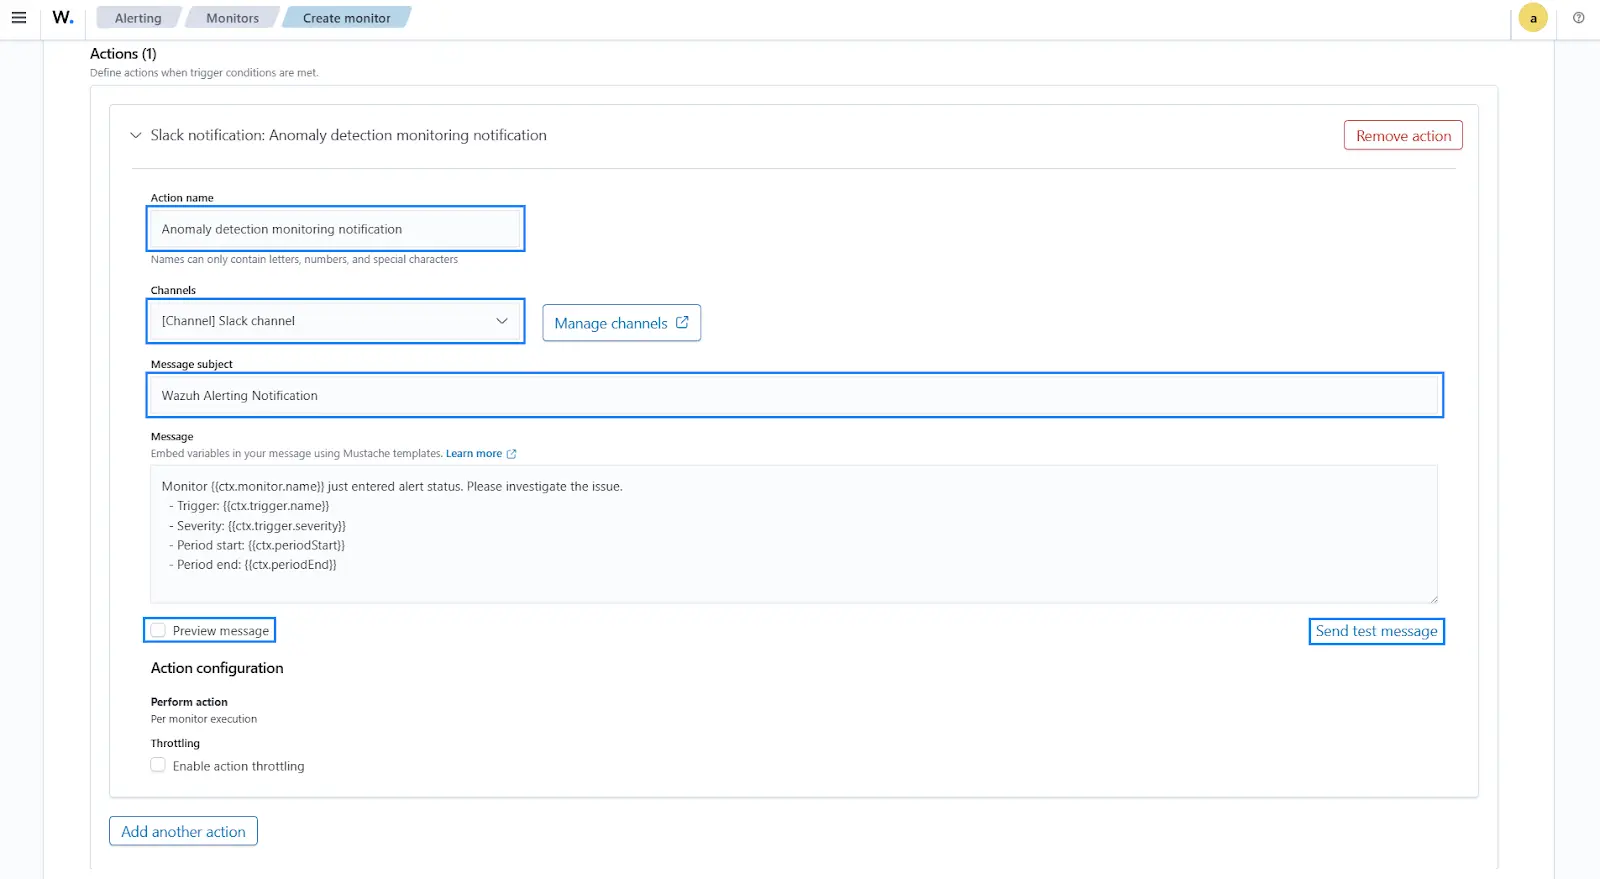
12. Click on the Create button to complete the Per query monitor configuration.
Attack emulation
We perform a brute force attack against the SSH service on the Ubuntu endpoint to trigger the Anomaly Detection plugin and generate anomalies on the Wazuh dashboard.
Kali Linux
Perform the steps below on the Kali Linux endpoint.
1. Create lists for usernames and passwords to use during the brute-force attack:
$ sudo apt-get install pwgen -y
$ pwgen 5 40 >> user.txt
$ pwgen 16 40 >> pass.txt
2. Start the password brute-forcing process by executing the following command:
$ hydra -L user.txt -p pass.txt <UBUNTU_IP> ssh -t 4
Result
1. Navigate to the Anomaly detection monitoring dashboard under the Monitors tab in the Alerting section of your Wazuh dashboard.
You should see an Overview of the anomaly detection monitor, Triggers indicating a brute-force attack, a History of anomaly triggers, and an Alerts section that shows details of events.
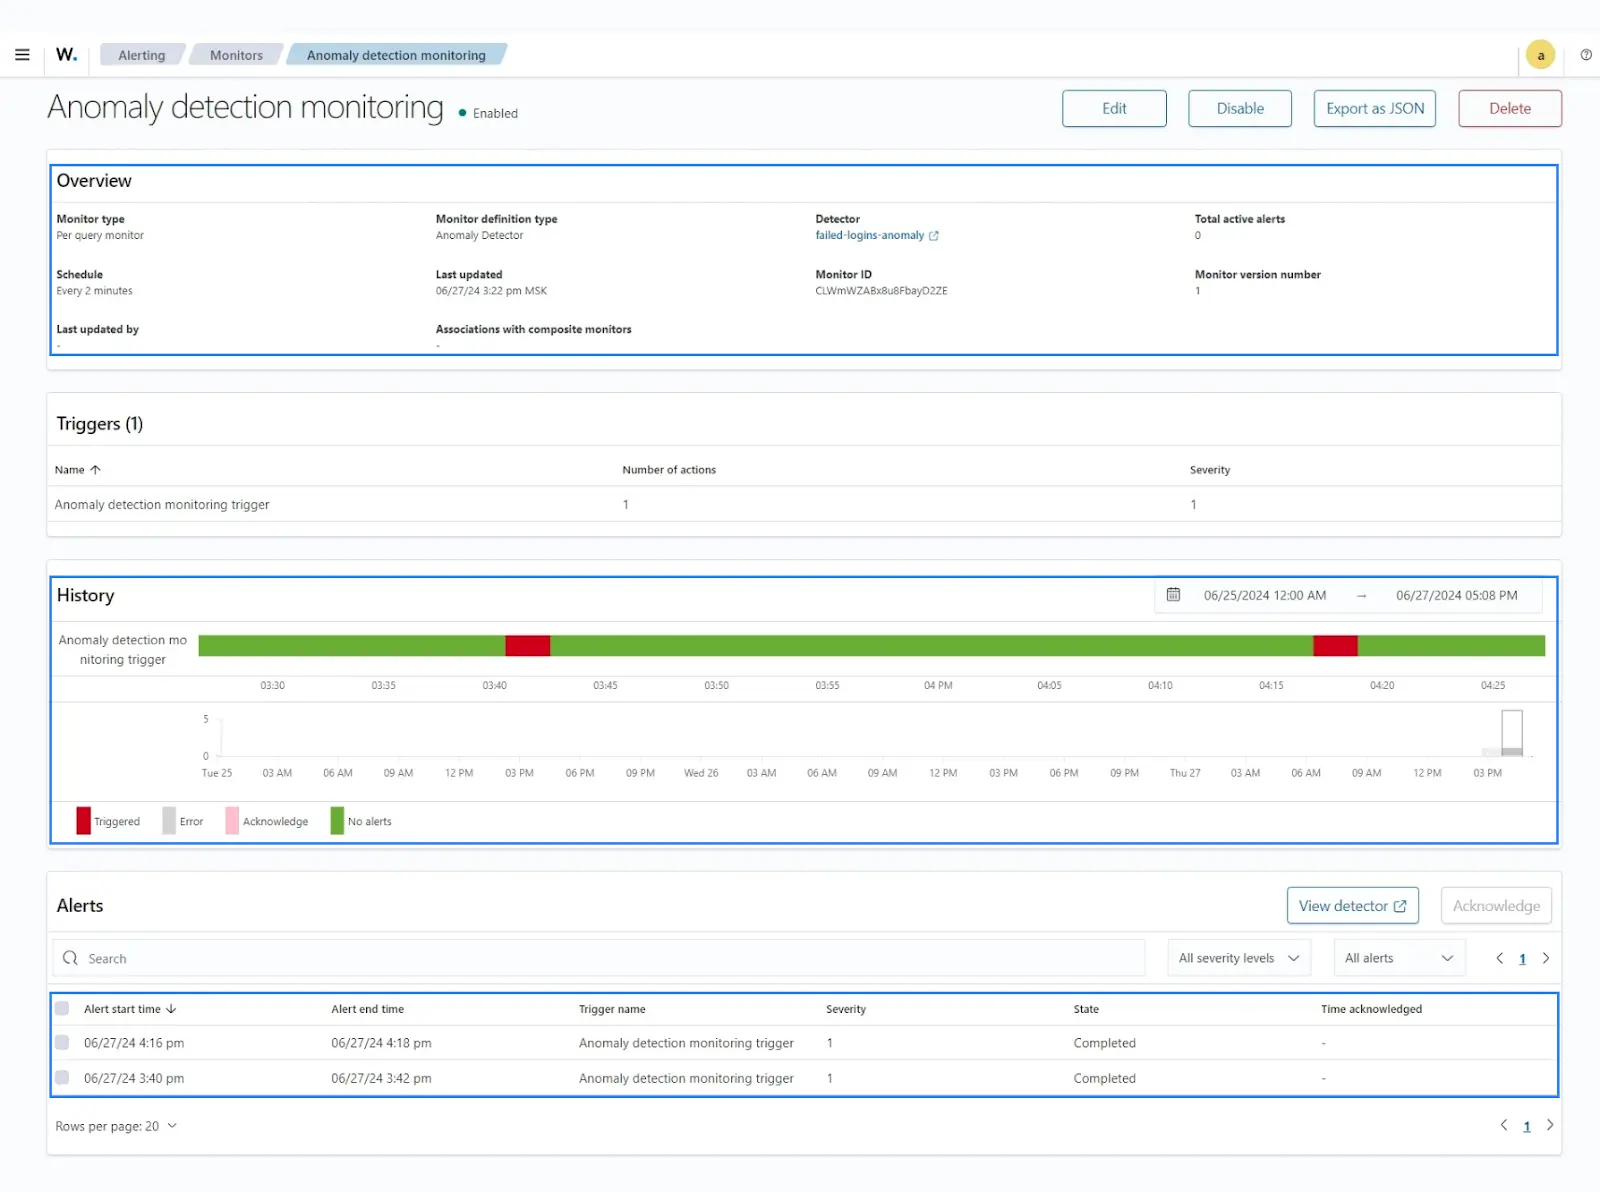
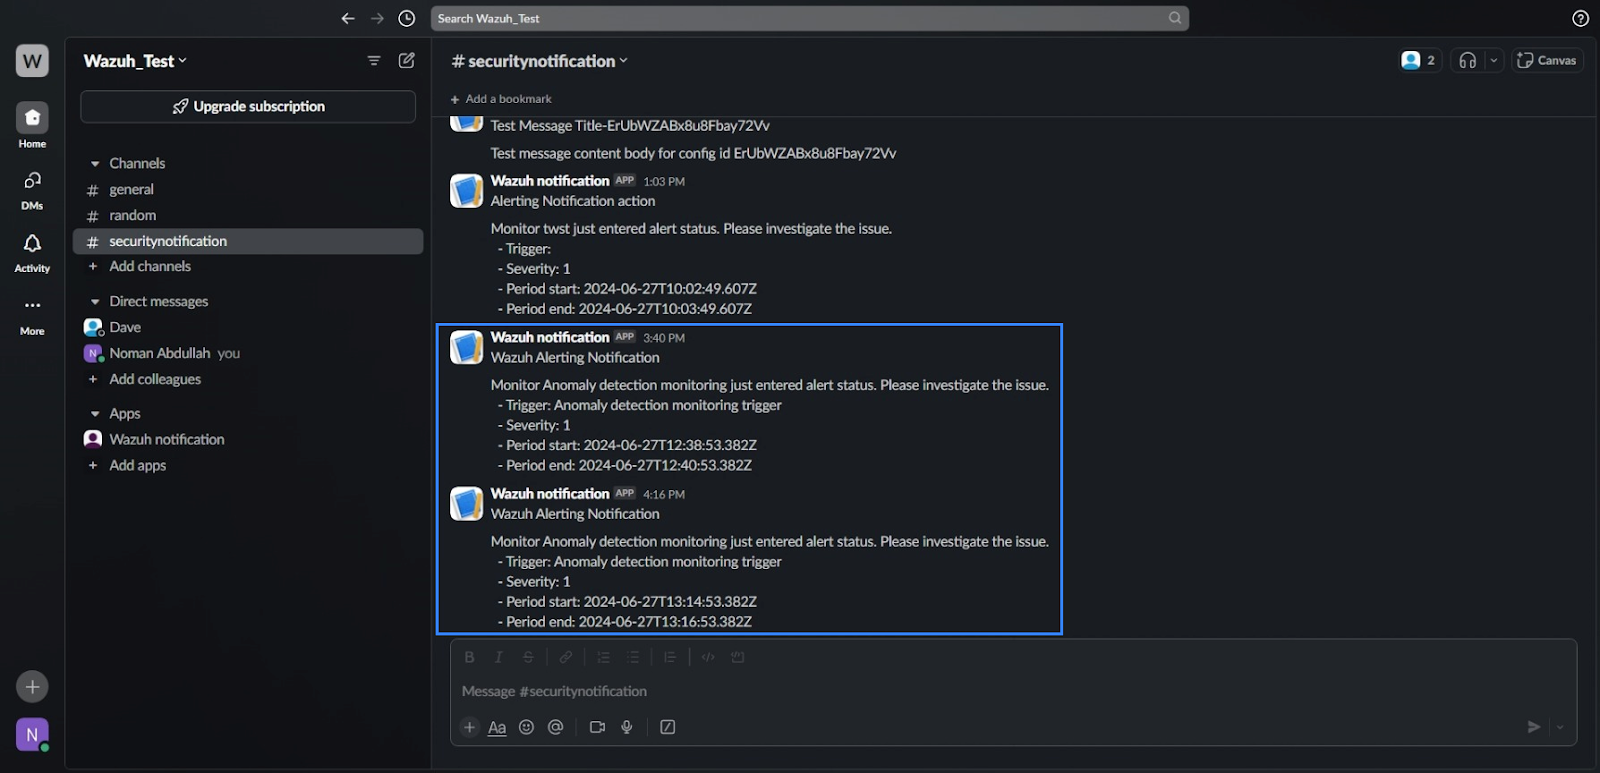
2. Open the preconfigured Slack channel. You should see the below security notifications from the Slack bot.
Detecting abnormal file deletion activities using Per bucket monitor
In this use case, we demonstrate how to set up a Per bucket monitor on your Wazuh dashboard to detect abnormal file deletion activities on a monitored endpoint. We aim to detect file deletion activities that happen within a very short timeframe.
The Wazuh File Integrity Monitoring (FIM) module is specifically designed to monitor changes in the file system, enabling detection of file creation, modification, and deletion. Activating the Wazuh FIM module allows effective monitoring and detection of file deletion activities on the endpoint.
The following steps outline how to configure the Wazuh FIM module and the alerting plugin to identify abnormal file deletion activities using the Per bucket monitor.
Ubuntu
This section provides a step-by-step guide on configuring the Wazuh FIM module on a monitored Ubuntu endpoint. This configuration is essential to capture file deletion events on the monitored endpoint. To achieve this, follow the outlined steps to configure Wazuh File Integrity Monitoring on the Ubuntu endpoint.
1. Create the wazuh_alerting directory in / location:
# mkdir /wazuh_alerting
2. Edit the Wazuh agent /var/ossec/etc/ossec.conf configuration file and add the following content within the <syscheck> block:
<directories check_all=”yes” report_changes=”yes” realtime=”yes”>/wazuh_alerting</directories>
3. Restart the Wazuh agent to apply the configuration changes:
# systemctl restart wazuh-agent
Wazuh dashboard
Perform the steps below to configure the Per bucket monitor to generate security notifications for any abnormal file deletion activities.
Per bucket monitor configuration
Complete the sections below to create a new Per bucket monitor on the Wazuh dashboard from Wazuh alerts.
1. Select Explore > Alerting > Create monitor to create a new monitor for abnormal file deletions.

2. Specify “Abnormal file deletion monitoring” as a Monitor name under the Monitor details section.
3. Select Per bucket monitor under Monitor type in the Monitor details section.
4. Select the Extraction query editor as the preferred method at the Monitoring defining method for defining the query and trigger.
5. Select By interval from the drop-down at the frequency block of the Schedule section
6. Select 1 and minutes at the run every block of the Schedule section.
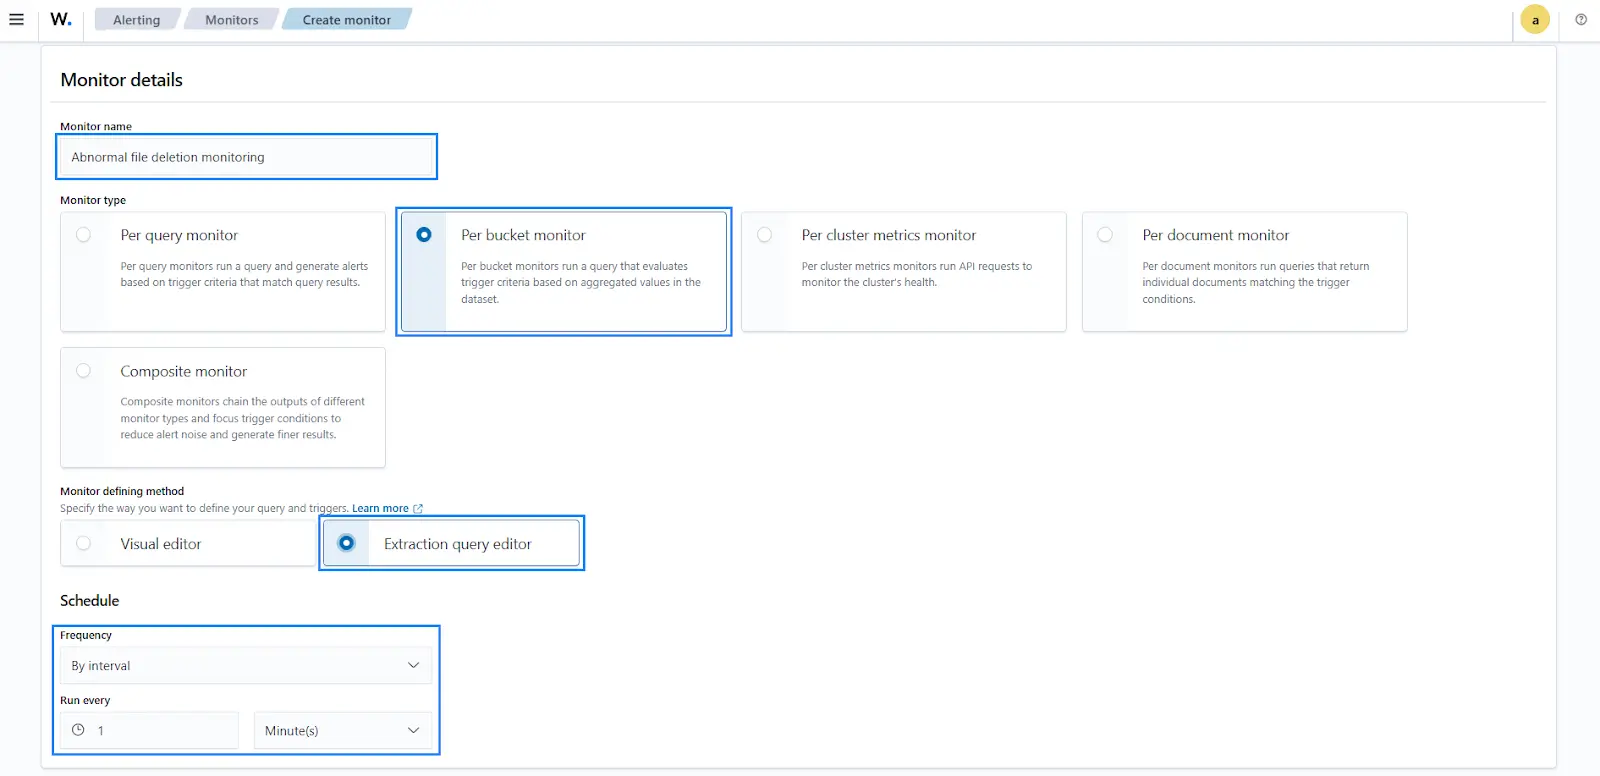
7. Enter the Index wazuh-alerts-* as the Data Source to collect Wazuh security data.

Below, we define the query to detect abnormal file deletion using a Painless script.
8. Copy and paste the Painless script below to the Define extraction query box. The script checks for alerts decoded by syscheck_deleted from all connected agents within a three-minute timeframe.
{
  "size": 0,
  "query": {
    "bool": {
      "filter": [
        {
          "term": {
            "decoder.name": {
              "value": "syscheck_deleted"
            }
          }
        },
        {
          "range": {
            "@timestamp": {
              "from": "now-3m"
            }
          }
        }
      ]
    }
  },
  "aggregations": {
    "deleted_files": {
      "terms": {
        "field": "agent.name"
      }
    }
  }
}
9. Select Run to execute the query. This is to check if the query is valid.
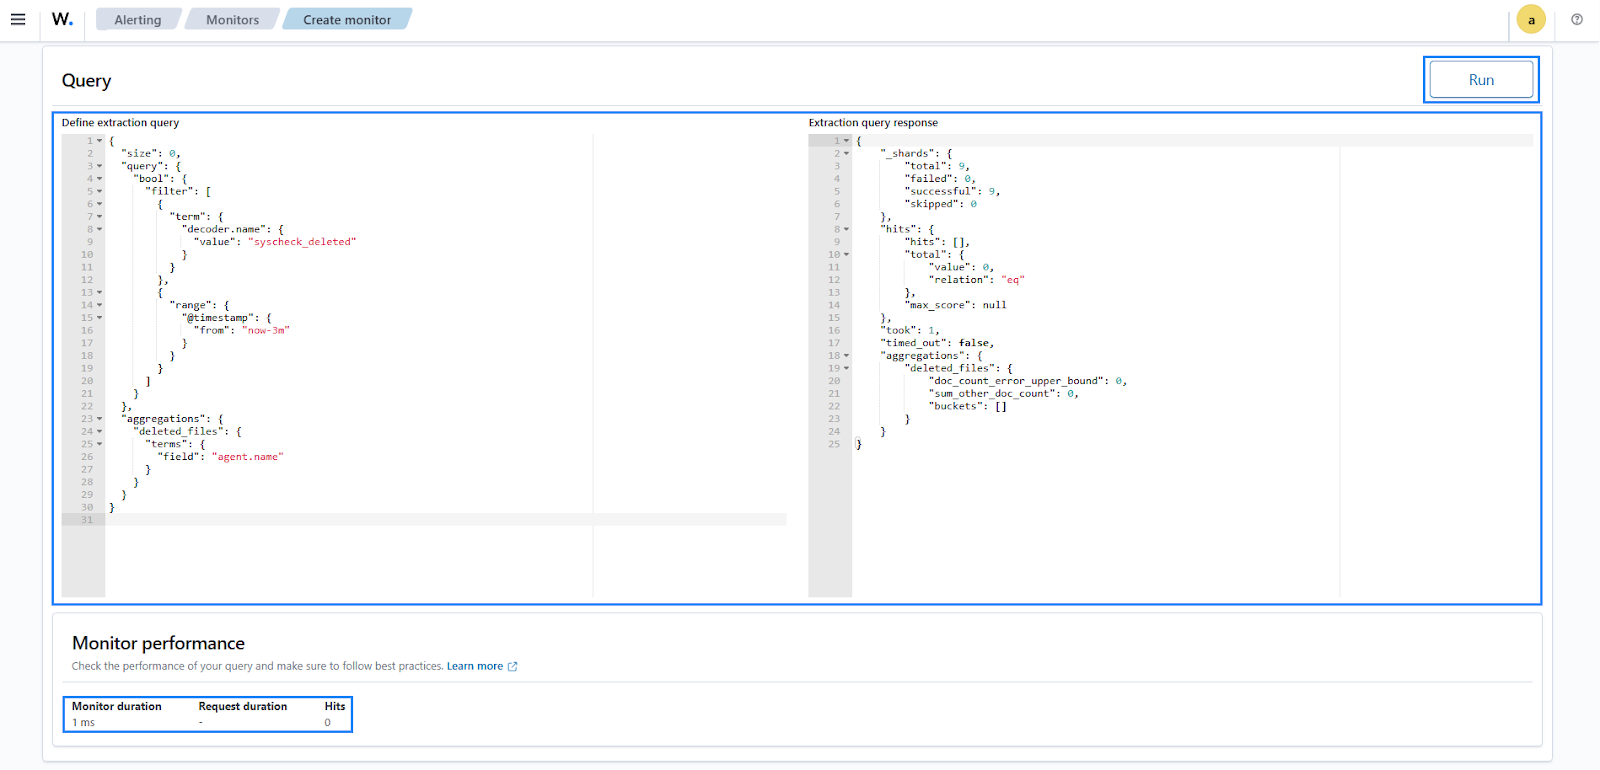
Now, we define a trigger that incorporates alert conditions for the extraction query introduced in the previous section.
10. Select Add trigger to define conditions and actions.
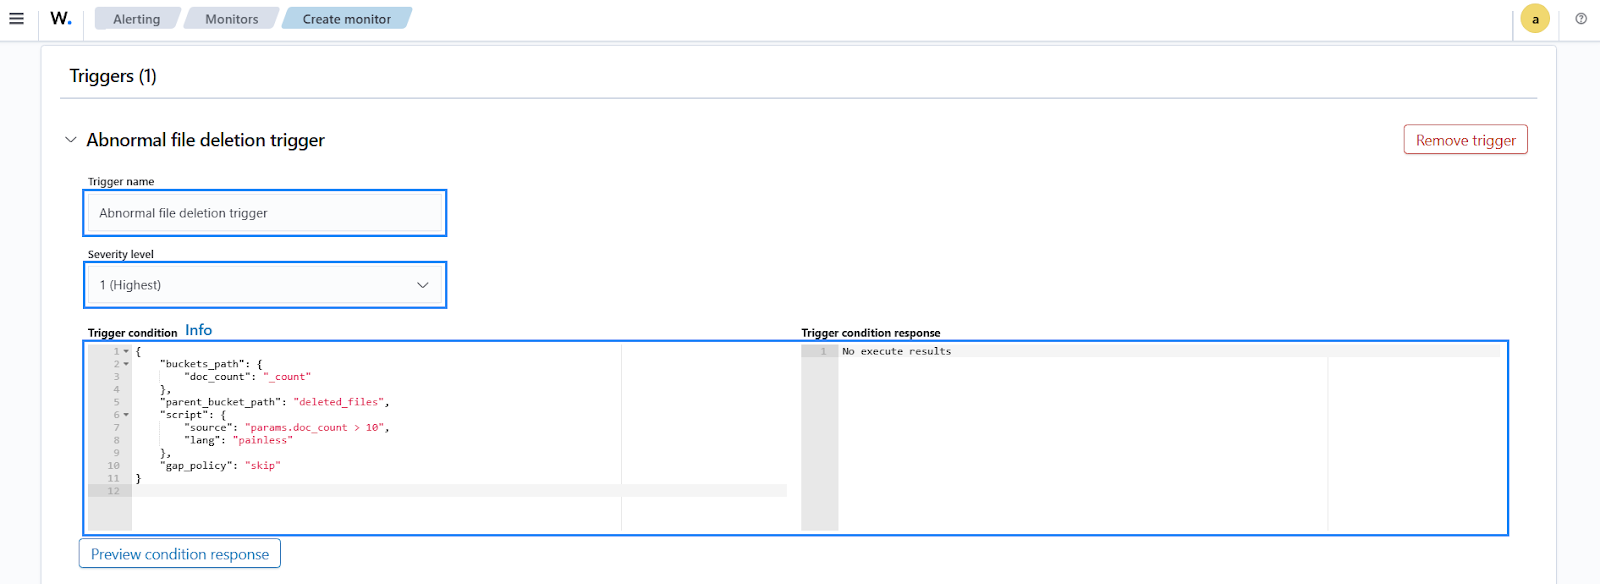
11. Specify the Trigger name as “Abnormal file deletion trigger”.
12. Specify the Severity level as 1 Highest.
13. Copy and paste the painless script below to the Trigger condition. The script counts deleted files based on the configured extraction query and triggers an alert if the count exceeds 10.
{
    "buckets_path": {
        "doc_count": "_count"
    },
    "parent_bucket_path": "deleted_files",
    "script": {
        "source": "params.doc_count > 10",
        "lang": "painless"
    },
    "gap_policy": "skip"
}
14. Click on the Preview condition response to see the expected response from the query.
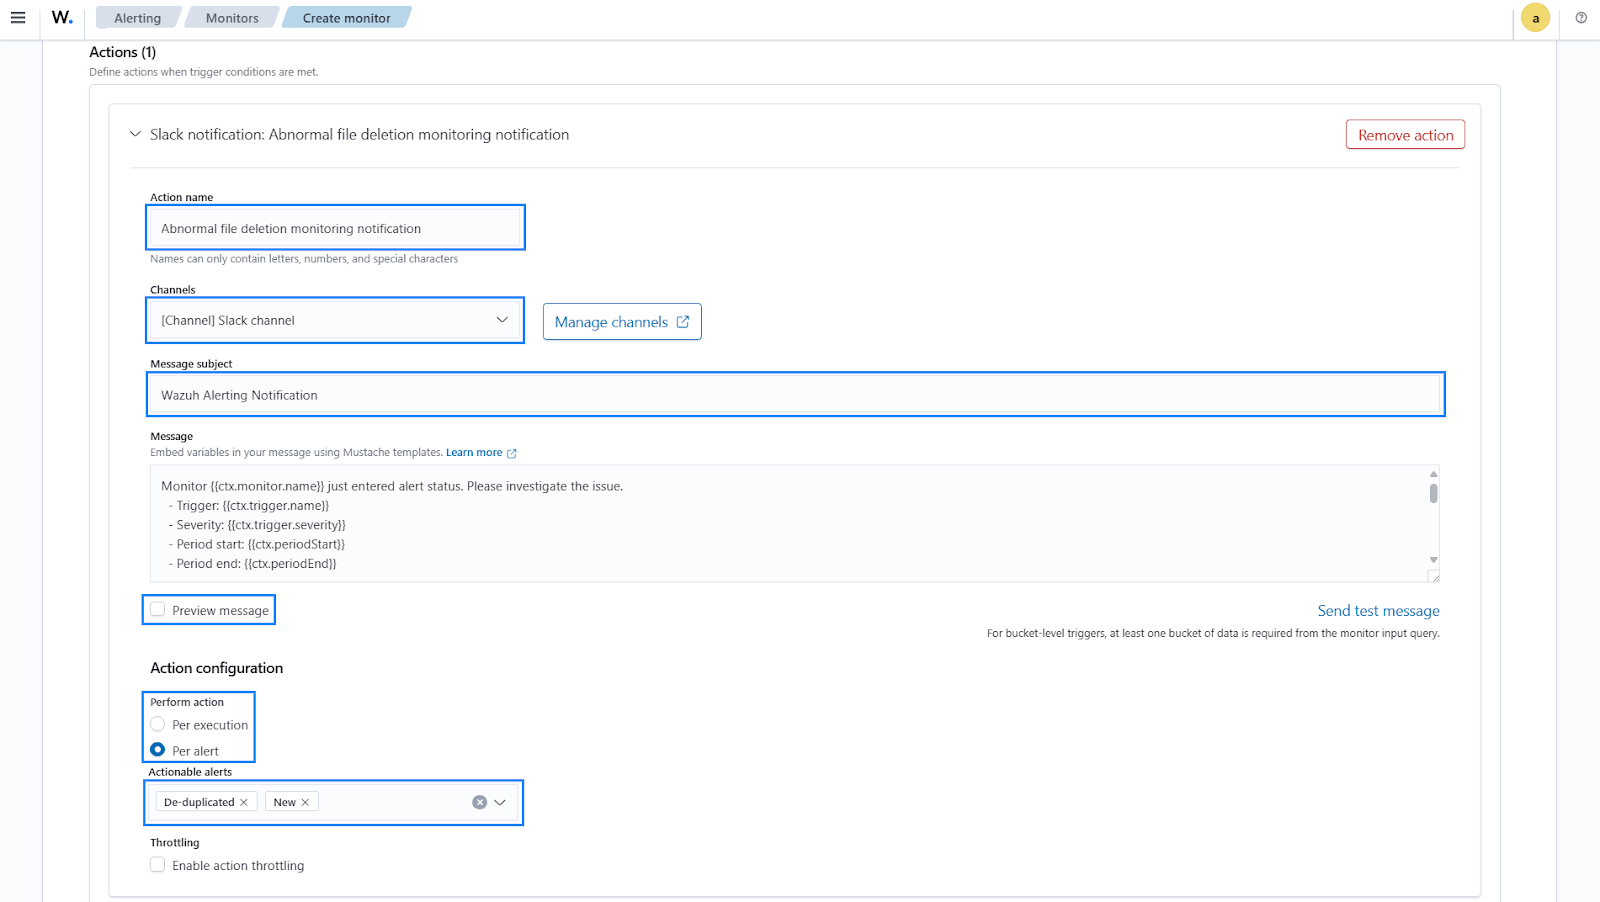
15. Specify “Abnormal file deletion monitoring notification” as the Action name.
16. Select Slack channel from Channels.
17. Specify “Wazuh Alerting Notification” as the Message subject. We will use the default message template here.
18. Select Per alert as the Perform action under Action configuration.
19. Click on the Create button to complete the Per bucket monitor configuration.
Attack emulation
With the Per bucket monitor now in place for this section, we have created a Python script designed to trigger the alert notifications.
The core function of the script is managing 20 files by creating and deleting them. This scripted activity aligns with the monitoring system parameters, which have been configured to detect the deletion of more than 3 files within a monitored directory within a 3-minute timeframe.
In essence, this script serves as a testing mechanism, allowing us to confirm the readiness and responsiveness of our monitoring system, ensuring it will promptly alert us when it observes the specified file deletion patterns.
Ubuntu
Perform the steps below on the monitored Ubuntu endpoint.
1. Create a file named abnormal_file_deletion_poc.py on the root (/) directory:
# touch /abnormal_file_deletion_poc.py
2. Add the following content to the newly created /abnormal_file_deletion_poc.py file.
#!/usr/bin/python3

import os
import time

# Define the directory where you want to create the files
target_directory = "/wazuh_alerting"

def create_files(directory, num_files):
    try:
        os.makedirs(directory, exist_ok=True)
        for i in range(1, num_files + 1):
            file_name = f"file{i}.txt"
            file_path = os.path.join(directory, file_name)

            # Use 'w' mode to create a new file or overwrite an existing one
            with open(file_path, 'w') as file:
                # You can write content to the file here if needed
                pass  # Nothing to write in this example

            print(f"Created {file_name} at {directory}")
    except Exception as e:
        print(f"An error occurred while creating the files: {str(e)}")

def delete_files(directory, num_files):
    try:
        for i in range(1, num_files + 1):
            file_name = f"file{i}.txt"
            file_path = os.path.join(directory, file_name)
            if os.path.exists(file_path):
                os.remove(file_path)
                print(f"Deleted {file_name} at {directory}")
            else:
                print(f"File {file_name} not found.")
    except Exception as e:
        print(f"An error occurred while deleting the files: {str(e)}")

if __name__ == "__main__":
    num_files_to_create = 20

    create_files(target_directory, num_files_to_create)
    time.sleep(2)
    delete_files(target_directory, num_files_to_create)

    print("All files have been created and deleted.")
3. Execute the abnormal_file_deletion_poc.py script to generate a security notification:
# python3 /abnormal_file_deletion_poc.py
Result
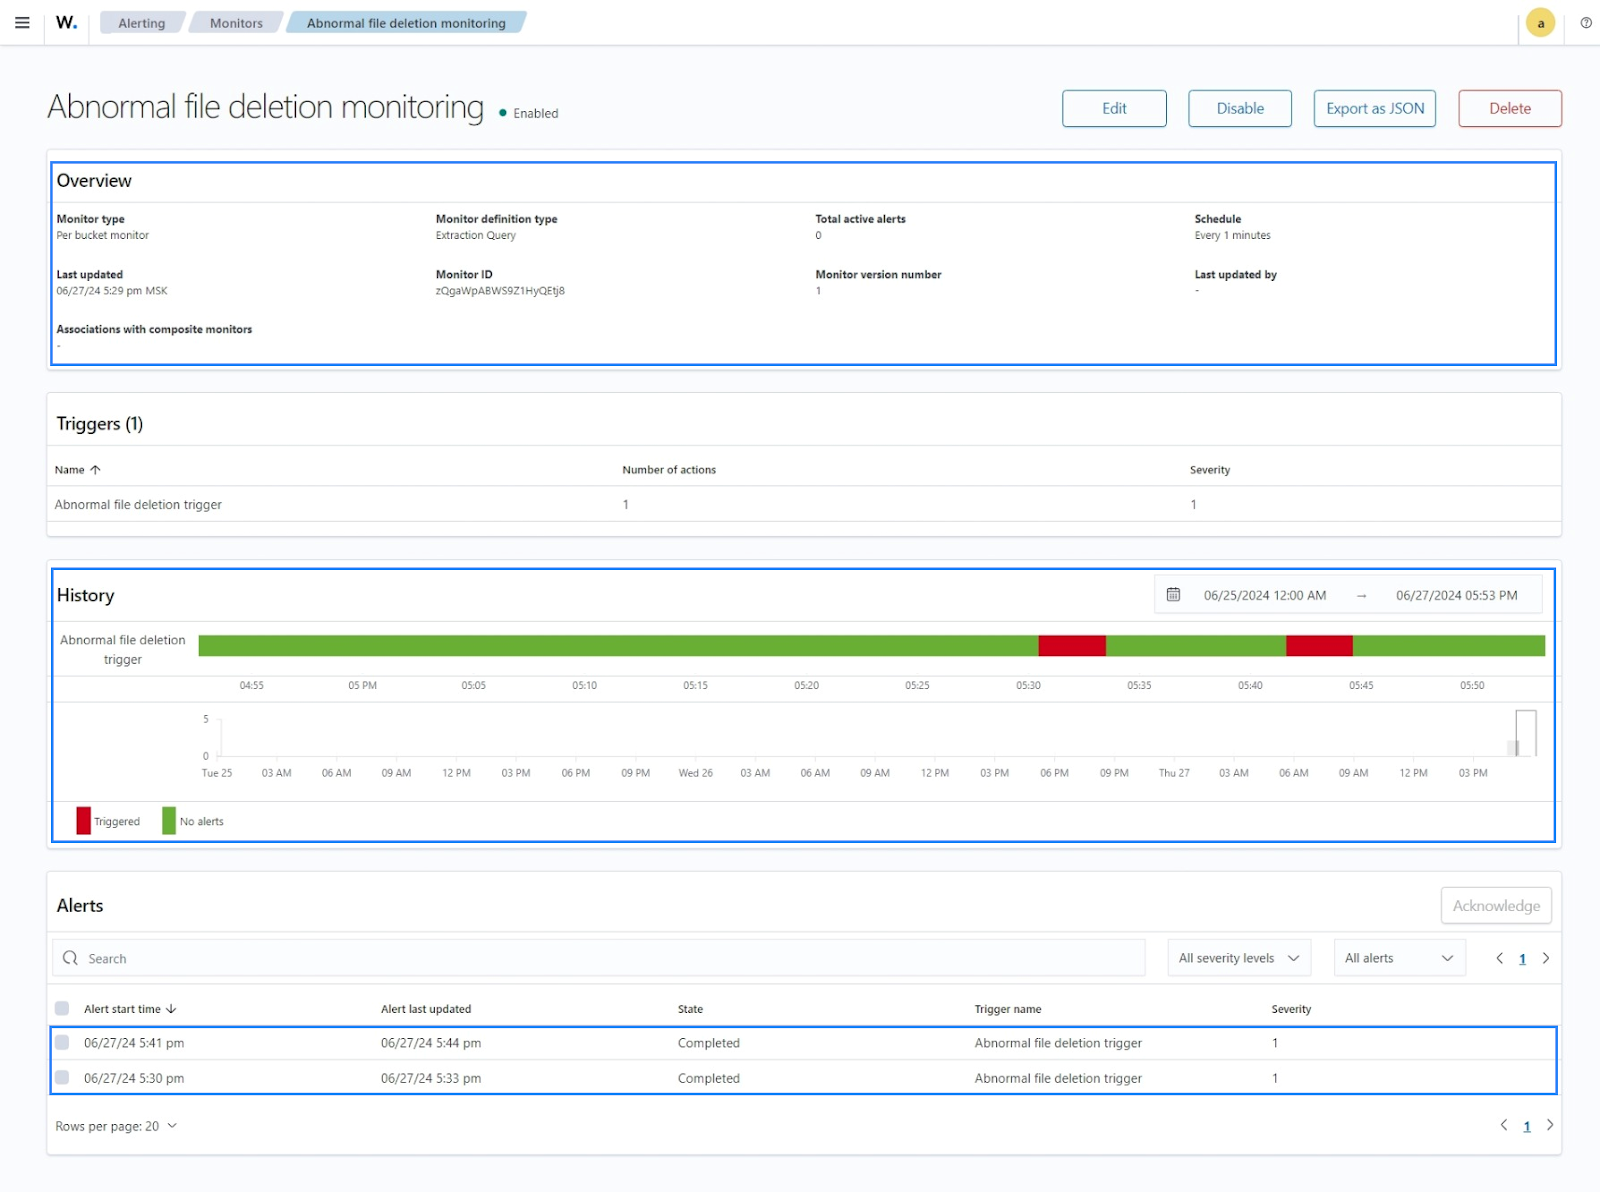
1. Navigate to the Abnormal file deletion monitoring dashboard under the Monitors tab in the Alerting section of your Wazuh dashboard.
You should see an Overview of the abnormal file deletion activities monitor, Triggers for the Python script execution, a History of file deletion activities due to the script, and an Alerts section that shows details of events.
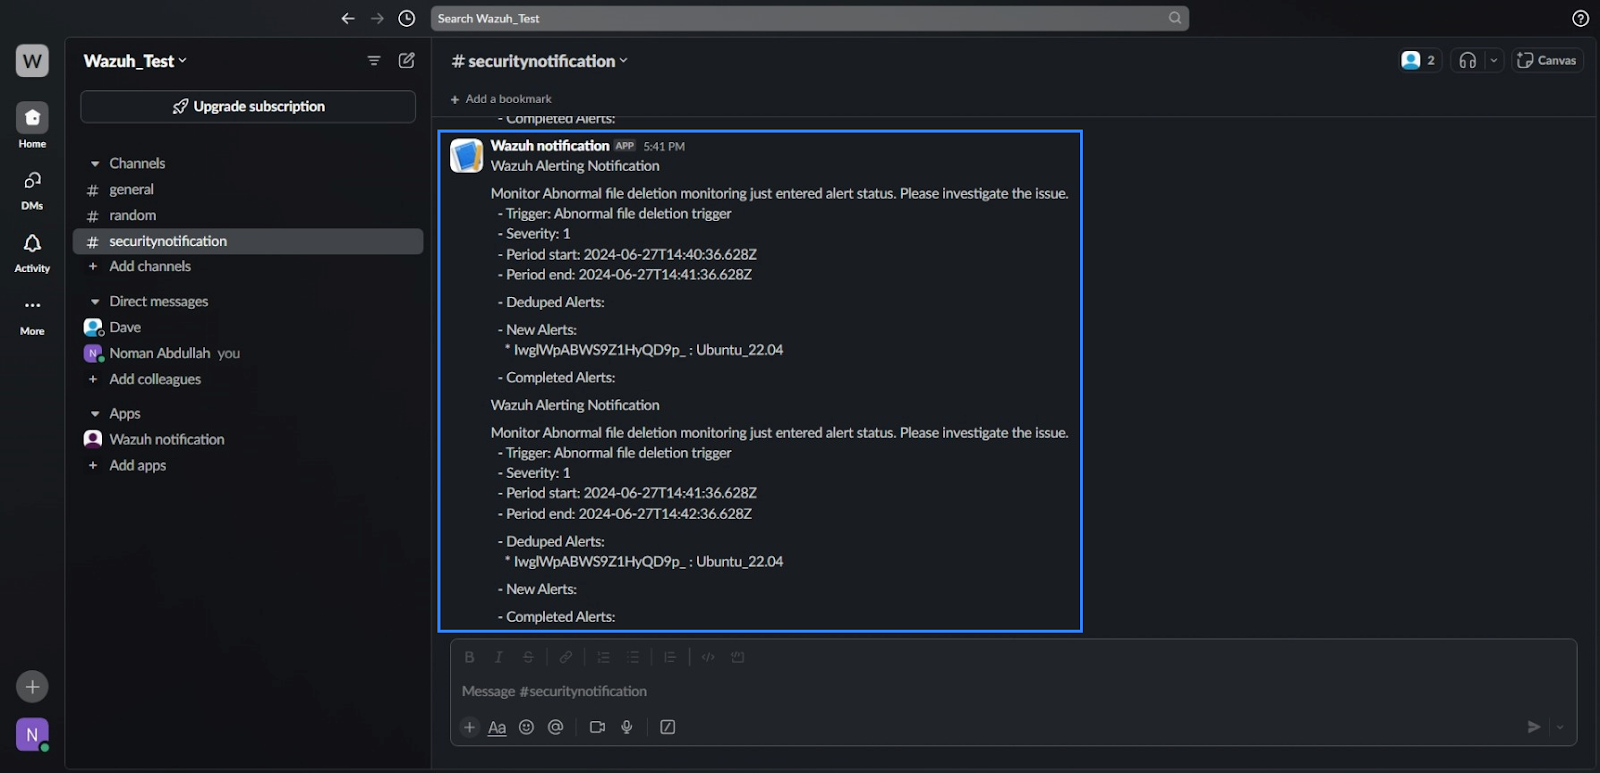
2. Open the preconfigured Slack channel. You should see the below security notification from the Slack bot.
Conclusion
In this blog post, we demonstrated how to maximize alerting capability in Wazuh for prompt security notifications regarding high-severity incidents. We also showcased anomaly detection and abnormal file deletion monitoring based on Per query monitor and Per bucket monitor. We will cover other monitor types in our next blog post.
Wazuh is a free and open source SIEM and XDR solution. Wazuh can be deployed and managed on-premises or on the Wazuh cloud. Check out our community for support and updates.
Reference
