Anomaly detection in cybersecurity is a monitoring capability to detect suspicious activity or changes in data or networks. By detecting unusual patterns of behavior, organizations can detect and isolate abnormal activities that could indicate a malicious threat. Anomalies can be found in different forms of security telemetry, including network traffic, user behavior, and system resource utilization. Advanced anomaly detection techniques can help organizations detect potential threats before they become a real problem. Organizations can better protect their networks and data by implementing anomaly detection strategies.
In this blog post, we describe how to combine Wazuh and the OpenSearch Anomaly Detection plugin to enhance the detection of anomalous behavior in an IT infrastructure. This blog post uses the Wazuh dashboard 4.5.3 which is based on OpenSearch 2.6.0. Additionally, this blog post provides use cases that showcase the effectiveness of incorporating this OpenSearch plugin with Wazuh.
Prerequisites
- A pre-built, ready-to-use Wazuh OVA 4.5.3 that includes the Wazuh core components (Wazuh server, Wazuh indexer, and Wazuh dashboard). Follow the Virtual Machine (OVA) – Installation guide to download and set up the Wazuh virtual machine.
Anomaly Detection plugin installation
We use the OpenSearch Anomaly Detection plugin to find anomalies from ingested alert data. It uses the Random Cut Forest (RCF) algorithm to detect anomalies in near real-time. Install and configure the OpenSearch Anomaly Detection plugin on your Wazuh dashboard to find anomalies in the ingested data.
Wazuh dashboard
We install the OpenSearch Anomaly Detection plugin on the Wazuh dashboard to identify and mitigate suspicious activity. Perform the steps below on the command line as root to download and install the OpenSearch Anomaly Detection plugin.
1. Download the OpenSearch Dashboard 2.6.0 package:
# curl https://artifacts.opensearch.org/releases/bundle/opensearch-dashboards/2.6.0/opensearch-dashboards-2.6.0-linux-x64.tar.gz -o opensearch-dashboards.tar.gz
Note: Download the compatible version of OpenSearch Dashboards for your version of Wazuh. See the Wazuh release notes to get the compatible version of OpenSearch Dashboards.
2. Extract the OpenSearch Dashboard 2.6.0 package:
# tar -xvzf opensearch-dashboards.tar.gz
3. Copy the anomalyDetectionDashboards plugin files to the /usr/share/wazuh-dashboard/plugins directory:
# cp -r opensearch-dashboards-2.6.0/plugins/anomalyDetectionDashboards/ /usr/share/wazuh-dashboard/plugins/
Optional: Remove the downloaded OpenSearch Dashboards files after copying them to the Wazuh dashboard plugins directory:
# rm -rf opensearch-dashboards-2.6.0/ opensearch-dashboards.tar.gz
4. Change the ownership and permissions of the files:
# chown -R wazuh-dashboard:wazuh-dashboard /usr/share/wazuh-dashboard/plugins/anomalyDetectionDashboards/
# chmod -R 750 /usr/share/wazuh-dashboard/plugins/anomalyDetectionDashboards/
5. Restart the Wazuh dashboard for the changes to take effect:
# systemctl restart wazuh-dashboard
6. Verify that the plugin is installed correctly:
# sudo -u wazuh-dashboard /usr/share/wazuh-dashboard/bin/opensearch-dashboards-plugin list
Output
alertingDashboards@2.6.0.0 anomalyDetectionDashboards@2.6.0.0 customImportMapDashboards@2.6.0.0 ganttChartDashboards@2.6.0.0 indexManagementDashboards@2.6.0.0 mlCommonsDashboards@2.6.0.0 notificationsDashboards@2.6.0.0 reportsDashboards@2.6.0.0 securityDashboards@2.6.0.0 wazuh@4.5.3-02 |
Configuration
Configure the OpenSearch Anomaly Detection plugin to ingest Wazuh data such as wazuh‑alerts-*, wazuh‑archives-*, wazuh‑monitoring-*, wazuh‑statistics-*, and detect anomalies in them. Log in to the Wazuh dashboard or refresh it if you are already logged in. Then, navigate to Anomaly Detection under OpenSearch Plugins to create a new anomaly detector.
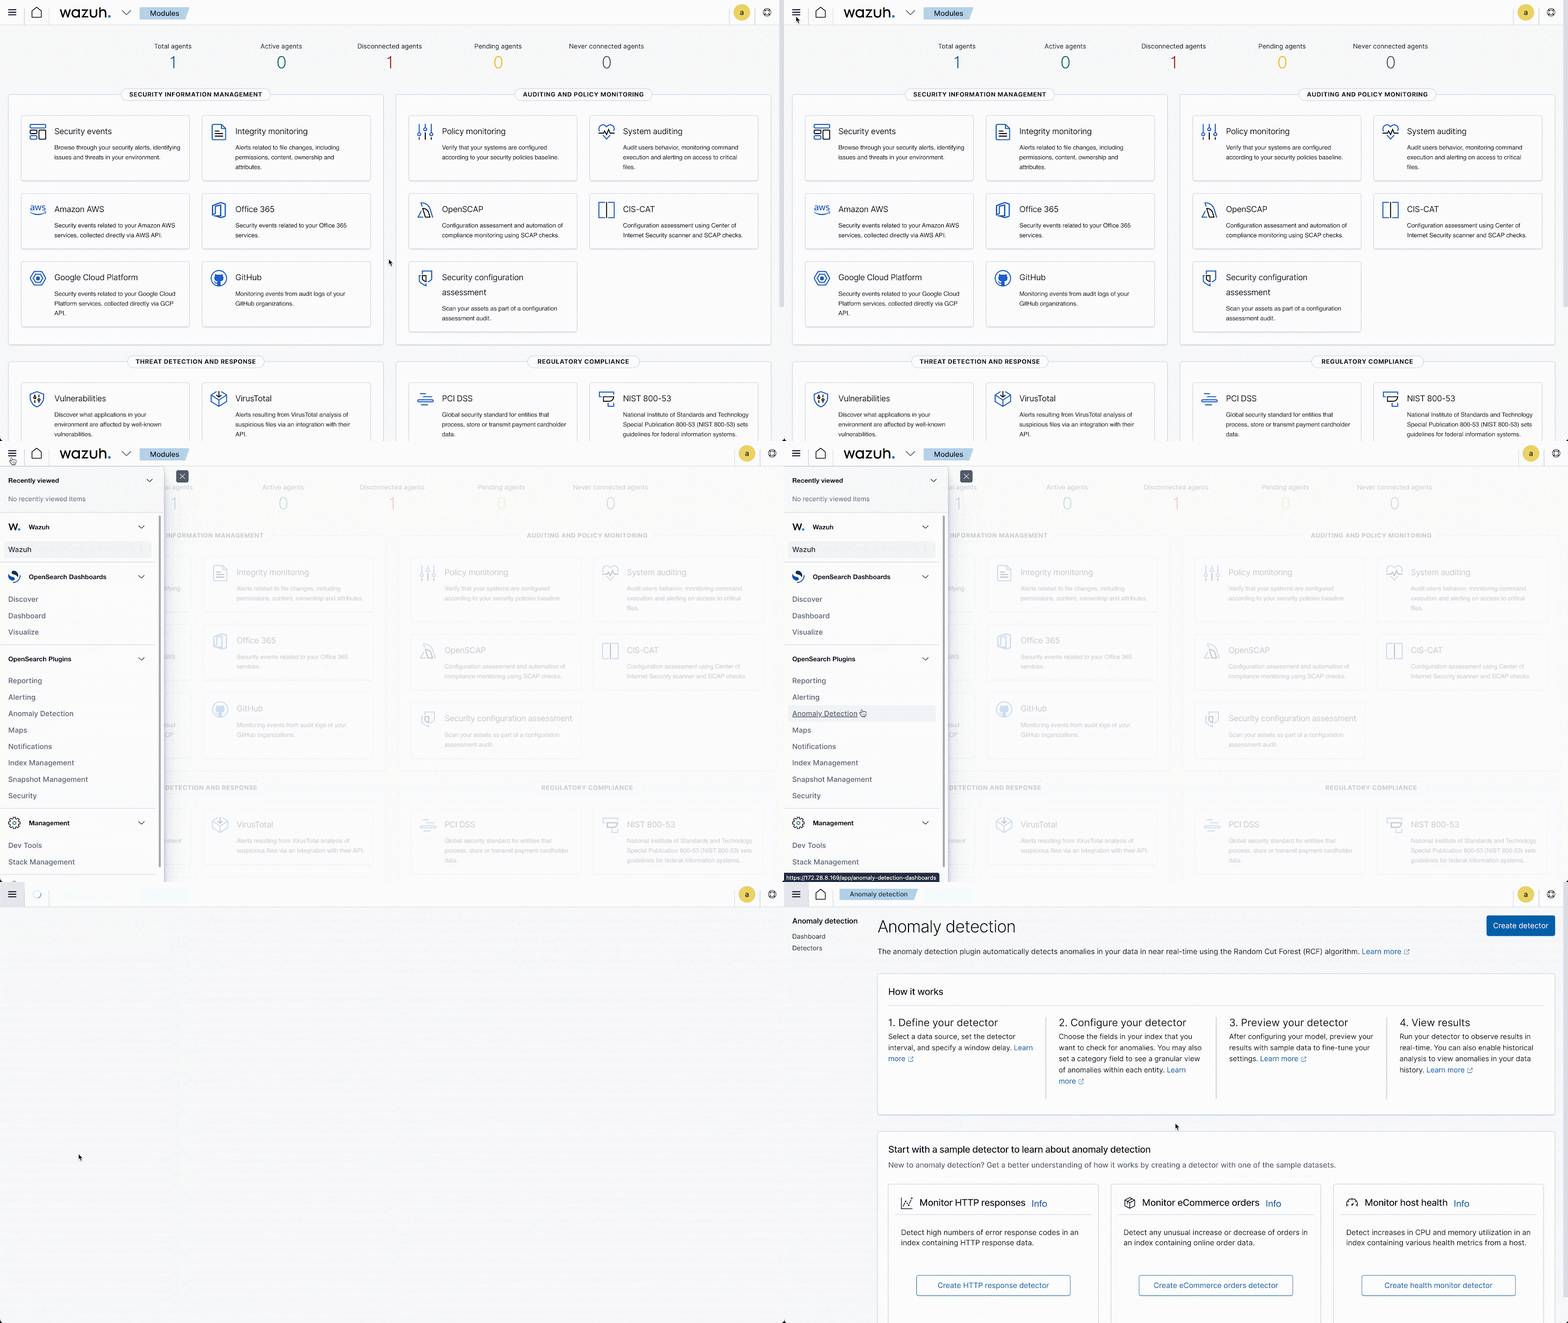
We need to complete four sections with relevant information to create an anomaly detector. Follow the steps below to create a sample detector:
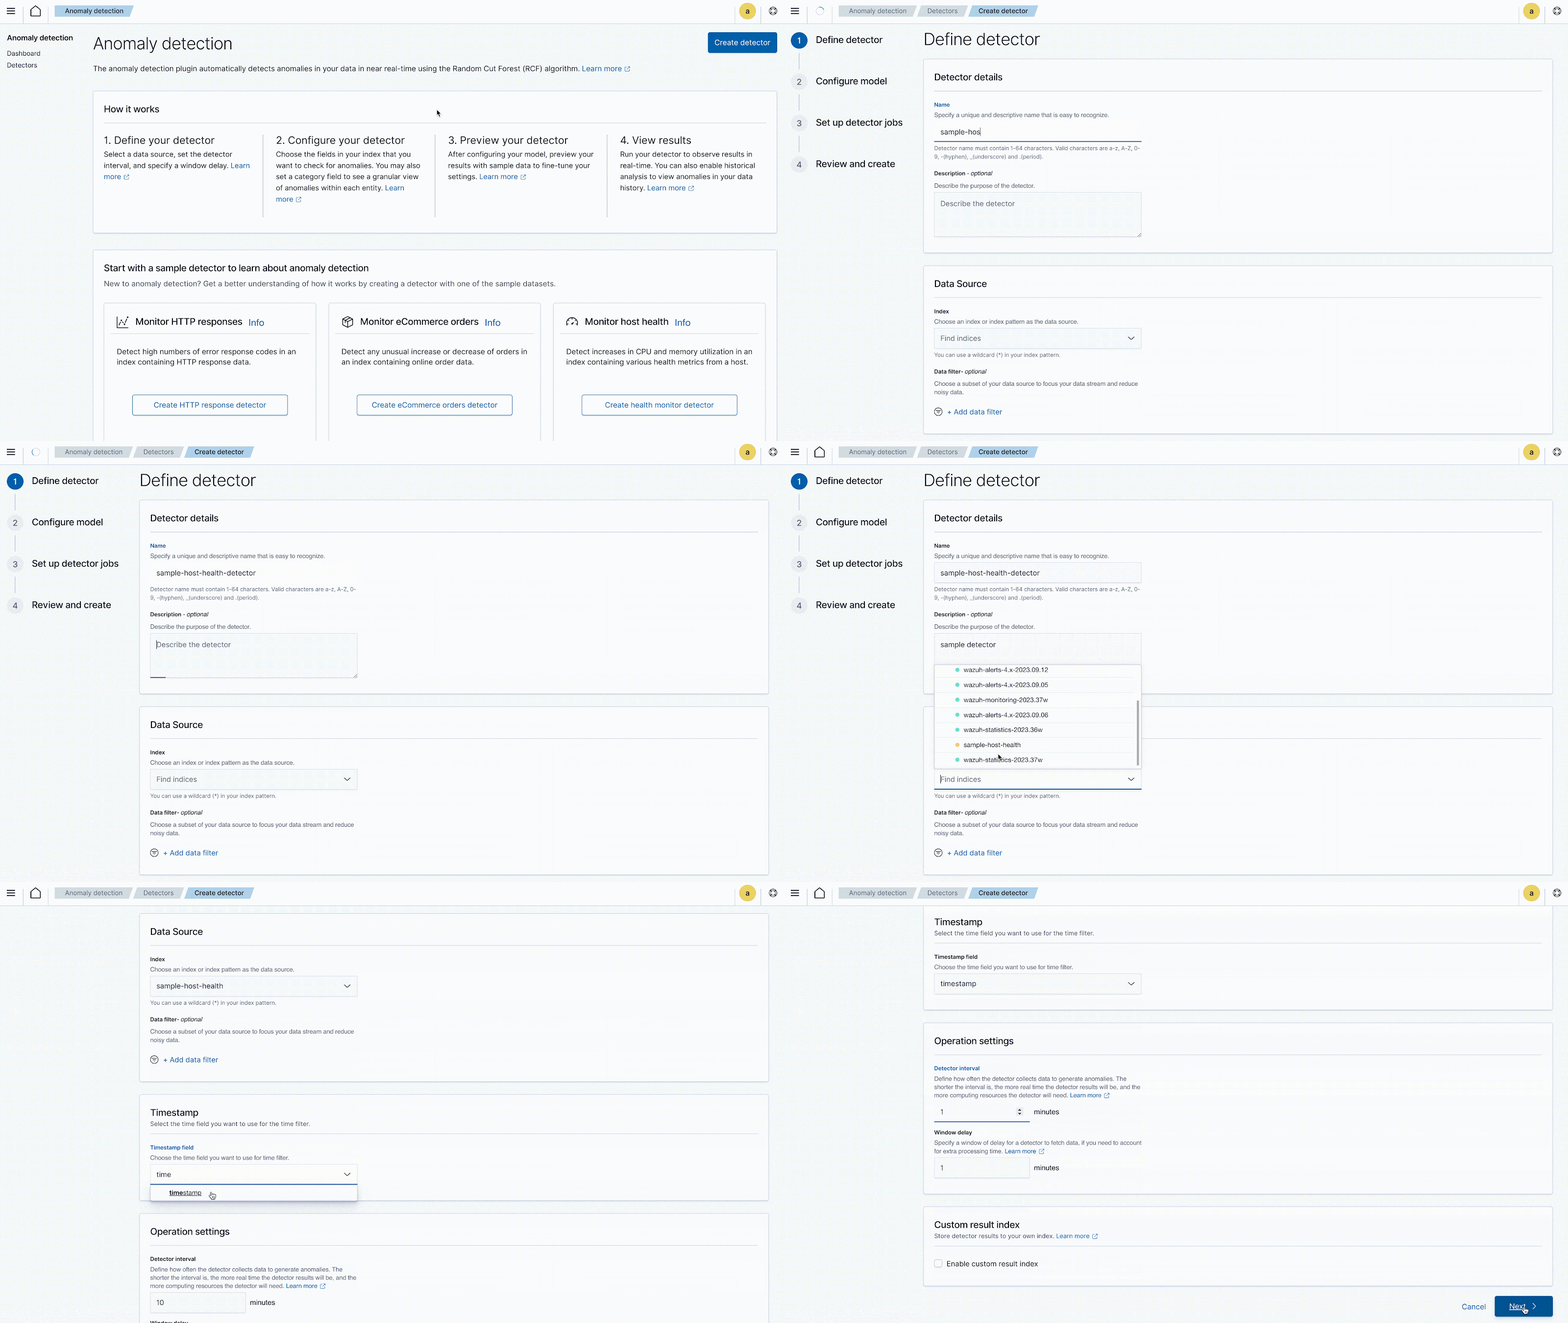
Define detector
Creating an anomaly detector begins with the first step of defining the anomaly detector. Follow the steps below to get started:
1. Click on Create detector to configure a new detector.
2. Specify a Name and provide a suitable Description of the new detector under the Detector details section.
3. Select an Index (for example, wazuh-alerts-*, wazuh-archives-*, wazuh-monitoring-*, wazuh-statistics-*) as the data source and apply any Data filter if required.
4. Select the time filter you want using the Timestamp field in the Timestamp section.
5. Define a Detector interval that shows how often the detector collects data to generate anomalies and specify a window of delay for the detector to fetch data.
Note: The detection results are more real-time when the interval is lower, but it consumes more computing resources. For less data, we recommend using higher intervals so that the anomaly detector can gather more Wazuh data to populate the anomaly detection model.
6. Click Next to proceed with the next section.
Configure model
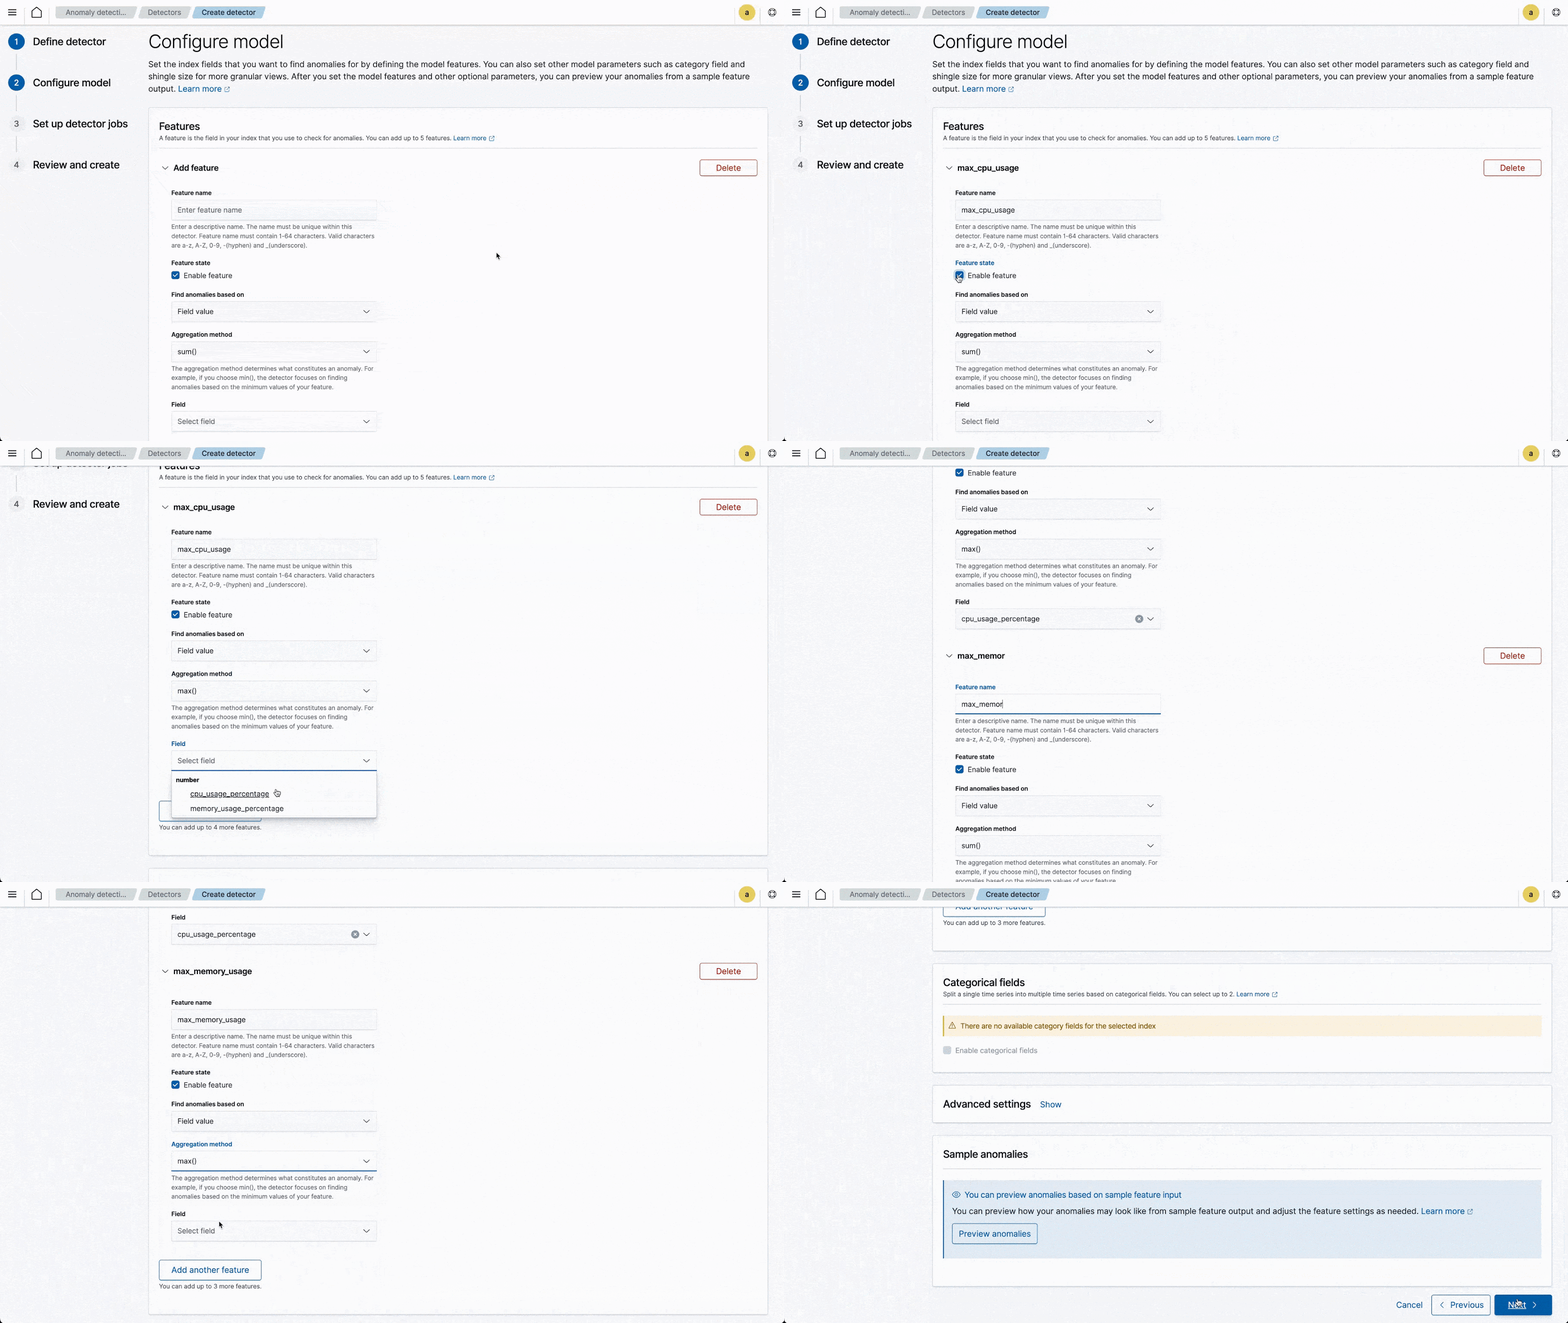
Define the index fields you want to detect anomalies for by specifying the model features. Model features are the fields in your index that you use to detect anomalies. This helps reduce the workload for your anomaly detector and allows you to focus on the specified index fields. Once you have set the model features and any other optional parameters, you can preview the anomalies it finds from the sample feature output.
Perform the steps below to configure your model’s features for your new detector:
1. Define a unique Feature name in the Add feature section.
2. Make sure the Feature state is marked to enable the feature.
3. Select Field value under the Find anomalies based on option. You can choose the Custom expression option if you have any.
4. Select an Aggregation method such as average(), count(), sum(), min(), max(). This option is visible only if you choose Field value in step 3.
5. Select the specific index Field that you want to check for anomalies.
Note: You can add up to five features for a custom detector.
6. Click Next to proceed with the next section.
Set up detector jobs
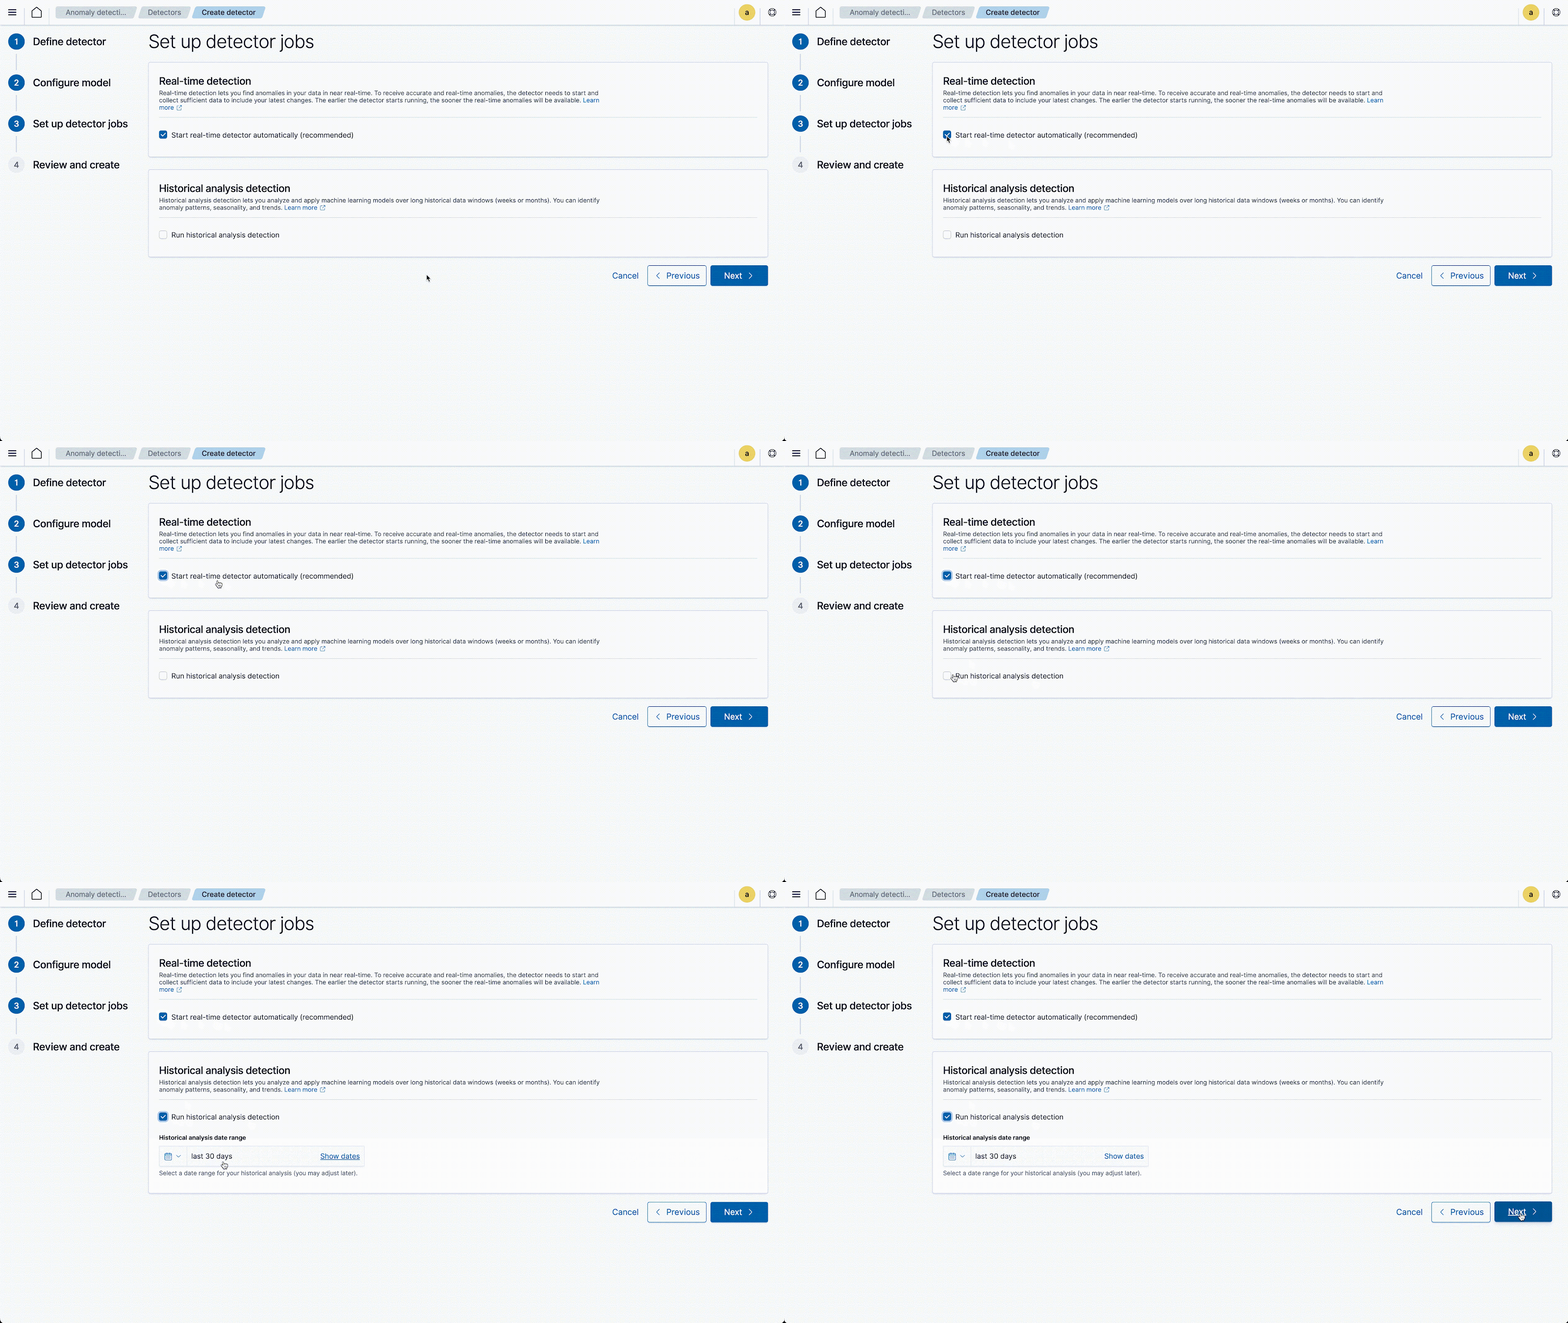
You can find two types of detector jobs – Real-time detection and Historical analysis detection. Real-time detection allows you to find anomalies in Wazuh data in near real-time. Whereas historical analysis detection allows you to analyze long historical data.
Select the Real-time detection detector jobs and click Next to move to the next section.
Review and create
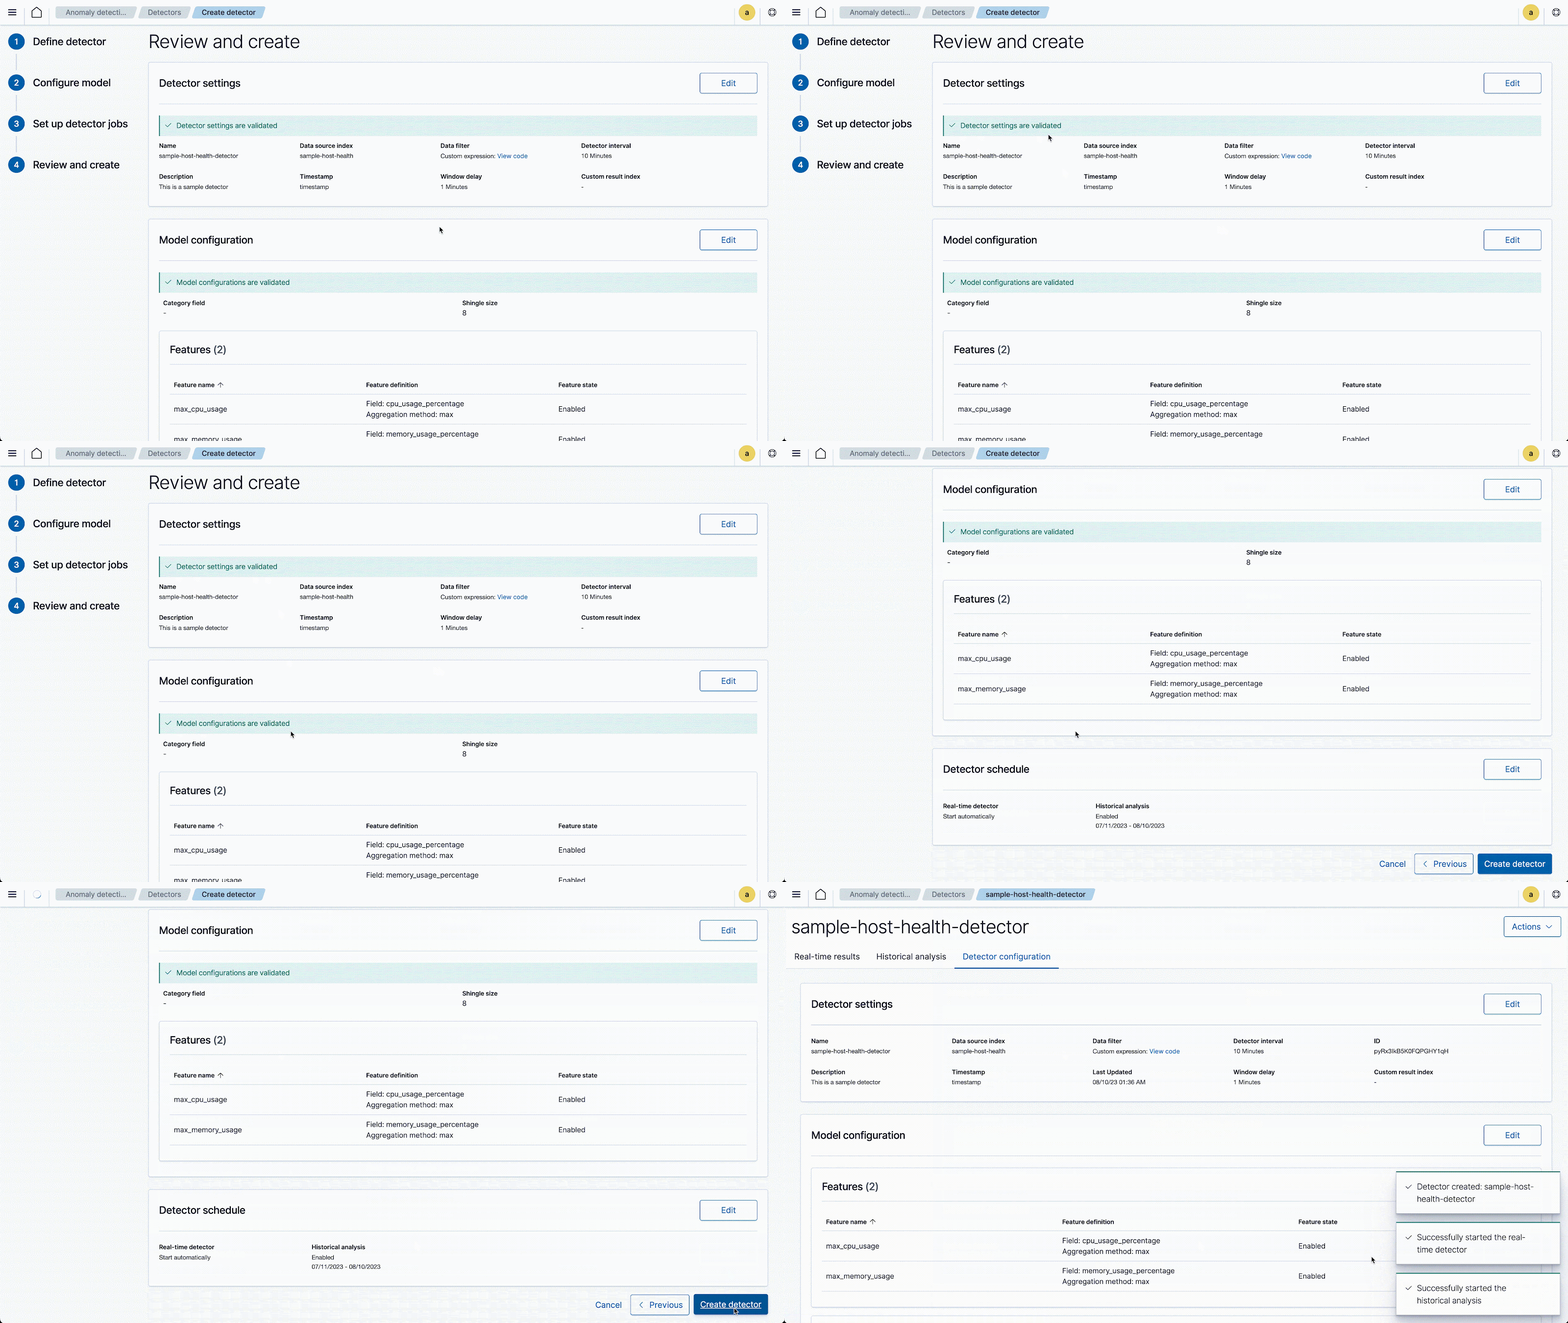
Verify all the configurations such as Detector setting, Model configuration, and Detector schedule. Then, click Create detector to confirm the detector creation process. In the next window, you will see successful messages for the detector and model creation.
The diagram below shows an overview of how the Anomaly Detection plugin works in Wazuh after successful configuration.
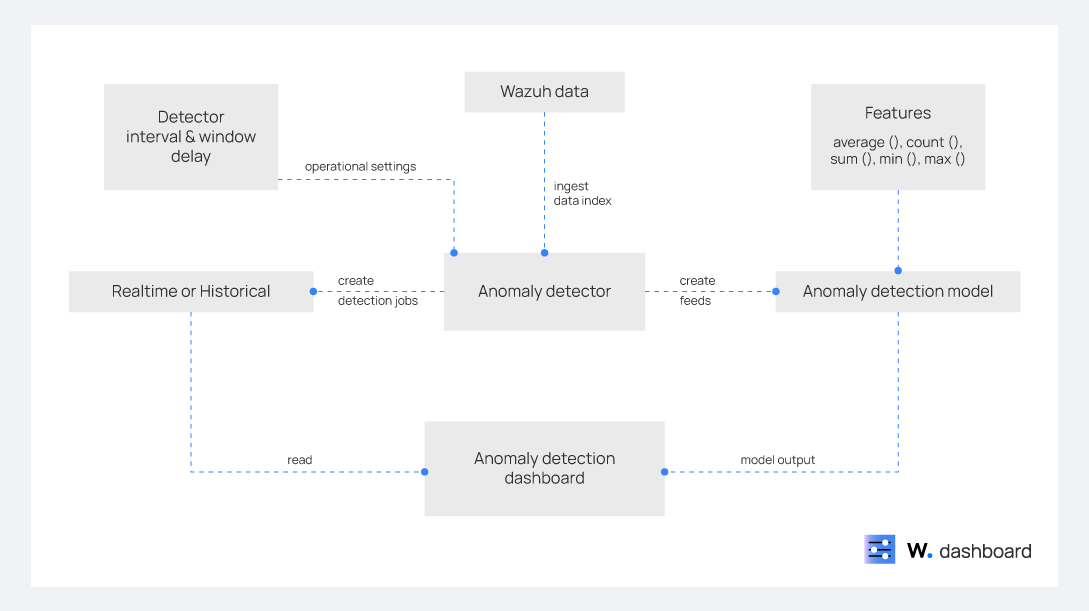
The Anomaly detector ingests Wazuh data and feeds it to the anomaly detection model. It has defined internal detectors and specified window delays to collect the data necessary for generating anomalies. Anomaly detection models are configured based on the fields of the Wazuh-indexed data and run through various features. Detector jobs, such as historical or real-time, determine how often the anomaly detector should generate anomalies.
Finally, the anomaly detector dashboard provides important information such as the last anomaly occurrence, anomaly grade and confidence, total number of anomalies, and more.
Use cases
The use cases below simulate real-world scenarios where the application of the anomaly detection feature can be beneficial.
Prerequisites
- An Ubuntu endpoint with Wazuh agent 4.5.3 installed and enrolled on the Wazuh server. Follow the Deploying Wazuh agents on Linux endpoints guide to configure an Ubuntu endpoint.
- A Kali Linux endpoint to emulate the brute force attack against the SSH service on the Ubuntu endpoint.
Failed logins anomaly
In this use case, we show how to create an anomaly detector on your Wazuh dashboard to detect anomalies from unsuccessful logins. The below steps describe the process of configuring your Wazuh environment for failed login detectors.
Configuration
Complete the four sections stated below to create a new anomaly detector on the Wazuh dashboard.
Define detector
Perform the steps below to define an anomaly detector to detect failed login anomalies from Wazuh alerts.
1. Click on Create detector to configure a new detector.
2. Specify Name failed-logins-anomaly and provide a suitable Description of the new detector under Detector details section.
3. Enter the Index wazuh-alerts-* as the Data Source and apply the rule.groups is not authentication_success as the Data filter.
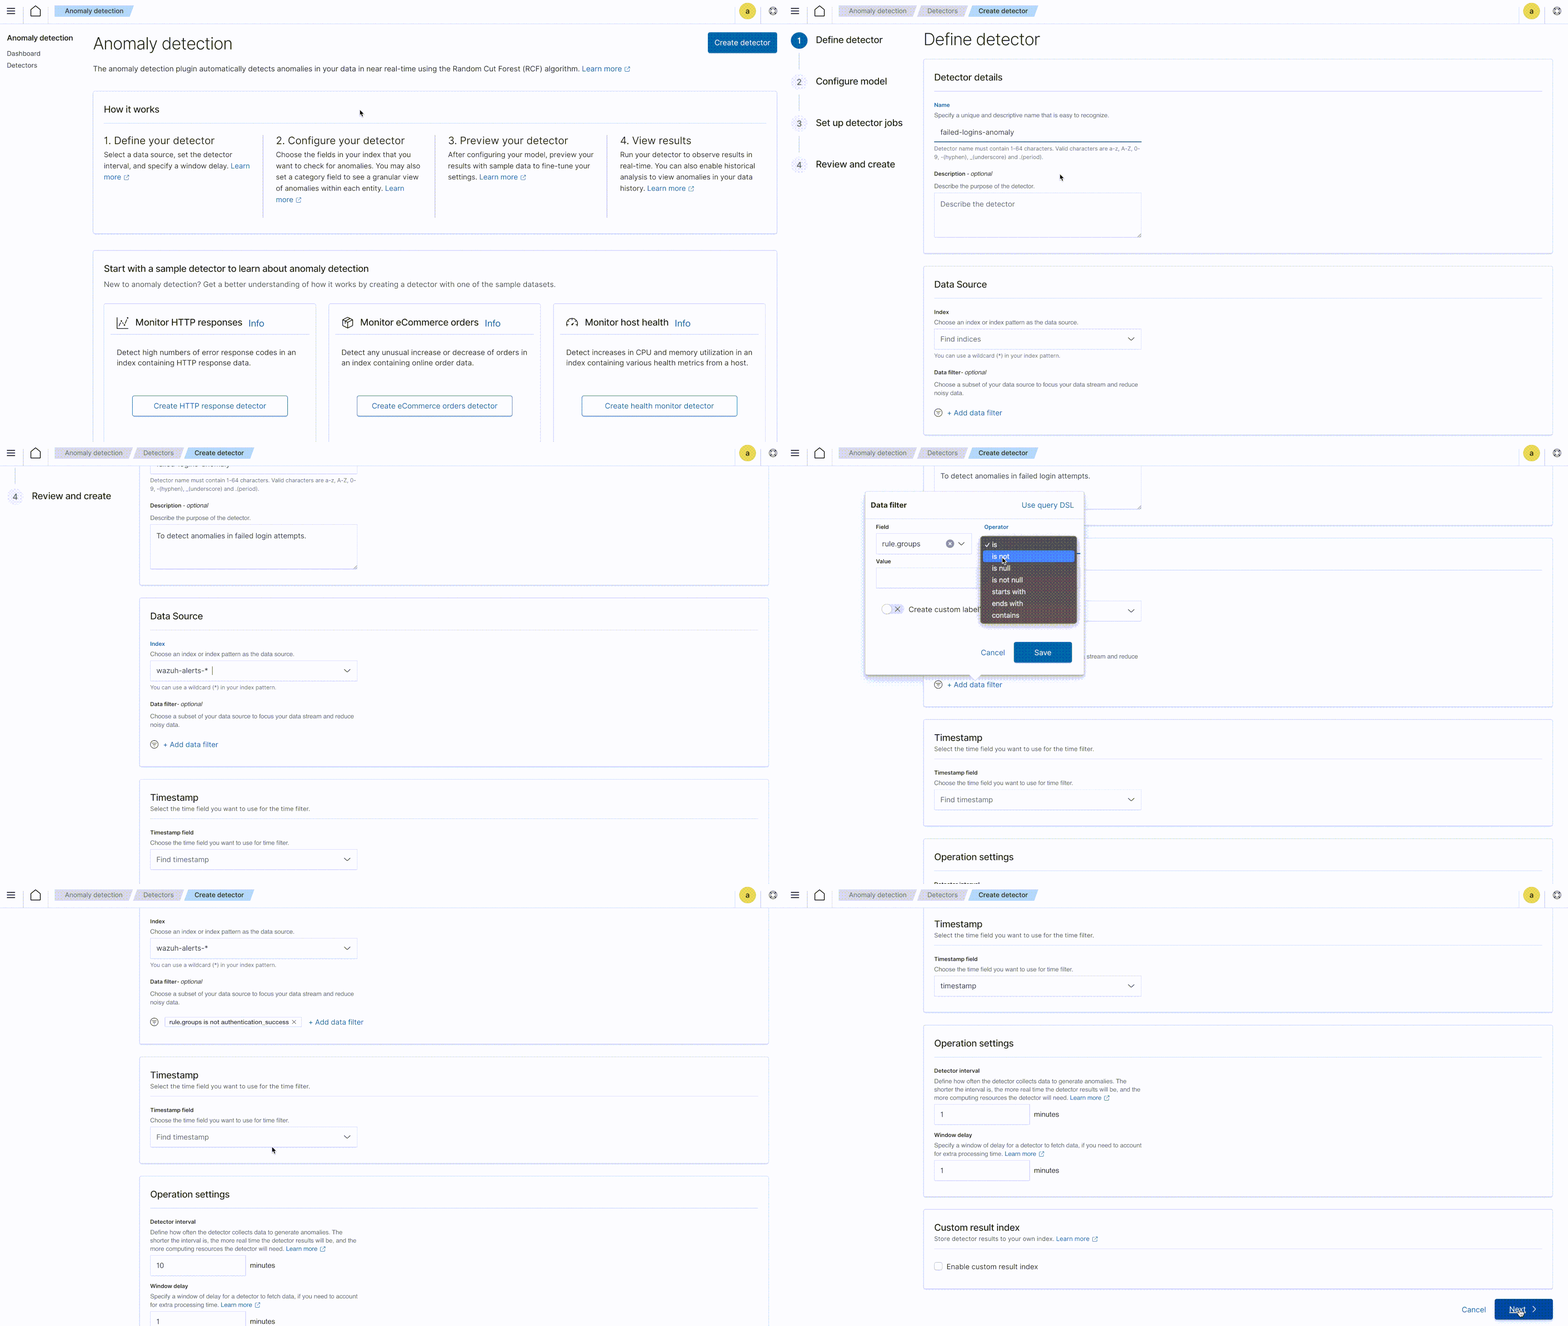
4. Choose the timestamp field as Timestamp field in the Timestamp section.
5. Set the Detector interval and Window delay to 1 minute each for more real-time results.
6. Click Next to proceed with the next section.
Configure model
Perform the steps below to configure two model features for your new detector:
1. Add failed-logins-srcip as the Feature name in the Add feature section.
2. Make sure the Feature state is marked to enable the feature.
3. Select Field value under the Find anomalies based on option.
4. Select count() as Aggregation method.
5. Select data.srcip as an index Field that will be used to check for anomalies.
6. Click Add another feature to add another field to check for anomalies.
7. Add failed-logins-agentip as a Feature name in the Add feature section.
8. Make sure the Feature state is marked to enable the feature.
9. Select Field value under the Find anomalies based on option.
10. Select count() as Aggregation method.
11. Select an agent.ip as an index Field that will be used to check for anomalies.
12. Click Next to proceed with the next section.
Set up detector jobs
Perform the below actions to configure detector jobs for the failed login detector.
1. Ensure that the Start real-time detector automatically (recommended) option is selected for real-time anomaly detection.
2. Click Next to proceed with the next section.
Review and create
If your Wazuh environment has enough pre-populated failed login data, you should be shown Detector settings are validated and Model configurations are validated messages. Otherwise, a warning will prompt you to extend the Detector interval to allow for more data ingestion.
Click Create detector to complete the detector configuration process and initialize the detector.
Attack emulation
We perform a brute force attack against the SSH service on the Ubuntu endpoint to allow the Anomaly Detection plugin to generate anomalies on the Wazuh dashboard.
Perform the steps below on the Kali Linux endpoint.
1. Create a username and password list to use during the brute-forcing attack:
$ sudo apt-get install pwgen -y
$ pwgen 5 40 >> user.txt
$ pwgen 16 40 >> pass.txt
2. Start the brute-forcing process by executing the following command:
$ hydra -L user.txt -p pass.txt <UBUNTU_IP> ssh -t 4
Result
Navigate to the Detectors tab in the Anomaly Detection plugin section on the Wazuh dashboard and select failed-logins-anomaly detector. You can see the following on the failed logins anomaly dashboard:
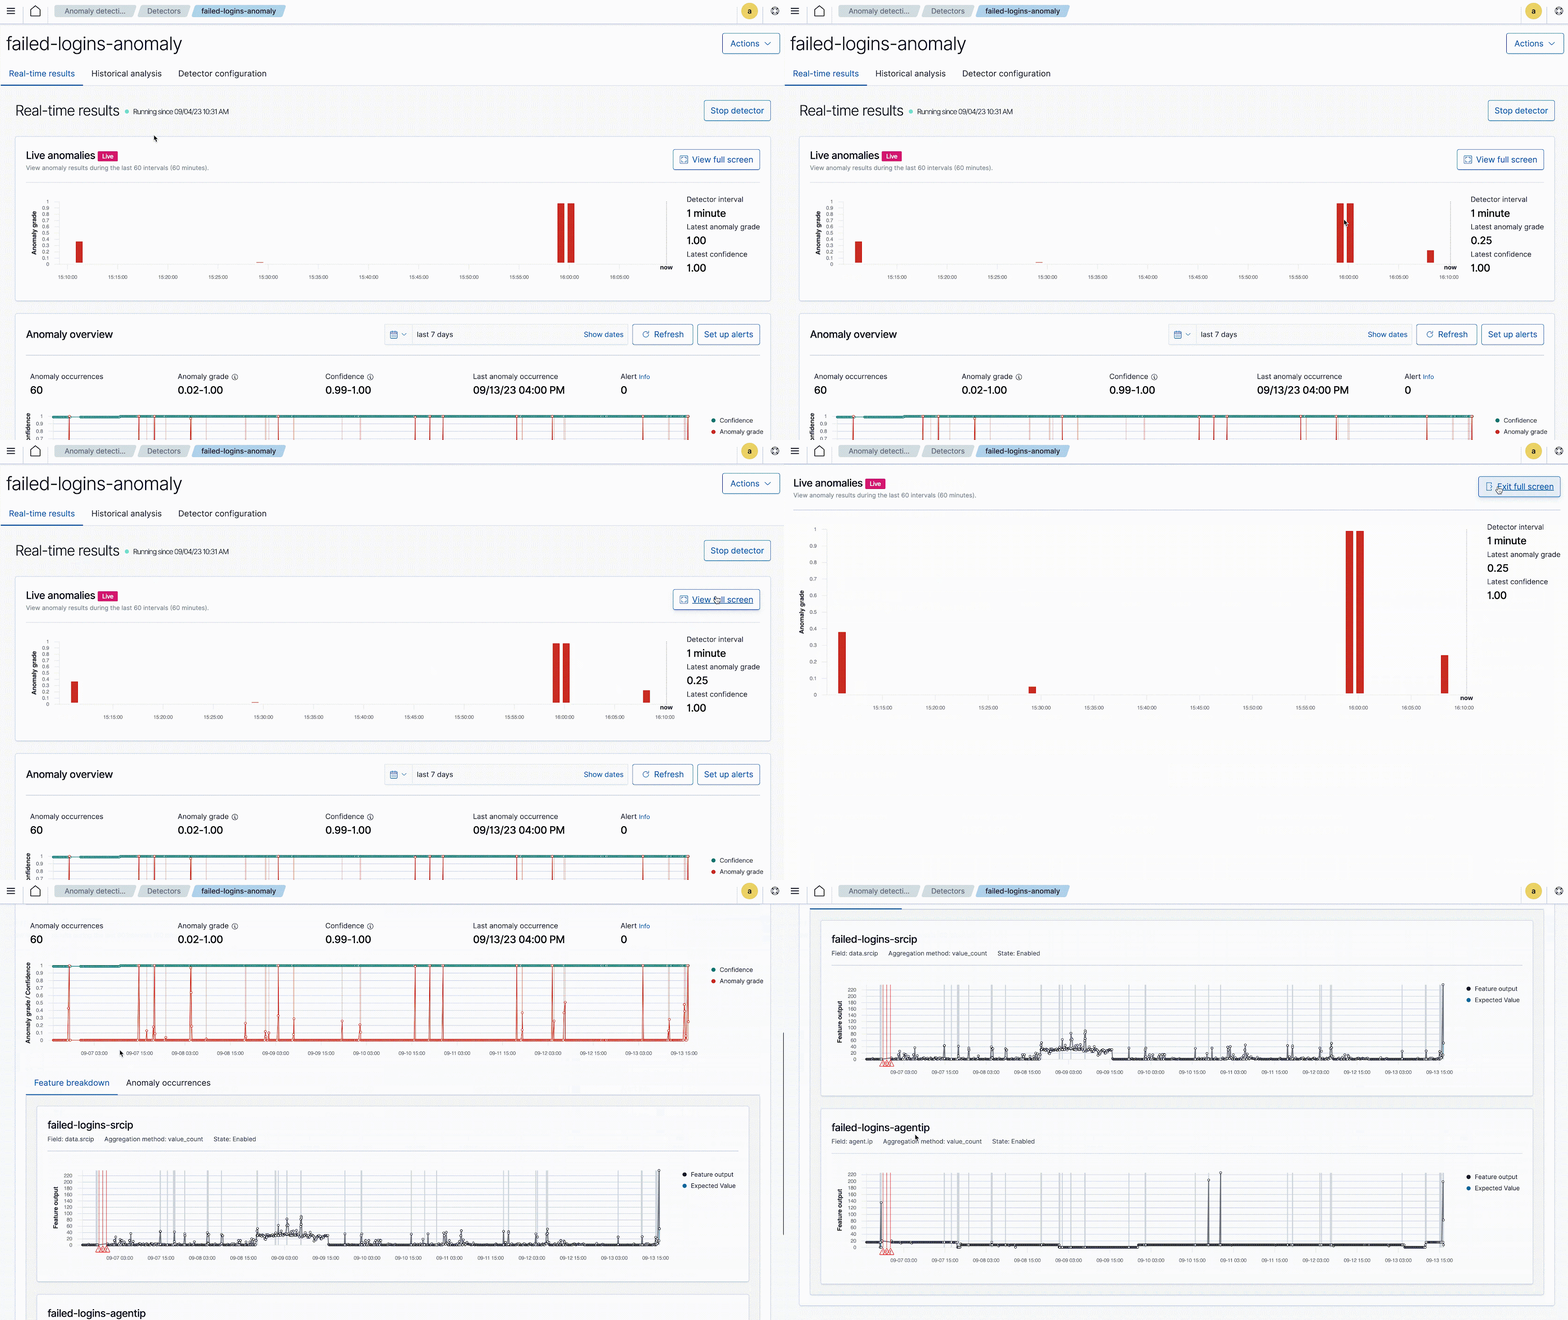
- Live anomalies display anomalies within the last 60 intervals. Since we have configured an interval of 1 minute, we can observe anomalies for the last 60 minutes. You can view the Latest Anomaly Grade and Latest Confidence score (ranges from 0.0 – 1.0) accompanied by other anomalies generated in the previous 60 minutes.

- Anomaly overview provides a holistic view of anomalies for the last 7 days, by default. You can adjust the time frame to meet your needs. The overview includes the total number of anomaly occurrences, the overall Anomaly grade, confidence, date and time of the last anomaly identified by the anomaly detector.

- Under the Feature breakdown, you can see anomalies based on
failed-login-srcipandfailed-login-agentipfeatures, for the last 7 days, by default.
failed-logins-srcip shows the Feature output and the Expected value by looking for the data.srcip field in the Wazuh data, using the value_count as the aggregation method.

failed-logins-agentip shows the Feature output and the Expected value by looking for the data.agentip field in the Wazuh data, using the value_count as the aggregation method.

Note: Feature output is the set of values that the Random Cut Forest (RCF) algorithm produces when it is given a set of Wazuh data. The Expected value is to measure the accuracy of predictions made by the Random Cut Forest (RCF) algorithm. This can be calculated by taking the mean of all the different possible outcomes.
You can further investigate the anomalies identified above by navigating to the Security events tab from the Wazuh dashboard.
Linux resource utilization anomaly
This use case shows how to create an anomaly detector to detect anomalies in CPU and memory usage on a Linux endpoint. Follow this Monitoring Linux resource usage with Wazuh guide up to including Creating custom visualization section to configure the Ubuntu endpoint to forward resource usage information to the Wazuh server. However, you can implement the entire blog to make use of the custom dashboards.
Perform the activities below to configure an anomaly detector with the Ubuntu resource usage information.
Configuration
Complete the four sections stated below to create a new anomaly detector on the Wazuh dashboard.
Define detector
Perform the steps below to define an anomaly detector to detect Linux resource utilization anomalies from Wazuh alerts.
1. Click on Create detector to configure a new detector.
2. Specify Name linux-resource-utilization-anomaly and provide a suitable Description of the new detector under Detector details section.
3. Type the Index wazuh-alerts-* as the Data Source.

4. Choose the timestamp field as Timestamp field in the Timestamp section.
5. Set Detector interval and Window delay 1 minute each for more real-time results.
6. Click Next to proceed with the next section.
Configure model
Perform the steps below to configure four model features for your new detector:
1. Add cpu-usage-avg as the Feature name in the Add feature section.
2. Make sure the Feature state is marked to enable the feature.
3. Select Field value under the Find anomalies based on option.
4. Select average() as the Aggregation method.
5. Select data.cpu_usage_% as the index Field that will be used to check for anomalies.
6. Click Add another feature to add another field to check for anomalies.
7. Add cpu_usage_max as the Feature name in the Add feature section.
8. Make sure the Feature state is marked to enable the feature.
9. Select Field value under the Find anomalies based on option.
10. Select max() as the Aggregation method.
11. Select data.cpu_usage_% as the index Field that will be used to check for anomalies.
12. Click Add another feature to add another field to check for anomalies.
13. Add memory_usage_avg as the Feature name in the Add feature section.
14. Make sure the Feature state is marked to enable the feature.
15. Select Field value under the Find anomalies based on option.
16. Select average() as the Aggregation method.
17. Select data.memory_usage_% as the index Field that will be used to check for anomalies.
18. Click Add another feature to add another field to check for anomalies.
19. Add memory_usage_max as the Feature name in the Add feature section.
20. Make sure the Feature state is marked to enable the feature.
21. Select Field value under the Find anomalies based on option.
22. Select max() as the Aggregation method.
23. Select data.memory_usage_% as the index Field that will be used to check for anomalies.
24. Click Next to proceed with the next section.
Set up detector jobs
Perform the below actions to configure detector jobs for failed login detectors.
1. Ensure that the Start real-time detector automatically (recommended) option is selected for real-time anomaly detection.
2. Click Next to proceed with the next section.
Review and create
If your Wazuh environment has enough pre-populated Linux resource utilization data, you should be shown Detector settings are validated and Model configurations are validated messages. Otherwise, a warning will prompt you to extend the Detector interval to allow for more data ingestion.
Click Create detector to complete the detector configuration process and initialize the detector.
Attack emulation
Perform the actions below to stress test the monitored Ubuntu endpoint. This allows the Anomaly Detection plugin to generate anomalies on the Wazuh dashboard.
1. Run the below command to install the stress testing tool:
$ sudo apt-get install stress -y
2. Spawn four workers to stress test the CPU, and four workers to stress test the memory with each worker, allocating 512M bytes and timeout after 160 seconds:
$ stress -c 4 -m 4 --vm-bytes 512M -t 160
Result
Navigate to Detectors in the Anomaly Detection plugin section on your Wazuh dashboard and select the linux-resource-utilization-anomaly detector. You can see the following on the Linux resource utilization anomaly dashboard:
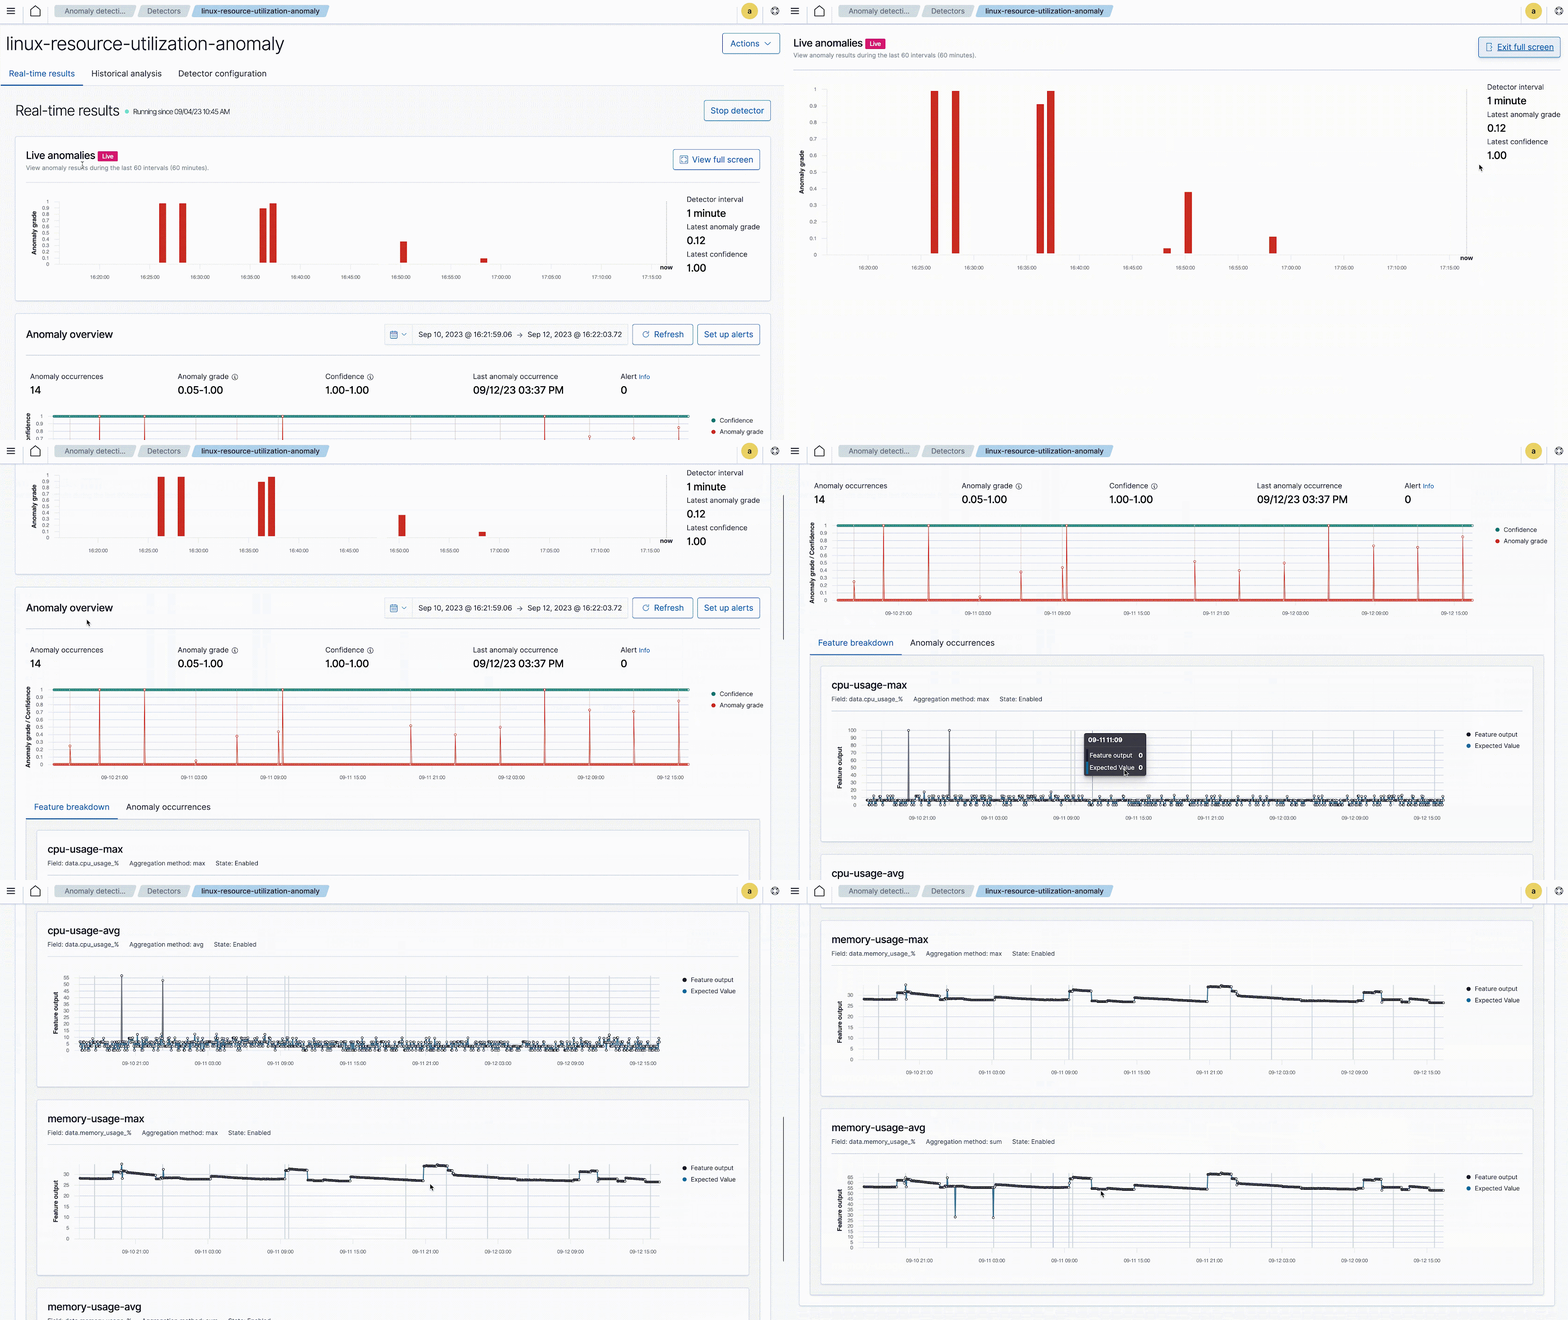
- Live anomalies display anomalies within the last 60 intervals. Since we have configured an interval of 1 minute, we can observe anomalies for the last 60 minutes. You can view the
Latest Anomaly GradeandLatest Confidencescore (ranges from 0.0 – 1.0) accompanied by other anomalies generated in the previous 60 minutes.

- Anomaly overview provides a holistic view of anomalies for the last 7 days, by default. You can adjust the time frame to meet your needs. The overview includes the total number of anomaly occurrences, the overall Anomaly grade, confidence, date and time of the last anomaly identified by the anomaly detector.

- Under the Feature breakdown, you can see anomalies based on
cpu-usage-avg,cpu-usage-max,memory-usage-avg, andmemory-usage-maxfeatures, for the last 7 days, by default.
cpu-usage-avg shows the Feature output and the Expected value by looking for the data.cpu_usage_% field in the Wazuh data, using the avg as the aggregation method.

cpu-usage-max shows the Feature output and the Expected value by looking for the data.cpu_usage_% field in the Wazuh data, using the max as the aggregation method.

memory-usage-avg shows the Feature output and the Expected value by looking for the data.memory_usage_% field in the Wazuh data, using the avg as the aggregation method.

memory-usage-max shows the Feature output and the Expected value by looking for the data.memory_usage_% field in the Wazuh data, using the max as the aggregation method.

Note: Feature output is the set of values that the Random Cut Forest (RCF) algorithm produces when it is given a set of Wazuh data. The Expected value is to measure the accuracy of predictions made by the Random Cut Forest (RCF) algorithm. This can be calculated by taking the mean of all the different possible outcomes.
You can further investigate the anomalies identified above by navigating to the Security events tab from the Wazuh dashboard.
Conclusion
In summary, this blog post provides guidance on how to detect anomalous behaviors in an IT environment using Wazuh and the OpenSearch Anomaly Detection plugin. To accomplish this, we illustrate the configuration of anomaly detectors and show their effectiveness across various scenarios.
Wazuh is an open source security monitoring platform that provides a unified security management approach across various IT assets. It provides capabilities such as security analytics, intrusion detection, file integrity monitoring, vulnerability detection, incident response, and more. To learn more about Wazuh, please check out our other blog posts and official guides.
Reference
