Monitoring macOS resources provides a comprehensive overview of the state of macOS resource usage. By doing this, organizations gain insights into the use of endpoint resources within their infrastructure. Monitoring macOS resources allows organizations to tackle potential performance issues and optimize resource utilization. Wazuh, an open source XDR, provides users with the ability to monitor and manage computer system security and performance effectively.
This blog post describes monitoring macOS resources using Wazuh.
macOS performance metrics
You can collect performance metrics on macOS endpoints by using various tools. This information offers an understanding of the use of endpoint resources. Wazuh can gather, categorize, examine, and present metric data from macOS endpoints.
It is important to focus on certain performance metrics when monitoring macOS endpoints. These performance metrics are:
1. CPU usage: This is the percentage of the CPU’s capacity used in processing non-idle tasks. macOS categorizes CPU usage into three main categories, namely; user, sys(system), and idle. This distinguishes the usage by the user, the system, and the amount of unused CPU capacity.
You can obtain the CPU usage of a macOS endpoint with the top utility, as shown below:
% top -l 1 | grep 'CPU usage'
CPU usage: 23.33% user, 75.0% sys, 1.66% idle
The following computation shows how to calculate the total CPU available:
Total CPU (%) = user + sys + idle
The following computation shows how to calculate the total CPU usage in percentage:
Total CPU usage (%) = ((user + sys) * 100) / Total CPU
2. CPU load: This measures the number of programs that are either utilizing or waiting for a processor core. This represents the level of demand placed on the CPU by running processes within a given time.
You can check the CPU load average with the top or uptime utility, as shown below:
% top -l 1 | grep 'Load Avg'
Load Avg: 1.84, 1.75, 1.80
Where:
- The CPU load in the last one (1) minute is 1.84.
- The CPU load in the last five (5) minutes is 1.75.
- The CPU load in the last fifteen (15) minutes is 1.80.
3. Memory utilization: This is the percentage of available computer memory currently utilized by the system or running programs. This metric allows users to identify overused and underused servers and optimize memory allocation for improved performance.
You can check the memory utilization with the top utility, as shown below:
% top -l 1 | grep PhysMem
PhysMem: 3027M used (588M wired, 13M compressor), 1068M unused.
Where:
MemUsed = app memory + wired memory + compressed
The following computation shows how to calculate the percentage of memory in use on an endpoint:
Memory utilization (%) = (MemUsed * 100) / (MemUsed + MemUnused)
4. Disk usage: This is the percentage of disk space currently occupied. It serves as a metric that allows users to avoid potential data loss, endpoint slowdowns, and disk failures.
To check the disk usage of the file system mounted at the root (/) directory, we use the df utility as shown below:
% df -h /
Filesystem       Size   Used  Avail Capacity iused     ifree %iused  Mounted on
/dev/disk1s5s1   80Gi  8.4Gi   63Gi    12%  355384 664864760    0%   /
The following computation shows how to calculate the amount of disk space usable:
Total usable (Gi) = DiskUsed + DiskAvailable
The following computation shows how to calculate the percentage of disk in use:
Disk usage (%) = (DiskUsed * 100) / Total usable
5. Network utilization: This measures the amount of network bandwidth being used at a given time, indicating the level of network traffic or activity on an endpoint. This serves as a metric for determining high bandwidth usage within a network.
To get the network utilization, we use the top utility as shown below:
% top -l 1 | grep Networks
Networks: packets: 13108/2660K in, 12579/2722K out.
Where:
- Incoming network traffic is
13108 packetsat a rate of2660 kilobytesof data received. - Outgoing network traffic is
12579 packetsat a rate of2722 kilobytesof data sent.
By monitoring the utilization of resources defined above, valuable insights are gained into the health status of endpoints. This enables the early detection of anomalous behaviors that may signify security risks/threats. This will assist security teams in taking proactive measures.
Monitoring macOS resources
Requirement
To demonstrate Wazuh capabilities for monitoring macOS resources, we set up the following infrastructure:
- A single node Wazuh cluster (version 4.4.4) on an Ubuntu endpoint. Follow this guide to use the Wazuh installation assistant. This endpoint hosts the Wazuh central components (Wazuh server, Wazuh indexer, and Wazuh dashboard).
- A macOS endpoint (version 13.4) with Wazuh agent 4.4.4 installed and enrolled to the Wazuh server. A Wazuh agent can be installed by following the deploying Wazuh agents on macOS endpoints guide.
Configuration
We make use of the Wazuh command monitoring capability to query and monitor the performance metrics of the endpoint. The Wazuh command monitoring capability enables you to run specific commands on monitored endpoints. This capability enables you to gather significant information or carry out specific tasks. The output from these commands are logged as data that can be analyzed to detect potential security risks and gain valuable insight into your infrastructure.
In this blog post, we configure the command monitoring module to periodically execute commands to query system resources.
macOS Endpoint
Take the following steps to configure the Wazuh command monitoring module.
1. Edit the Wazuh agent /Library/Ossec/etc/ossec.conf file and add the following command monitoring configuration within the <ossec_config> block. These commands are set to run every 30 seconds.
<!-- CPU usage: percentage -->
  <localfile>
    <log_format>full_command</log_format>
    <command>top -l 1 | grep 'CPU usage' | awk '{print ($3+$5)*100/($3+$5+$7)}'</command>
    <alias>CPU_health</alias>
    <out_format>$(timestamp) $(hostname) CPU_health: $(log)</out_format>
    <frequency>30</frequency>
  </localfile>

<!-- memory usage: percentage -->
  <localfile>
    <log_format>full_command</log_format>
    <command>top -l 1 | grep PhysMem | awk '$NF=="unused."{print ($2*100)/($2+$(NF-1))}'</command>
    <alias>memory_health</alias>
    <out_format>$(timestamp) $(hostname) memory_health: $(log)</out_format>
    <frequency>30</frequency>
  </localfile>

<!-- disk usage: percentage -->
  <localfile>
    <log_format>full_command</log_format>
    <command>df -h | awk '$NF=="/"{print $3*100/($3+$4)}'</command>
    <alias>disk_health</alias>
    <out_format>$(timestamp) $(hostname) disk_health: $(log)</out_format>
    <frequency>30</frequency>
  </localfile>

<!-- CPU usage metrics -->
  <localfile>
    <log_format>full_command</log_format>
    <command>top -l 1 | grep 'CPU usage' | awk '{print $3, $5, ($3+$5)*100/($3+$5+$7)"%", $7}'</command>
    <alias>cpu_metrics</alias>
    <out_format>$(timestamp) $(hostname) cpu_usage_check: $(log)</out_format>
    <frequency>30</frequency>
  </localfile>

<!-- load average metrics -->
  <localfile>
    <log_format>full_command</log_format>
    <command>top -l 1 | grep 'Load Avg' | awk '{print $3, $4, $5}'</command>
    <alias>load_average_metrics</alias>
    <out_format>$(timestamp) $(hostname) load_average_check: $(log)</out_format>
    <frequency>30</frequency>
  </localfile>

<!-- memory metrics -->
  <localfile>
     <log_format>full_command</log_format>
     <command>top -l 1 | grep PhysMem | awk '$NF=="unused."{print $2,$(NF-1)}'</command>
     <alias>memory_metrics</alias>
     <out_format>$(timestamp) $(hostname) memory_check: $(log)</out_format>
     <frequency>30</frequency>
  </localfile>

<!-- disk metrics -->
  <localfile>
    <log_format>full_command</log_format>
    <command>df -h | awk '$NF=="/"{print $2,$3,$4,$3+$4"Gi"}'</command>
    <alias>disk_metrics</alias>
    <out_format>$(timestamp) $(hostname) disk_check: $(log)</out_format>
    <frequency>30</frequency>
  </localfile>

<!-- network metrics -->
  <localfile>
    <log_format>full_command</log_format>
    <command>top -l 1 | grep Networks | awk '$NF=="out."{print $3,$5}'</command>
    <alias>network_metrics</alias>
    <out_format>$(timestamp) $(hostname) network_check: $(log)</out_format>
    <frequency>30</frequency>
  </localfile>
Note: You can use the centralized configuration to distribute this setting across multiple monitored endpoints. However, remote commands are disabled by default for security reasons and have to be explicitly enabled on each agent.
2. Restart the Wazuh agent to apply this change:
% sudo /Library/Ossec/bin/wazuh-control restart
Wazuh server
1. Add the following decoders to the /var/ossec/etc/decoders/local_decoder.xml file to decode the generated logs from the monitored endpoint:
<!-- CPU health check -->
<decoder name="CPU_health">
    <program_name>CPU_health</program_name>
</decoder>

<decoder name="CPU_health_sub">
  <parent>CPU_health</parent>
  <prematch>ossec: output: 'CPU_health':\.</prematch>
  <regex offset="after_prematch">(\S+)</regex>
  <order>cpu_usage_%</order>
</decoder>

<!-- Memory health check -->
<decoder name="memory_health">
    <program_name>memory_health</program_name>
</decoder>

<decoder name="memory_health_sub">
  <parent>memory_health</parent>
  <prematch>ossec: output: 'memory_health':\.</prematch>
  <regex offset="after_prematch">(\S+)</regex>
  <order>memory_usage_%</order>
</decoder>

<!-- Memory health check -->
<decoder name="disk_health">
    <program_name>disk_health</program_name>
</decoder>

<decoder name="disk_health_sub">
  <parent>disk_health</parent>
  <prematch>ossec: output: 'disk_health':\.</prematch>
  <regex offset="after_prematch">(\S+)</regex>
  <order>disk_usage_%</order>
</decoder>

<!-- CPU usage metrics -->
<decoder name="cpu_usage_check">
    <program_name>cpu_usage_check</program_name>
</decoder>

<decoder name="cpu_usage_check_sub">
  <parent>cpu_usage_check</parent>
  <prematch>ossec: output: 'cpu_metrics':\.</prematch>
  <regex offset="after_prematch">(\S+%) (\S+%) (\S+) (\S+%)</regex>
  <order>userCPU_usage_%, sysCPU_usage_%, totalCPU_used_%, idleCPU_%</order>
</decoder>

<!-- Load average metrics -->
<decoder name="load_average_check">
    <program_name>load_average_check</program_name>
</decoder>

<decoder name="load_average_check_sub">
  <parent>load_average_check</parent>
  <prematch>ossec: output: 'load_average_metrics':\.</prematch>
  <regex offset="after_prematch">(\S+), (\S+), (\S+)</regex>
  <order>1min_loadAverage, 5mins_loadAverage, 15mins_loadAverage</order>
</decoder>

<!-- Memory metrics -->
<decoder name="memory_check">
    <program_name>memory_check</program_name>
</decoder>

<decoder name="memory_check_sub">
  <parent>memory_check</parent>
  <prematch>ossec: output: 'memory_metrics':\.</prematch>
  <regex offset="after_prematch">(\S+) (\S+)</regex>
  <order>memory_used_bytes, memory_available_bytes</order>
</decoder>

<!-- Disk metrics -->
<decoder name="disk_check">
    <program_name>disk_check</program_name>
</decoder>

<decoder name="disk_check_sub">
  <parent>disk_check</parent>
  <prematch>ossec: output: 'disk_metrics':\.</prematch>
  <regex offset="after_prematch">(\S+) (\S+) (\S+) (\S+)</regex>
  <order>total_disk_size, disk_used, disk_free, total_usable</order>
</decoder>

<!-- Network metrics -->
<decoder name="network_check">
    <program_name>network_check</program_name>
</decoder>

<decoder name="network_check_sub">
  <parent>network_check</parent>
  <prematch>ossec: output: 'network_metrics':\.</prematch>
  <regex offset="after_prematch">(\S+) (\S+)</regex>
  <order>network_in, network_out</order>
</decoder>
2. Add the rules below to the custom rules file /var/ossec/etc/rules/local_rules.xml on the Wazuh server:
<group name="performance_metric,">

<!-- High memory usage -->
<rule id="100101" level="12">
  <decoded_as>memory_health</decoded_as>
  <field type="pcre2" name="memory_usage_%">^(0*[8-9]\d|0*[1-9]\d{2,})</field>
  <description>Memory usage is high: $(memory_usage_%)%</description>
  <options>no_full_log</options>
</rule>

<!-- High CPU usage -->
<rule id="100102" level="12">
  <decoded_as>CPU_health</decoded_as>
  <field type="pcre2" name="cpu_usage_%">^(0*[8-9]\d|0*[1-9]\d{2,})</field>
  <description>CPU usage is high: $(cpu_usage_%)%</description>
  <options>no_full_log</options>
</rule>

<!-- High disk usage -->
<rule id="100103" level="12">
  <decoded_as>disk_health</decoded_as>
  <field type="pcre2" name="disk_usage_%">^(0*[7-9]\d|0*[1-9]\d{2,})</field>
  <description>Disk space is running low: $(disk_usage_%)%</description>
  <options>no_full_log</options>
</rule>

<!-- CPU usage check -->
<rule id="100104" level="3">
  <decoded_as>cpu_usage_check</decoded_as>
  <description>CPU usage metrics: $(totalCPU_used_%) of CPU is in use</description>
</rule>

<!-- Load average check -->
<rule id="100105" level="3">
  <decoded_as>load_average_check</decoded_as>
  <description>Load average metrics: $(1min_loadAverage) for last 1 minute</description>
</rule>

<!-- Memory check -->
<rule id="100106" level="3">
  <decoded_as>memory_check</decoded_as>
  <description>Memory metrics: $(memory_used_bytes) of memory is in use</description>
</rule>

<!-- Disk check -->
<rule id="100107" level="3">
  <decoded_as>disk_check</decoded_as>
  <description>Disk metrics: $(disk_used) of storage is in use</description>
</rule>

<!-- Network check -->
<rule id="100108" level="3">
  <decoded_as>network_check</decoded_as>
  <description>Network metrics: $(network_in) inbound | $(network_out) outbound</description>
</rule>

</group>
Where:
- Rule ID
100101is triggered when the memory utilized exceeds 80%. - Rule ID
100102is triggered when the CPU utilized exceeds 80%. - Rule ID
100103is triggered when the disk space used exceeds 70%. - Rule ID
100104is triggered when a CPU usage check is done. - Rule ID
100105is triggered when a CPU load average check is done. - Rule ID
100106is triggered when a memory metric check is done. - Rule ID
100107is triggered when a disk metrics check is done. - Rule ID
100108is triggered when a network metrics check is done.
- Restart the Wazuh manager to apply these changes:
$ sudo systemctl restart wazuh-manager
Wazuh dashboard
After adding the rules and restarting the Wazuh manager service, alerts get displayed on the Wazuh dashboard when the scans are completed on the monitored macOS endpoint.
Newly added custom fields will be displayed for the respective performance metrics:
- CPU usage:
data.cpu_usage_%,data.idleCPU_%,data.sysCPU_usage_%,data.totalCPU_used_%,data.userCPU_usage_%. - CPU load:
data.1min_loadAverage,data.5min_loadAverage,data.15mins_loadAverage. - Memory utilization:
data.memory_usage_%,data.memory_used_bytes,data.memory_available_bytes. - Disk usage:
data.disk_usage_%,data.disk_free,data.disk_used,data.total_disk_size,data.total_usable. - Network utilization:
data.network_in,data.network_out.

Figure 1: New custom fields.
The newly added custom fields may be displayed as an unknown field if the index pattern is not refreshed on the Wazuh dashboard. This is because the Wazuh dashboard may not recognize the new fields. You will get a prompt on the Wazuh dashboard to refresh the index pattern to include the new fields.
If you do not get the prompt, take the following steps to refresh the index pattern:
1. Refresh the index pattern by selecting the menu icon in the top left corner and navigating to Management -> Stack Management -> Index patterns -> wazuh-alerts-*. Click the refresh button on the Index patterns page, as shown below.
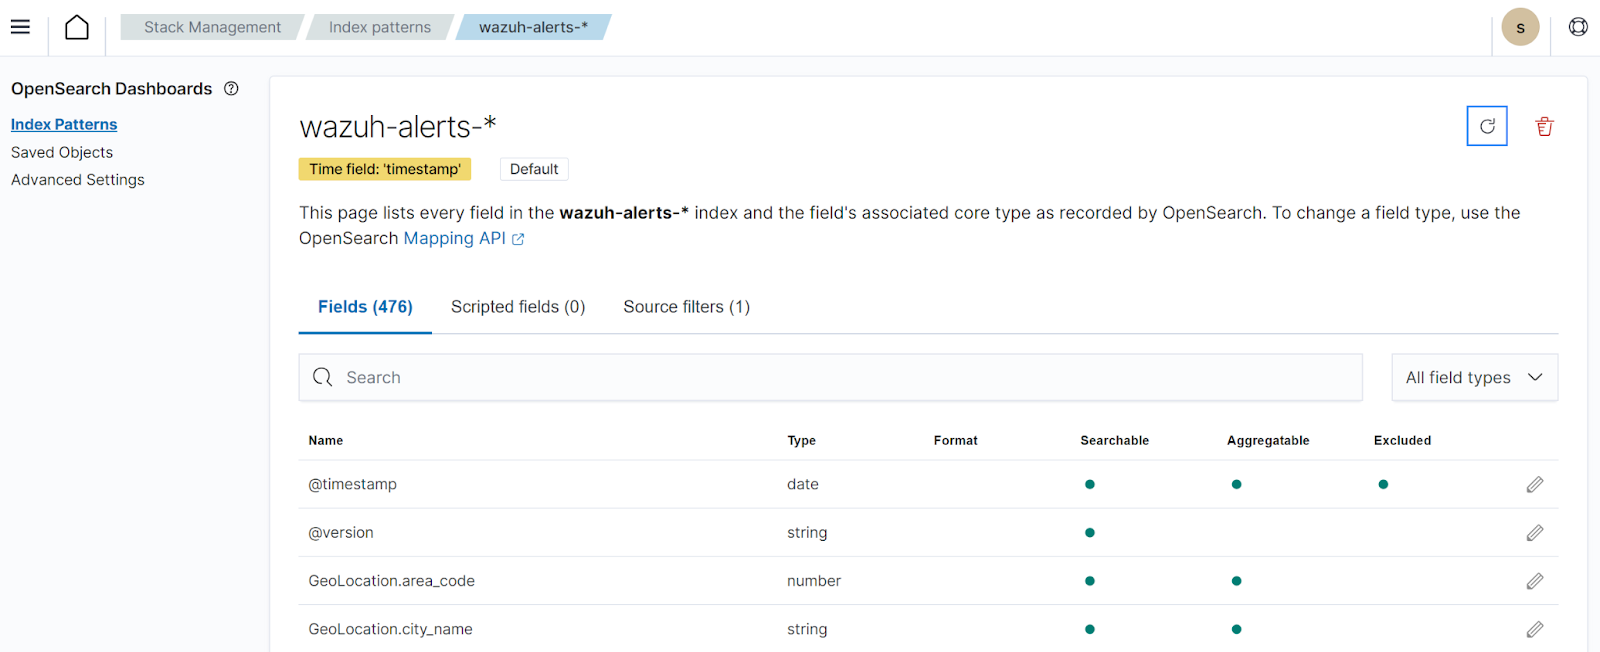
Figure 2: Refresh index pattern.
2. Navigate to Security events and confirm that the custom field is no longer identified as an unknown field.

Figure 3: Recognized custom fields.
Event queries
You can query alerts from the Wazuh dashboard using the filter rule.id and selecting the desired rule.
CPU usage
1. Enter the filter rule.id:100104 on the search pane to create a custom CPU usage query.
2. Select the data.userCPU_usage_%, data.sysCPU_usage_%, data.totalCPU_used_%, and data.idleCPU_% fields from the available fields to add them to selected fields. The selected fields will then appear on the Events tab of the Wazuh dashboard with values, as shown in the image below.
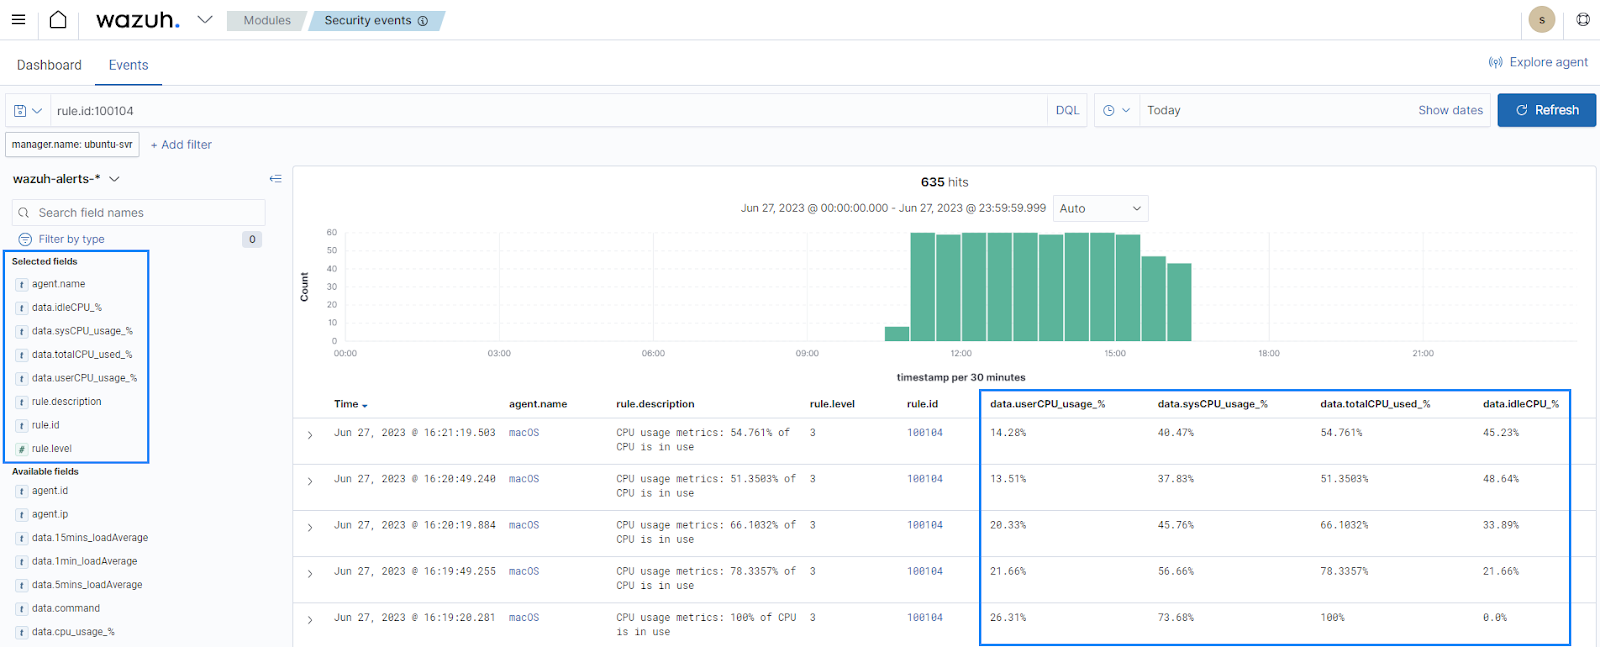
Figure 4: CPU usage events.
CPU load
1. Enter the filter rule.id:100105 on the search pane to create a custom CPU load query.
2. Select the data.1min_loadAverage, data.5min_loadAverage, and data.15mins_loadAverage fields from the available fields to add them to selected fields. The selected fields will then appear on the Events tab of the Wazuh dashboard with values, as shown in the image below.
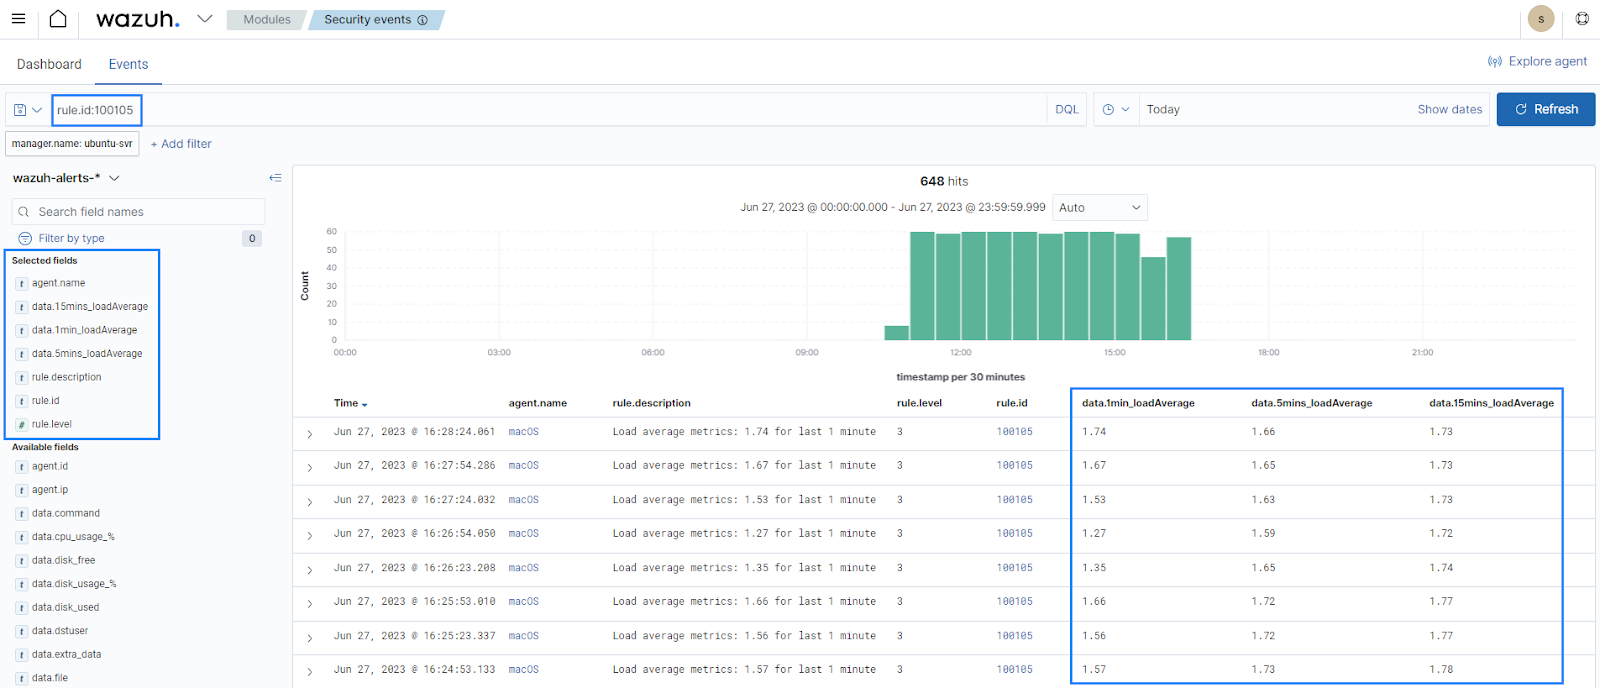
Figure 5: CPU load events.
Memory utilization
1. Enter the filter rule.id:100106 on the search pane to create a custom memory utilization query.
2. Select the data.memory_used_bytes and data.memory_available_bytes fields from the available fields to add them to selected fields. The selected fields will appear on the Events tab of the Wazuh dashboard with values, as shown in the image below.
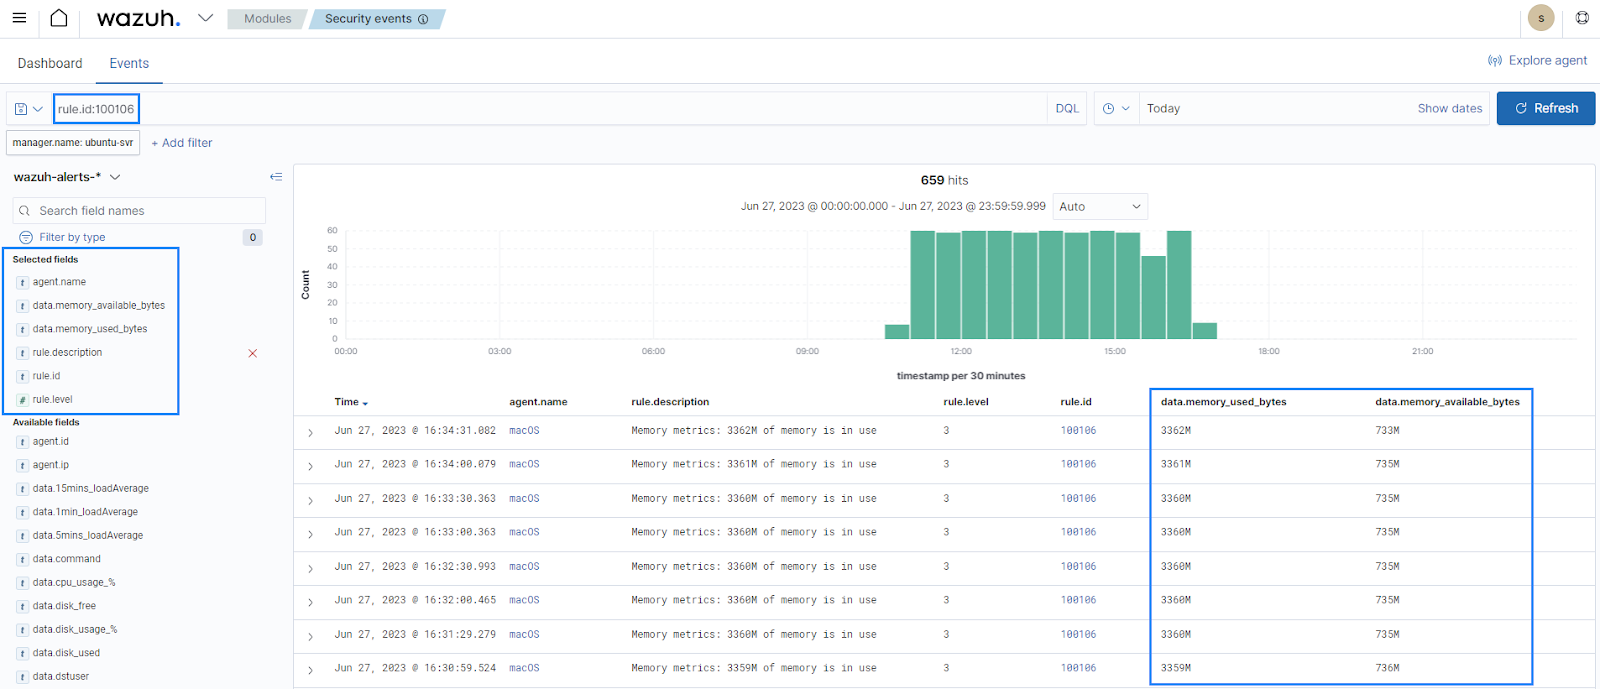
Figure 6: Memory utilization events.
Disk usage
1. Enter the filter rule.id:100107 on the search pane to create a custom disk usage query.
2. Select the data.disk_used, data.disk_free, data.total_usable, and data.total_disk_size fields from the available fields to add them to selected fields. The selected fields will appear on the Events tab of the Wazuh dashboard with values, as shown in the image below.
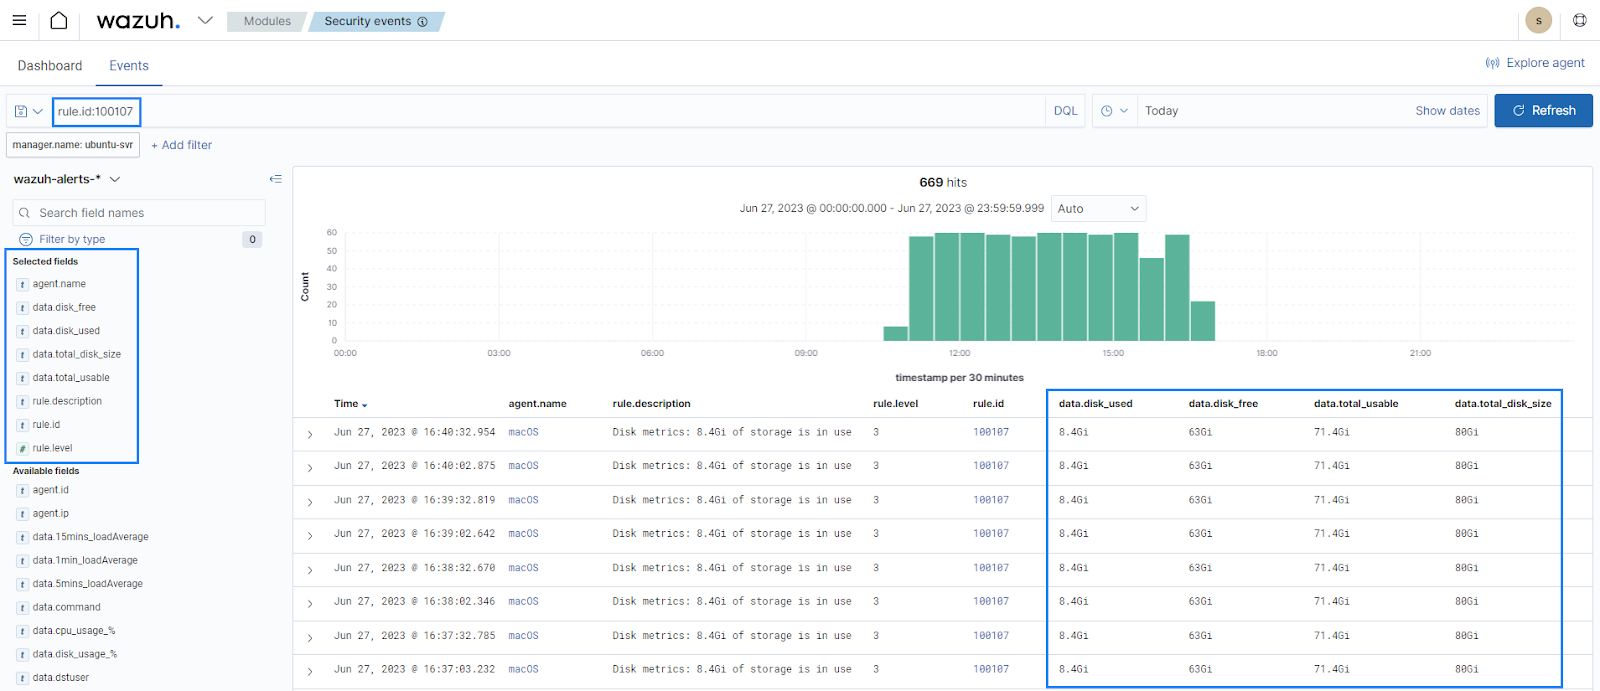
Figure 7: Disk usage events.
Network utilization
1. Enter the filter rule.id:100108 on the search pane to create a custom network utilization query.
2. Select the data.network_in and data.network_out fields from the available fields to add them to selected fields. The selected fields will then appear on the Events tab of the Wazuh dashboard with values, as shown in the image below.
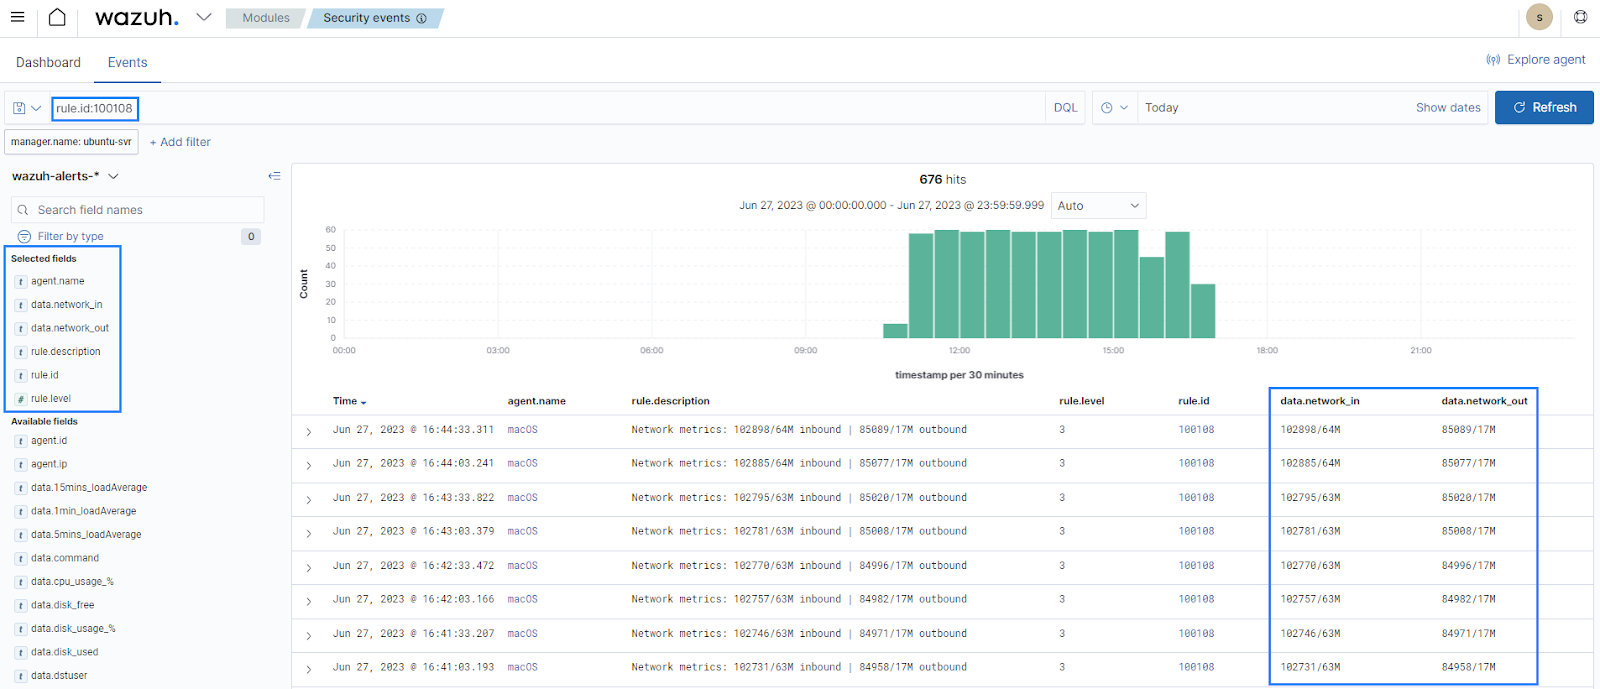
Figure 8: Network utilization events.
Conclusion
Monitoring system resources is essential for maintaining optimal application and system performance. Abnormal usage of system resources could be an indicator of ongoing malicious activity on an endpoint.
In this guide, we demonstrate how to use Wazuh, an open source XDR, to monitor macOS resources like CPU, memory, disk usage, and network. These metrics help you identify performance issues early and improve your overall security posture.
References
- Monitoring Linux resource usage with Wazuh
- Monitoring Windows resources with Performance Counters
- View memory usage in Activity Monitor on Mac
If you have any questions or require assistance regarding this setup, join our Slack community channel!
