
Windows Performance Counter provides an in-depth and consistent interface for collecting different types of system data such as processor, memory, and disk usage statistics. Performance counters can be used to monitor system resources and performance. Windows performance counter data can be viewed in real time with the perfmon utility or alternatively, through the Powershell cmdlet called Get-Counter. The Get-Counter cmdlet gets performance counter data directly from the performance monitoring instrumentation on Windows endpoints. We will focus this blog post on the use of the Get-Counter cmdlet to obtain metrics from a Windows endpoint.
This blog post describes how to use Wazuh to monitor Windows system resources like CPU, RAM, disk, and network traffic. Observing resource usage contributes to the overall security monitoring of endpoints. This is because anomalies in the performance of system resources can be an indicator of ongoing attacks.
List of available counters
Counters are used to inspect the usage of Windows system resources. With the use of the Get-Counter cmdlet in a Powershell console, we can list all available counters:
Get-Counter -ListSet *
This will list a lot of counters, and the information is usually truncated because of its size.
To use this cmdlet, it is recommended to get a list of available counters for a counter set:
(Get-Counter -ListSet * | where {$_.CounterSetName -eq '<CounterSetName>'}).Paths
To list the counter in a counter set, use the CounterSetName variable:
Get-Counter -ListSet * | Select <CounterSetName>
For example, if we need to query the available counters for the Memory counter set, we can run this command:
(Get-Counter -ListSet * | where {$_.CounterSetName -eq 'Memory'}).Paths
We will get a list of counter paths like this:
\Memory\Page Faults/sec
\Memory\Available Bytes
\Memory\Committed Bytes
\Memory\Commit Limit
\Memory\Write Copies/sec
\Memory\Transition Faults/sec
\Memory\Cache Faults/sec
\Memory\Demand Zero Faults/sec
\Memory\Pages/sec
\Memory\Pages Input/sec
\Memory\Page Reads/sec
\Memory\Pages Output/sec
\Memory\Pool Paged Bytes
\Memory\Pool Nonpaged Bytes
\Memory\Page Writes/sec
\Memory\Pool Paged Allocs
\Memory\Pool Nonpaged Allocs
\Memory\Free System Page Table Entries
\Memory\Cache Bytes
\Memory\Cache Bytes Peak
\Memory\Pool Paged Resident Bytes
\Memory\System Code Total Bytes
\Memory\System Code Resident Bytes
\Memory\System Driver Total Bytes
\Memory\System Driver Resident Bytes
\Memory\System Cache Resident Bytes
\Memory\% Committed Bytes In Use
\Memory\Available KBytes
\Memory\Available MBytes
\Memory\Transition Pages RePurposed/sec
\Memory\Free & Zero Page List Bytes
\Memory\Modified Page List Bytes
\Memory\Standby Cache Reserve Bytes
\Memory\Standby Cache Normal Priority Bytes
\Memory\Standby Cache Core Bytes
\Memory\Long-Term Average Standby Cache Lifetime (s)
These counter paths can be used to get the desired metrics.
Getting metrics with Powershell
Once we know which counter to query, we can run the Powershell cmdlet to obtain the information we want to measure. Each counter is uniquely identified through its name and its path (counter path), or location:
(Get-Counter '<CounterPath>').CounterSamples[0]
The result will be a Powershell object with some properties. For example:
Path                                             InstanceName      CookedValue
----                                             ------------      -----------
\\win10-tools\processor(_total)\% processor time _total       3.14235688964537
We can configure the Wazuh command module to analyze performance metrics with this information.
Infrastructure
To demonstrate the monitoring of Windows resources using Wazuh, we set up the following infrastructure:
1. A pre-built ready-to-use Wazuh OVA 4.12.0. Follow this guide to download the virtual machine. This endpoint hosts the Wazuh central components (Wazuh server, Wazuh indexer, and Wazuh dashboard).
2. Windows 11 endpoint with Wazuh agent 4.12.0 installed and enrolled to the Wazuh server. To install the Wazuh agent, refer to the installation guide.
Configuration
Perform the following configuration steps on the Wazuh server, Wazuh dashboard, and the Windows endpoint.
Wazuh server
To generate an alert on the Wazuh dashboard, we need to create rules to match the generated logs.
1. Create rules to detect metrics in the logs from the command monitoring module. Add the rules to the custom rules file /var/ossec/etc/rules/windows_performance_monitor.xml on the Wazuh server:
<group name="WinCounter,">

    <rule id="301000" level="0">
	  <decoded_as>json</decoded_as>
	  <match>^{"winCounter":</match>
	  <description>Windows Performance Counter: $(winCounter.Path)</description>
    </rule>

    <rule id="302000" level="3">
	  <if_sid>301000</if_sid>
	  <field name="winCounter.Path">memory\\available mbytes</field>
	  <description>Windows Counter: Available Memory</description>
	  <group>MEMUsage,</group>
    </rule>

    <rule id="302001" level="5">
	  <if_sid>302000</if_sid>
	  <field name="winCounter.CookedValue" type="pcre2">^[5-9]\d\d$</field>
	  <description>Windows Counter: Available Memory less than 1GB</description>
	  <group>MEMUsage,</group>
    </rule>

    <rule id="302002" level="7">
	  <if_sid>302000</if_sid>
	  <field name="winCounter.CookedValue" type="pcre2">^[1-4]\d\d$</field>
	  <description>Windows Counter: Available Memory less than 500GB</description>
	  <group>MEMUsage,</group>
    </rule>

    <rule id="302003" level="3">
	  <if_sid>301000</if_sid>
	  <field name="winCounter.Path">free megabytes</field>
	  <description>Windows Counter: Disk Space Free</description>
	  <group>DiskFree,</group>
    </rule>

    <rule id="302004" level="3">
	  <if_sid>301000</if_sid>
	  <field name="winCounter.Path">bytes received/sec</field>
	  <description>Windows Counter: Network Traffic In</description>
	  <group>NetworkTrafficIn,</group>
    </rule>

    <rule id="302005" level="3">
	  <if_sid>301000</if_sid>
	  <field name="winCounter.Path">bytes sent/sec</field>
	  <description>Windows Counter: Network Traffic Out</description>
	  <group>NetworkTrafficOut,</group>
    </rule>

    <rule id="303000" level="3">
	  <if_sid>301000</if_sid>
	  <field name="winCounter.Path">processor\S+ processor time</field>
	  <description>Windows Counter: CPU Usage</description>
	  <group>CPUUsage,</group>
    </rule>

    <rule id="303001" level="5">
	  <if_sid>303000</if_sid>
	  <field name="winCounter.CookedValue">^8\d.\d+$</field>
	  <description>Windows Counter: CPU Usage above 80%</description>
	  <group>CPUUsage,</group>
    </rule>

    <rule id="303002" level="7">
	  <if_sid>303000</if_sid>
	  <field name="winCounter.CookedValue">^9\d.\d+$</field>
	  <description>Windows Counter CPU Usage above 90%</description>
	  <group>CPUUsage,</group>
    </rule>

</group>
Where:
- Rule ID
301000is the base rule for detecting all the logs from the winCounter commands. - Rule ID
302000is triggered when a memory metric check is done. - Rule ID
302001is triggered when the memory utilized is less than 1GB. - Rule ID
302002is triggered when the memory available is less than 500GB. - Rule ID
302003is triggered when a disk metric check is done. - Rule ID
302004is triggered when the incoming network traffic is checked. - Rule ID
302005is triggered when the outgoing network traffic is checked. - Rule ID
303000is triggered when a CPU metric check is done. - Rule ID
303001is triggered when the CPU usage exceeds 80%. - Rule ID
303002is triggered when the CPU usage exceeds 90%.
3. Restart the Wazuh manager to apply these changes:
$ sudo systemctl restart wazuh-manager
You will see relevant alerts on the Wazuh dashboard after restarting the Wazuh manager service:

Modifying the Wazuh template
To use the alerts to create visualizations and dashboards later on, we need to set the data type of all custom fields to long. By default, the Wazuh indexer analyzes values from existing alerts as string data types. To change the default data type from string to long, do the following:
Wazuh server
1. Add the custom fields in the Wazuh template. Find the data section in the /etc/filebeat/wazuh-template.json file, and add the highlighted custom fields to the data properties section:
{
  "order": 0,
  "index_patterns": [
    "wazuh-alerts-4.x-*",
    "wazuh-archives-4.x-*"
  ],
  "settings": {
  ...
  },
  "mappings": {
    "dynamic_templates": [
      {
  ...
    "data": {
      "properties": {
        "winCounter": {
           "properties": {
             "CookedValue": {
               "type": "long"
             },
             "RawValue": {
               "type": "long"
             }
           }
        },
        "audit": {
          "properties": {
            "acct": {
              "type": "keyword"
        ...
2. To apply the changes to the Wazuh template, run the command below:
$ sudo filebeat setup -index-management
An expected output is shown below:
ILM policy and write alias loading not enabled.

Index setup finished.
Wazuh dashboard
Perform the following steps on the Wazuh dashboard to initialize the data fields in the Wazuh alerts index using queries sent to the Wazuh indexer:
1. Navigate to Indexer management > Dev Tools on the Wazuh dashboard. Execute the commands from steps 2 and 3 in the console on this page.
2. Run the following command to view all wazuh-alerts-* indices and identify the most recent:
GET _cat/indices/wazuh-alerts-*
In the sample output below, we provide a summary of the Wazuh alert indices:
green open wazuh-alerts-4.x-2025.04.30 rzOQQaiUSLqB6QlC7UAh2A 3 0    428 0   1.1mb   1.1mb
green open wazuh-alerts-4.x-2025.05.09 K7aTNJZ_TVWtsXGcEVuhPw 3 0     76 0 563.8kb 563.8kb
green open wazuh-alerts-4.x-2025.05.06 J4kxPaGfTlWQMGJO0ijB-w 3 0 367953 0 146.3mb 146.3mb
green open wazuh-alerts-4.x-2025.04.16 KbnV-7h9TlyHxwiYLd5TEA 3 0     17 0 129.8kb 129.8kb
green open wazuh-alerts-4.x-2025.05.05 QcyOTFaeRaSZSaKSg88iyQ 3 0 163576 0  66.4mb  66.4mb
green open wazuh-alerts-4.x-2025.05.08 pCyBCy-CQ92T_oKJHmBgKg 3 0 107217 0  44.7mb  44.7mb
green open wazuh-alerts-4.x-2025.04.17 L5LG6JFGR1ihAftFO6jCqQ 3 0    159 0 630.4kb 630.4kb
green open wazuh-alerts-4.x-2025.05.02 qj_971hcSL2A6b3IqfnTug 3 0 142433 0  60.3mb  60.3mb
green open wazuh-alerts-4.x-2025.05.03 PLIivUjNRTaATVwZcqmg_A 3 0  20489 0  12.1mb  12.1mb
The Wazuh alert index pattern uses the format wazuh-alerts-4.x-YYYY.MM.DD. Identify the most recent alerts index in your output and write down the name. The most recent index is typically the current date. For example, the most recent alerts index in the example output above is wazuh-alerts-4.x-2025.05.09
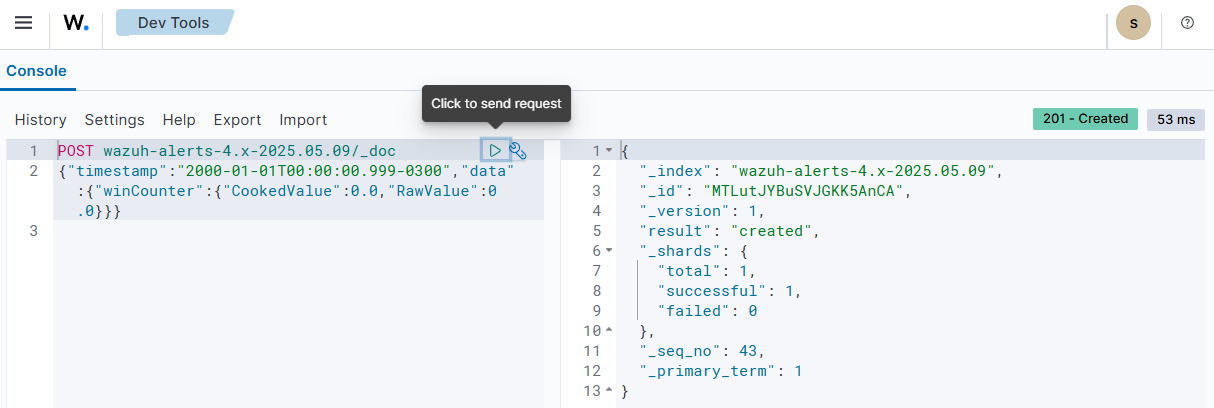
3. Run the following command to initialize the fields with the expected data types. Replace <RECENT_ALERTS_INDEX> with your most recent Wazuh alerts index:
POST <RECENT_ALERTS_INDEX>/_doc
{"timestamp":"2000-01-01T00:00:00.999-0300","data":{"winCounter":{"CookedValue":0.0,"RawValue":0.0}}}
If successful, the Wazuh indexer returns a 201 – Created status code along with a JSON response that provides details about the operation. We show a successful execution in the image below.
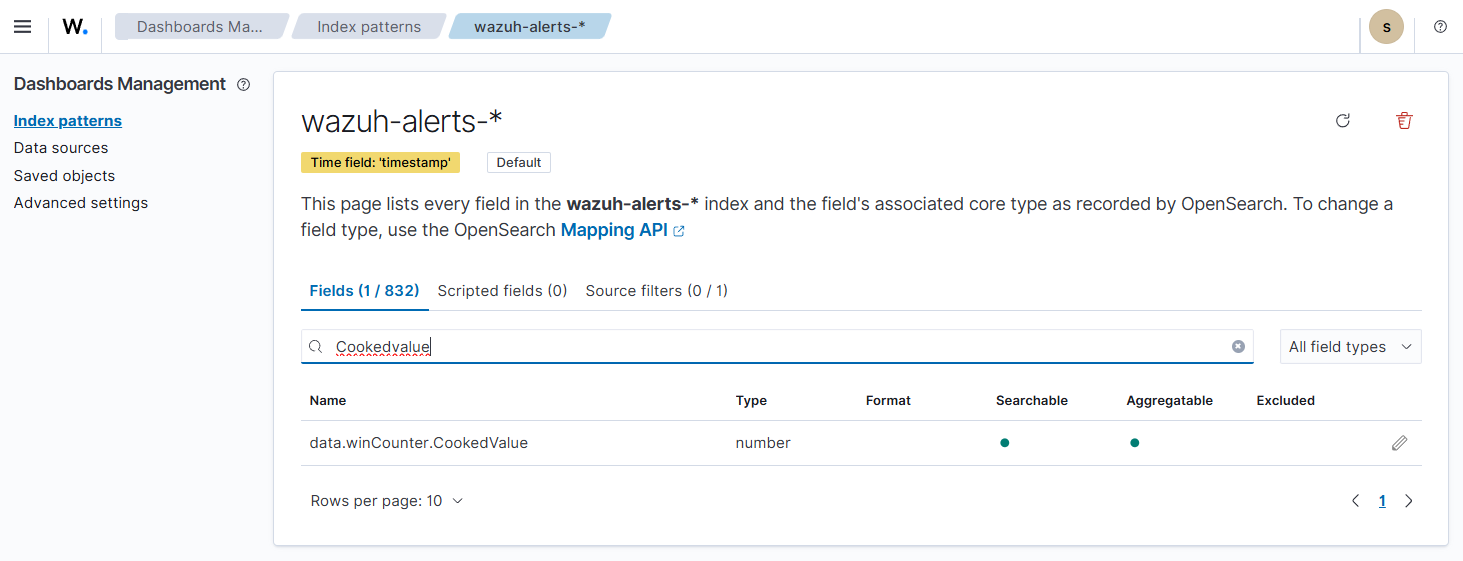
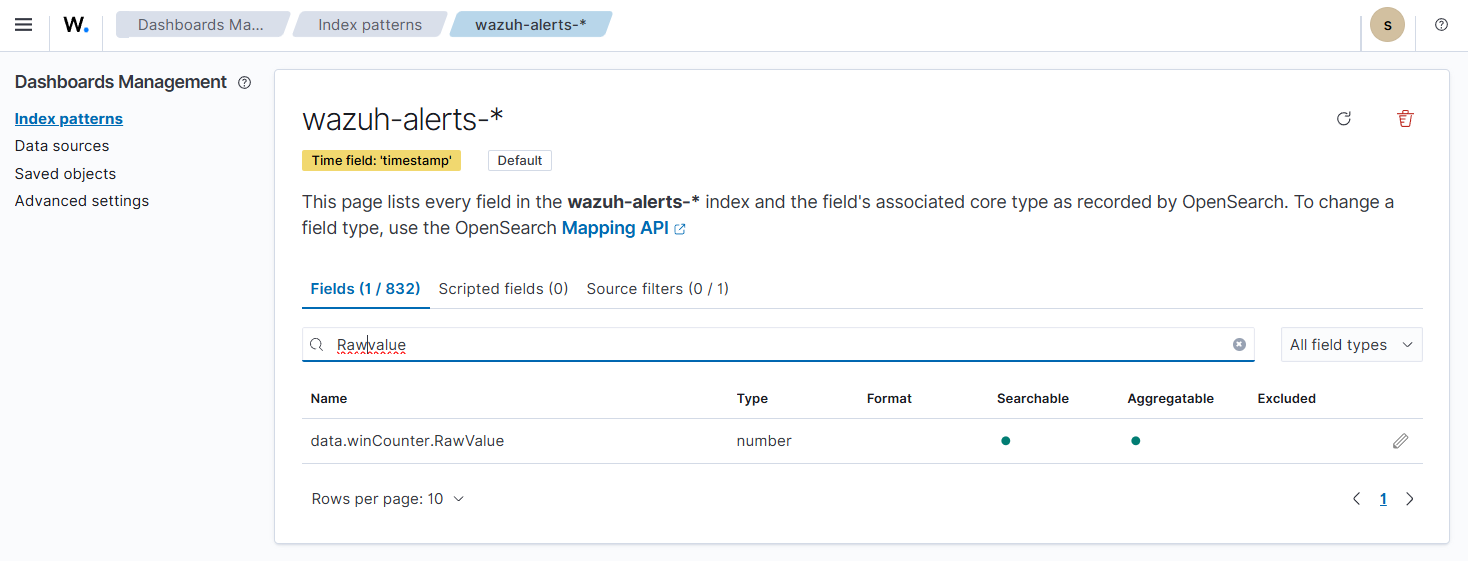
4. Navigate to Dashboard management > Dashboards Management > Index patterns, select the wazuh-alerts-* index. Click the refresh button in the top-right hand corner of the page to refresh the index pattern.

5. Verify that the updated CookedValue and RawValue fields are now changed to the number data type by searching the wazuh-alerts-* Fields.
Windows endpoint
Using the Wazuh command module, we write wodle commands to run Get-Counter cmdlet on the Windows endpoint. The output of the Powershell commands are converted to JSON format using the ConvertTo-Json -compress flag. For example:
Powershell -c @{ winCounter = (Get-Counter ‘\Processor(*)\% Processor Time’).CounterSamples[0] } | ConvertTo-Json -compress
Take the following steps to configure the Wazuh command monitoring module on the Windows endpoint.
1. Edit the Wazuh agent C:\Program Files (x86)\ossec-agent\ossec.conf file and add the following command monitoring configuration within the <ossec_config> block:
<!-- CPU Usage -->
	<wodle name="command">
		<disabled>no</disabled>
		<tag>CPUUsage</tag>
		<command>Powershell -c "@{ winCounter = (Get-Counter '\Processor(_Total)\% Processor Time').CounterSamples[0] } | ConvertTo-Json -compress"</command>
		<interval>1m</interval>
		<ignore_output>no</ignore_output>
		<run_on_start>yes</run_on_start>
		<timeout>0</timeout>
	</wodle>
<!-- Memory Usage -->
	<wodle name="command">
		<disabled>no</disabled>
		<tag>MEMUsage</tag>
		<command>Powershell -c "@{ winCounter = (Get-Counter '\Memory\Available MBytes').CounterSamples[0] } | ConvertTo-Json -compress"</command>
		<interval>1m</interval>
		<ignore_output>no</ignore_output>
		<run_on_start>yes</run_on_start>
		<timeout>0</timeout>
	</wodle>
<!-- Network Received -->
	<wodle name="command">
		<disabled>no</disabled>
		<tag>NetworkTrafficIn</tag>
		<command>Powershell -c "@{ winCounter = (Get-Counter '\Network Interface(*)\Bytes Received/sec').CounterSamples[0] } | ConvertTo-Json -compress"</command>
		<interval>1m</interval>
		<ignore_output>no</ignore_output>
		<run_on_start>yes</run_on_start>
		<timeout>0</timeout>
	</wodle>
<!-- Network Sent -->
	<wodle name="command">
		<disabled>no</disabled>
		<tag>NetworkTrafficOut</tag>
		<command>Powershell -c "@{ winCounter = (Get-Counter '\Network Interface(*)\Bytes Sent/sec').CounterSamples[0] } | ConvertTo-Json -compress"</command>
		<interval>1m</interval>
		<ignore_output>no</ignore_output>
		<run_on_start>yes</run_on_start>
		<timeout>0</timeout>
	</wodle>
<!-- Disk Free -->
	<wodle name="command">
		<disabled>no</disabled>
		<tag>DiskFree</tag>
		<command>Powershell -c "@{ winCounter = (Get-Counter '\LogicalDisk(*)\Free Megabytes').CounterSamples[0] } | ConvertTo-Json -compress"</command>
		<interval>1m</interval>
		<ignore_output>no</ignore_output>
		<run_on_start>yes</run_on_start>
		<timeout>0</timeout>
	</wodle>
Note
You can use the centralized configuration to distribute this setting across multiple monitored endpoints. However, remote commands are disabled by default for security reasons and have to be explicitly enabled on each agent.
2. Restart the Wazuh agent to apply this change:
> NET START Wazuh
Building custom visualizations and dashboards
We can further improve the viewing of existing metrics using custom dashboards, visualizations, and graphs. This presents a dynamic representation for monitoring system performance.
Creating custom visualizations
Wazuh dashboard
Click the upper-left menu icon and navigate to ☰ > Explore > Visualize > Create new visualization.
We use the line visualization format and wazuh-alerts-* as the index pattern name. This will create a data tab where the required filters are specified. The Wazuh dashboard visualization builder contains two aggregation objects; metric and bucket aggregation as shown above:
- The metric aggregation contains the actual values of the metric to be calculated. It is typically represented on the Y-axis.
- The bucket aggregation determines how the data is segmented or grouped such as by date. It is typically represented on the X-axis.
Both the Y-axis and the X-axis are used to plot the data points on a visualization chart. Follow the instructions below to create individual visualizations for this blog post.
CPU usage visualization
a. Select the line visualization format on the Visualize tab, and use wazuh-alerts-* as the index pattern name.
b. Set the following values on Y-axis, in Metrics:
Aggregation=MaxField=data.winCounter.CookedValueCustom label=CPU usage
c. Add an X-axis in Buckets and set the following values:
Aggregation=Date HistogramField=timestampMinimum interval=Minute
d. Click on Add filter by the top left of the dashboard, and set the following values:
Field=rule.idOperator=isValue=303000
e. Click the Update button.
f. Click the upper-right Save button and assign a title to save the visualization.
Memory usage visualization
a. Select the line visualization format on the Visualize tab, and use wazuh-alerts-* as the index pattern name.
b. Set the following values on the Y-axis, in Metrics:
Aggregation=MaxField=data.winCounter.CookedValueCustom label=Memory Available
c. Add an X-axis in Buckets and set the following values:
Aggregation=Date HistogramField=timestampMinimum interval=Minute
d. On the top left of the dashboard, click on Add filter and set the following values:
Field=rule.idOperator=isValue=302000
e. Click the Update button.
f. Click the upper-right Save button and assign a title to save the visualization.
Disk usage visualization
a. Select the metric visualization format on the Visualize tab, and use wazuh-alerts-* as the index pattern name.
b. Set the following values on the Y-axis, in Metrics:
Aggregation=MaxField=data.winCounter.CookedValueCustom label=Disk Free
c. On the top left of the dashboard, click on Add filter and set the following values:
Field=rule.idOperator=isValue=302003
d. Click the Update button.
e. Click the upper-right Save button and assign a title to save the visualization.
Network inbound visualization
a. Select the line visualization format on the Visualize tab, and use wazuh-alerts-* as the index pattern name.
b. Set the following values on the Y-axis, in Metrics:
Aggregation=MaxField=data.winCounter.CookedValueCustom label=Network Inbound
c. Add an X-axis in Buckets and set the following values:
Aggregation=Date HistogramField=timestampMinimum interval=Minute
d. Click on Add filter by the top left of the dashboard, and set the following values:
Field=rule.idOperator=isValue=302004
e. Click the Update button.
f. Click the upper-right Save button and assign a title to save the visualization.
Network outbound visualization
a. Select the line visualization format on the Visualize tab, and use wazuh-alerts-* as the index pattern name.
b. Set the following values on the Y-axis, in Metrics:
Aggregation=MaxField=data.winCounter.CookedValueCustom label=Network Outbound
c. Add an X-axis in Buckets and set the following values:
Aggregation=Date HistogramField=timestampMinimum interval=Minute
d. Click on Add filter by the top left of the dashboard, and set the following values:
Field=rule.idOperator=isValue=302005
e. Click the Update button.
f. Click the upper-right Save button and assign a title to save the visualization.
Once this is applied, we can build custom visualizations and dashboards with those values.
Creating custom dashboards
1. Click on the upper-left menu icon and navigate to ☰ > Explore > Dashboards > Create new dashboard.
2. Click Add an existing and select the earlier created visualizations to populate the dashboard.
3. Save the dashboard by selecting the save option on the top-right navigation bar.
The GIF below shows a sample dashboard containing the newly created visualizations.

Conclusion
This guide details how Wazuh can be used to monitor Windows system resources like CPU, RAM, etc. Observing resource usage contributes to the overall security monitoring of endpoints.
If you have any questions or require assistance regarding this setup, refer to our community channels.
References