DNS tunneling allows attackers to hide malicious data and commands within legitimate Domain Name System (DNS) traffic, bypassing firewalls and security controls. Attackers exploit the fact that DNS traffic is often permitted on networks without deep inspection to encode sensitive data and commands into DNS queries and responses. This creates a covert communication channel between the attacker-controlled DNS server and the victim endpoint, while evading traditional security controls. DNS tunnels can be used for Command & Control (C2), data exfiltration, network footprinting, malware delivery and staging, and other malicious activities, making it very dangerous.
In this blog post, we demonstrate how to detect DNS tunneling attacks with Wazuh by identifying key behavioral indicators associated with malicious DNS activity. We use tcpdump, a native Linux command-line packet capture tool, to continuously monitor the primary network interface for DNS traffic. The captured logs are forwarded to Wazuh, a SIEM and XDR platform, where they are ingested and processed by the Wazuh Analysis engine.
Indicators of a DNS tunneling attack
The following are some of the key indicators of DNS tunneling:
- High‑entropy DNS queries: DNS tunneling often generates subdomains that appear random or pseudo‑random, containing long strings of meaningless characters. High entropy is a strong indicator of encoded data (base32/base64) being transmitted within DNS queries instead of human-readable domain names. Queries containing encoded payloads are a common sign of covert data exchange.
- Unusually long domain names or labels: Attackers frequently abuse the length limits of DNS labels and fully qualified domain names (FQDN) to add more data into each request. Domains with excessively long subdomains or repeated long labels are uncommon in legitimate traffic and raise suspicion.
- Excessive DNS query frequency from a single host: A compromised system using DNS tunneling may send a high volume of DNS requests within a short time frame. This behavior deviates from normal DNS usage patterns, especially when queries repeatedly target the same domain.
- Deep subdomain level: A deep subdomain might indicate DNS tunneling, as most legitimate domains use one to three levels for structure or service segmentation. DNS tunneling tools often stack multiple subdomains to fragment and transport encoded data within DNS query size limits. When deep subdomain levels are combined with other indicators, the resulting pattern warrants investigation.
- Abnormal DNS query or response types: Instead of returning standard A or AAAA records with IP addresses, DNS tunneling may use TXT, NULL, or other record types to carry encoded data in queries and responses.
- DNS queries to uncommon, newly registered, or suspicious domains: DNS tunneling operations typically rely on attacker‑controlled domains that have little or no legitimate reputation. Queries to newly registered domains or domains not previously seen in the environment can indicate command‑and‑control (C2) activity.
Infrastructure
To demonstrate the detection of DNS tunneling attacks with Wazuh, we use the following infrastructure:
- A prebuilt, ready-to-use Wazuh OVA 4.14.3, which includes the Wazuh central components (Wazuh server, Wazuh indexer, and Wazuh dashboard). Follow this guide to download and set up the Wazuh virtual machine.
- An Ubuntu 24.04 endpoint with the Wazuh agent 4.14.3 installed and enrolled in the Wazuh server.
Detection
To ensure accuracy in our detection, we monitor DNS traffic on port 53 using tcpdump and Wazuh detection rules that combine two or more DNS tunneling indicators. We write our detection logic based on these three conditions:
| Indicator | Condition |
| Entropy | Base32 and base64 encoding, and query/response length more than 10 characters. |
| Deep subdomain level | Three or more subdomains, eg, test.test.test.com. |
| Query type | Suspicious queries based on TXT or NULL type. |
Ubuntu endpoint
Perform the following steps as root to monitor DNS traffic on the Ubuntu endpoint and send the logs to Wazuh:
Note
tcpdump is pre-installed on most Linux distributions. You can verify that it is present on the Ubuntu endpoint by running tcpdump --version. If it is not present, install using: sudo apt install tcpdump.
- Create the
dns_monitor.shscript to monitor DNS traffic using thetcpdumptool:
# touch dns_monitor.sh
- Add the following content to the
dns_monitor.shscript to use thetcpdump -i <INTERFACE> -nn -vvv port 53command to monitor all DNS traffic. The script logs the results to the/var/log/dns_monitoring.logfile.
#!/usr/bin/env bash
set -euo pipefail

INTERFACE="<YOUR_INTERFACE>"
LOG_FILE="/var/log/dns_monitoring.log"
PID_FILE="/run/dns-monitor.pid"

[[ $EUID -eq 0 ]] || { echo "Run as root" >&2; exit 1; }
mkdir -p "$(dirname "$LOG_FILE")" "$(dirname "$PID_FILE")"

start() {
    [[ -f "$PID_FILE" ]] && kill -0 "$(cat "$PID_FILE")" 2>/dev/null && { echo "Already running"; exit 0; }
    tcpdump -i "$INTERFACE" -l -nn -vvv port 53 >> "$LOG_FILE" 2>&1 &
    sleep 1
    kill -0 $! 2>/dev/null && echo $! > "$PID_FILE" && echo "Started (PID: $!)" || { echo "Failed to start" >&2; exit 1; }
}

stop() {
    [[ -f "$PID_FILE" ]] || { echo "Not running"; exit 0; }
    PID=$(cat "$PID_FILE")
    kill "$PID" 2>/dev/null && sleep 1 && rm -f "$PID_FILE" && echo "Stopped" || echo "Already stopped"
}

status() {
    [[ -f "$PID_FILE" ]] && kill -0 "$(cat "$PID_FILE")" 2>/dev/null && { echo "running (PID: $(cat "$PID_FILE"))"; exit 0; }
    echo "stopped"; exit 1
}

case "${1:-}" in
    start|stop|status) "$1" ;;
    restart) stop; start ;;
    *) echo "Usage: $0 {start|stop|restart|status}" >&2; exit 1 ;;
esac
Replace: <YOUR_INTERFACE> with the Ethernet interface name on your Ubuntu endpoint.
Note
The dns_monitor.sh script is run using the flags: start | stop | restart | status
Note: The dns_monitor.sh script is run using the flags: start | stop | restart | status |
- Run the following command to make the
dns_monitor.shscript executable and move it to the/usr/local/bin/directory:
# chmod +x dns_monitor.sh
# mv ./dns_monitor.sh /usr/local/bin/dns_monitor.sh
- Create a systemd file,
dns-monitor.service, in the/etc/systemd/systemdirectory to run thedns_monitor.shscript as a service automatically at system boot time:
# touch /etc/systemd/system/dns-monitor.service
- Add the following lines to the
/etc/systemd/system/dns-monitor.servicefile:
[Unit]
Description=DNS Traffic Monitoring Service

# Ensure network is up before starting.
After=network.target network-online.target
Wants=network-online.target

[Service]
Type=forking
User=root
Group=root

# Path to your script. Update if you place it elsewhere.
ExecStart=/usr/local/bin/dns_monitor.sh start
ExecStop=/usr/local/bin/dns_monitor.sh stop
ExecReload=/usr/local/bin/dns_monitor.sh restart

# The script manages its own PID file at /run/dns-monitor.pid
PIDFile=/run/dns-monitor.pid

# Setting this directory ensures that dns_monitoring.log lands in /var/log/ directory
WorkingDirectory=/var/log

# Restart policy
Restart=on-failure
RestartSec=5

# Security hardening
ProtectSystem=strict
ReadWritePaths=/var/log /run
NoNewPrivileges=true

[Install]
WantedBy=multi-user.target
- Reload systemd to recognize the new service, enable the service to run on system boot, and start the service:
# systemctl daemon-reload
# systemctl enable dns-monitor.service
# systemctl start dns-monitor.service
- Confirm that the service is running as expected:
# systemctl status dns-monitor.service
● dns-monitor.service - DNS Traffic Monitoring Service
     Loaded: loaded (/etc/systemd/system/dns-monitor.service; enabled; preset: enabled)
     Active: active (running) since Fri 2026-02-27 13:52:50 WAT; 9s ago
    Process: 30997 ExecStart=/usr/local/bin/dns_monitor.sh start (code=exited, status=0/SUCCESS)
   Main PID: 31001 (tcpdump)
      Tasks: 1 (limit: 4547)
     Memory: 1.1M (peak: 1.9M)
        CPU: 124ms
     CGroup: /system.slice/dns-monitor.service
             └─31001 tcpdump -i ens33 -l -nn -vvv port 53

Feb 27 13:52:49 SUbuntu systemd[1]: Starting dns-monitor.service - DNS Traffic Monitoring Service...
Feb 27 13:52:50 SUbuntu dns_monitor.sh[30997]: Started (PID: 31001)
Feb 27 13:52:50 SUbuntu systemd[1]: Started dns-monitor.service - DNS Traffic Monitoring Service.
- Add the following configuration to the
<ossec_config>block of the/var/ossec/etc/ossec.conffile to monitor the/var/log/dns_monitoring.log file.
<ossec_config>
  <localfile>
    <log_format>syslog</log_format>
    <location>/var/log/dns_monitoring.log</location>
  </localfile>
</ossec_config>
- Restart the Wazuh agent service to apply the new configuration:
# systemctl restart wazuh-agent
Wazuh dashboard
Perform the following steps on the Wazuh dashboard to monitor DNS traffic logs from the Ubuntu endpoint and detect DNS tunneling events:
- Navigate to ☰ > Server management > Decoders > Add new decoders file to create a new decoder file.
- Name the decoder file as
dns_monitor.xml, copy and paste the following decoders into the file to extract important fields from the/var/log/dns_monitoring.logfile:
<decoder name="dns_monitor">
  <prematch type="pcre2">^\s+\d+[\d\.]+\.\d+ > \d+[\d\.]+\.\d+:</prematch>
</decoder>

<decoder name="dns_monitor_fields">
  <parent>dns_monitor</parent>
  <regex type="pcre2">(\d+[\d\.]+)\.(\d+) > (\d+[\d\.]+)\.(\d+):</regex>
  <order>src_ip, src_port, dst_ip, dst_port</order>
</decoder>

<decoder name="dns_monitor_fields">
  <parent>dns_monitor</parent>
  <regex type="pcre2">(?:\+|q:) (\w+)\?</regex>
  <order>dns_type</order>
</decoder>

<decoder name="dns_monitor_fields">
  <parent>dns_monitor</parent>
  <regex type="pcre2">\?\s+([^\s\)]+)</regex>
  <order>dns_query</order>
</decoder>

<decoder name="dns_monitor_fields">
  <parent>dns_monitor</parent>
  <regex type="pcre2">ns:\s+([^\s]+)</regex>
  <order>dns_ns</order>
</decoder>

<decoder name="dns_monitor_fields">
  <parent>dns_monitor</parent>
  <regex type="pcre2">SOA\s+([^\s]+)\s+([^\s]+)</regex>
  <order>dns_soa_primary, dns_soa_email</order>
</decoder>
- Click Save to save the changes to the decoder file, and Reload to apply them.
- Navigate to ☰ > Server management > Rules > Add new rules file to create a new rules file.
- Name the rules file as
dns_monitor.xml, copy and paste the following rules into the file to generate alerts based on the conditions defined earlier:
<group name="dns_tunneling,exfiltration,">

  <!--BASE RULE. Matches all logs processed by the 'dns_monitor' decoder.-->
  <rule id="101200" level="0">
    <decoded_as>dns_monitor</decoded_as>
    <description>DNS Monitor Base Event</description>
  </rule>

  <!--CONDITION 1: ENCODED QUERY (High Entropy Approximation). Detects long alphanumeric strings typical of Base64/Base32 within the query.-->
  <rule id="101201" level="7">
    <if_sid>101200</if_sid>
    <field name="dns_query" type="pcre2">\b(?=[a-z0-9]*[0-9])(?=[a-z0-9]*[a-z])[a-z0-9]{10,}\b</field>
    <description>DNS Query: ($(dns_query)) contains encoded string - [High Entropy]</description>
  </rule>

  <!-- CONDITION 2: DEEP SUBDOMAIN. Detects 2 or more subdomain levels (e.g., a.b.c.example.com).-->
  <rule id="101202" level="7">
    <if_sid>101200</if_sid>
    <field name="dns_query" type="pcre2">^.+\..+\..+\..+</field>
    <description>DNS Query: ($(dns_query)) contains deep subdomain structure - [Depth >= 2 subdomains]</description>
  </rule>

  <!--CONDITION 3: SUSPICIOUS TYPE. Detects TXT or NULL record types often used for tunneling.-->
  <rule id="101203" level="7">
    <if_sid>101200</if_sid>
    <field name="dns_type" type="pcre2">TXT|NULL</field>
    <description>DNS Query: ($(dns_query)) uses suspicious record type - [$(dns_type)]</description>
  </rule>

  <!-- COMBINATION RULES (2 or More Conditions)   -->

  <!-- COMBINATION 1: Encoded + Suspicious Type -->
  <rule id="101204" level="12">
    <if_sid>101200</if_sid>
    <field name="dns_query" type="pcre2">\b(?=[a-z0-9]*[0-9])(?=[a-z0-9]*[a-z])[a-z0-9]{10,}\b</field>
    <field name="dns_type" type="pcre2">TXT|NULL</field>
    <description>Suspicious DNS Query: ($(dns_query)) - [Encoded + $(dns_type) record type] - DNS Tunneling suspected!</description>
  </rule>

  <!-- COMBINATION 2: Deep Subdomain + Suspicious Type -->
  <rule id="101205" level="12">
    <if_sid>101200</if_sid>
    <field name="dns_query" type="pcre2">^.+\..+\..+\..+</field>
    <field name="dns_type" type="pcre2">TXT|NULL</field>
    <description>Suspicious DNS Query: ($(dns_query)) - [Deep Subdomain + $(dns_type) record type] - DNS Tunneling suspected!</description>
  </rule>

  <!-- COMBINATION 3: Encoded + Deep Subdomain -->
  <rule id="101206" level="12">
    <if_sid>101200</if_sid>
    <field name="dns_query" type="pcre2">\b(?=[a-z0-9]*[0-9])(?=[a-z0-9]*[a-z])[a-z0-9]{10,}\b</field>
    <field name="dns_query" type="pcre2">^.+\..+\..+\..+</field>
    <description>Suspicious DNS Query: ($(dns_query)) - [Encoded + Deep Subdomain] - DNS Tunneling suspected!</description>
  </rule>

  <!-- COMBINATION 4: All 3 Conditions (Encoded + Deep Subdomain + Suspicious Type) -->
  <rule id="101207" level="15">
    <if_sid>101200</if_sid>
    <field name="dns_query" type="pcre2">[A-Za-z0-9]{16,}</field>
    <field name="dns_query" type="pcre2">^.+\..+\..+\..+</field>
    <field name="dns_type" type="pcre2">TXT|NULL</field>
    <description>CRITICAL: Suspicious DNS Query: ($(dns_query))  - [All Conditions Met] - High Confidence DNS Tunneling!</description>
  </rule>

</group>
Where:
101200is the parent rule that matches any log that is successfully decoded by thedns_monitordecoder.101201is triggered when a DNS query is longer than 10 characters, random, and alphanumeric, indicating that the query is encoded in base32 or base64.101202is triggered when a DNS query has a subdomain depth of two or more subdomains.101203is triggered when a suspicious DNS record type, such asTXTorNULL, is detected in the DNS log. You can include more record types in the detection to cover a wider spectrum.101204is triggered when the conditions for rules101201and101203are met. This carries a severity level of 12 because the combination of the two conditions is a strong indicator of DNS tunneling.101205is triggered when the conditions for rules101202and101203are met. This carries a severity level of 12 because the combination of the two conditions is a strong indicator of DNS tunneling.101206is triggered when the conditions for rules101201and101202are met. This carries a severity level of 12 because the combination of the two conditions is a strong indicator of DNS tunneling.101207is triggered when all the conditions in rules101201,101202, and101203are met. This carries a higher severity level of 15, as the combination of all three conditions is a stronger indicator of DNS tunneling.
- Click on Save to save the new changes to the decoder file, and Reload to apply the changes.
Attack simulation
We test the detection by running the dig utility on the Ubuntu endpoint to simulate a DNS tunneling attack. Run the test commands below:
| Rule ID | Test command |
| 101201 | dig @8.8.8.8 A a1b2c3d4e5f6g7h8.example.com |
| 101202 | dig @8.8.8.8 A testa.testb.testc.example.com |
| 101203 | dig @8.8.8.8 TXT testdomain.com |
| 101204 | dig @8.8.8.8 TXT a1b2c3d4e5f6g7h8.example.com |
| 101205 | dig @8.8.8.8 NULL testa.testb.testc.example.com |
| 101206 | dig @8.8.8.8 A a1b2c3d4e5f6g7h8.testa.testb.testc.example.com |
| 101207 | dig @8.8.8.8 TXT a1b2c3d4e5f6g7h8.testa.testb.testc.example.com |
Visualization
Follow the steps below to view the DNS tunneling alerts generated on the Wazuh dashboard:
- Navigate to ☰ > Threat intelligence > Threat Hunting.
- Switch to the Events tab.
- Click + Add filter. Then filter by
rule.groups. - Select
isin the Operator field. - Search and select
dns_tunnelingin the Values field. - Click on Save.
The image below shows DNS tunneling alerts generated by the Wazuh server after analyzing captured DNS traffic.
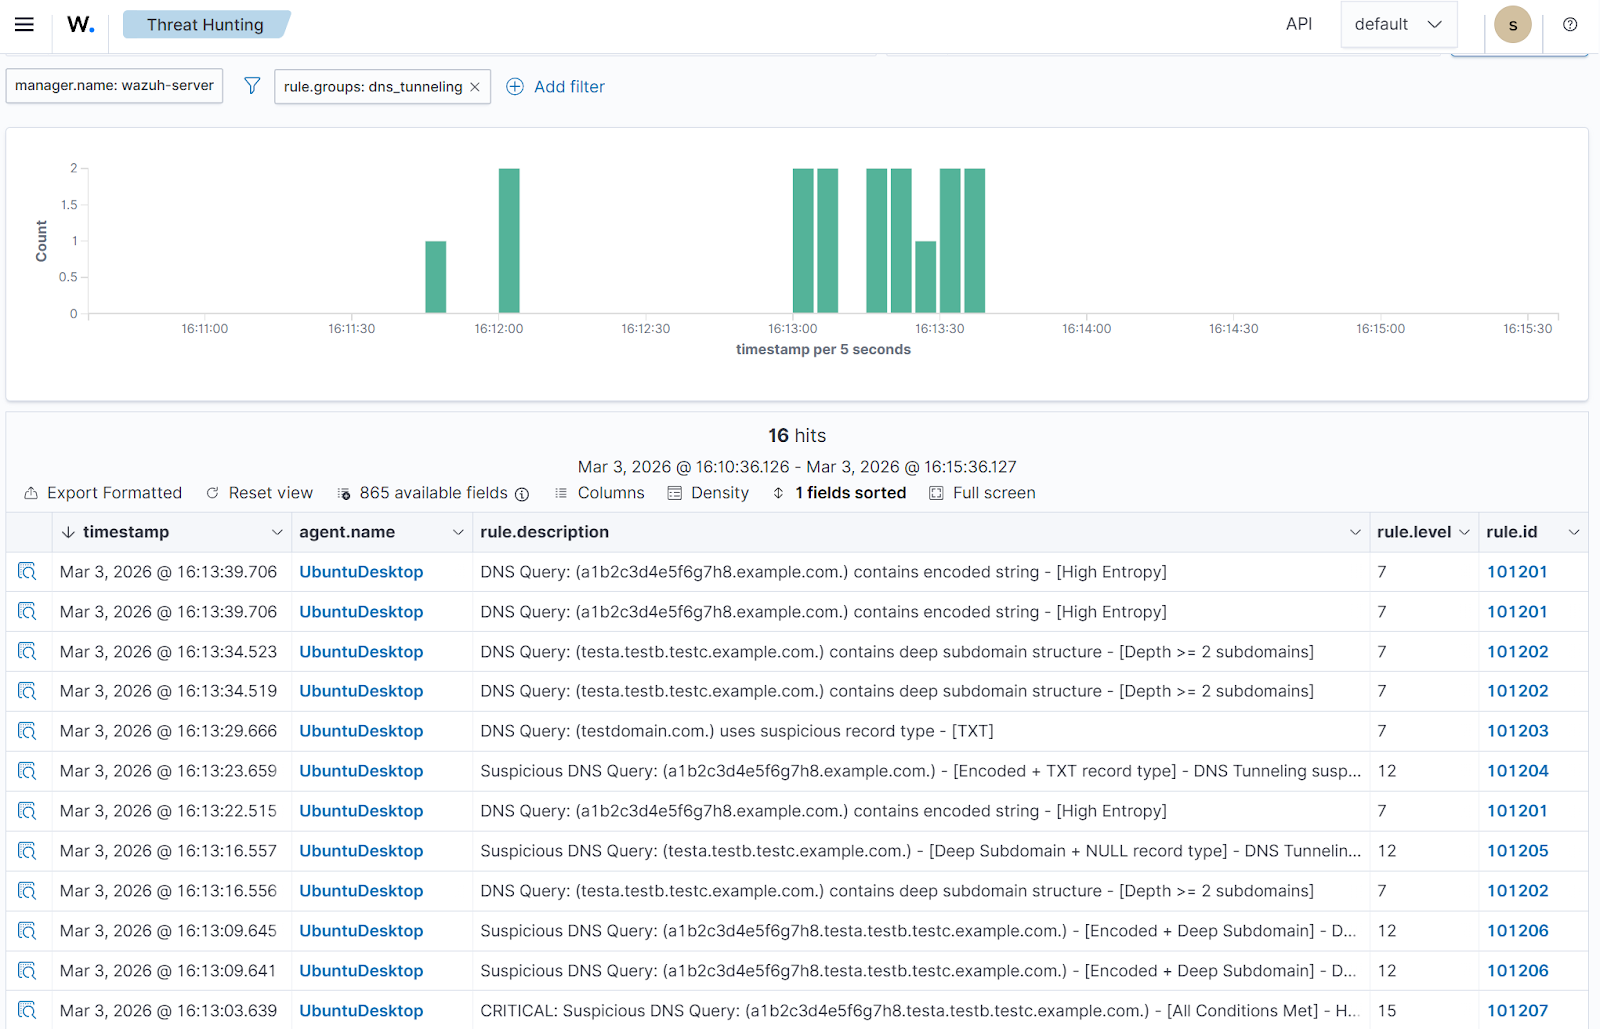
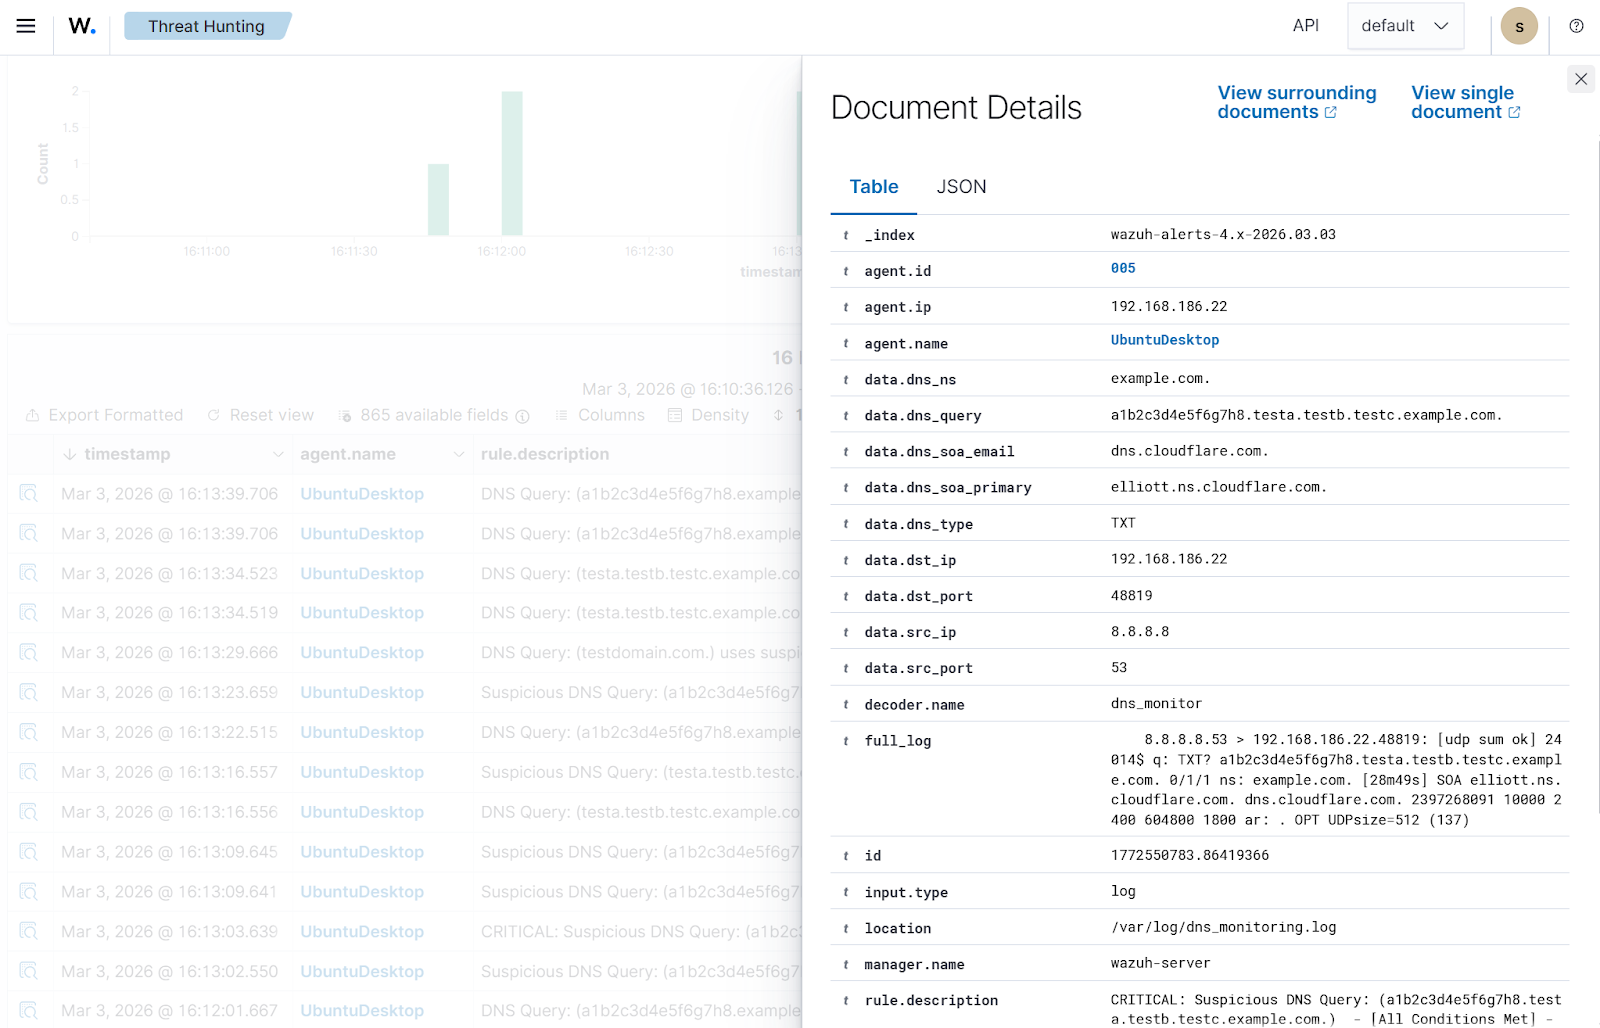
To view more details about a DNS alert, click the Inspect document details button at the far left.
Recommendation
Due to the high volume of DNS traffic, we recommend rotating the /var/log/dns_monitoring.log log file on the Ubuntu endpoint using the logrotate utility. The logs can be rotated daily, weekly, monthly, or yearly, as needed. Follow the steps below to configure weekly log rotation:
- Create a
/etc/logrotate.d/dns-monitorfile:
# touch /etc/logrotate.d/dns-monitor
- Add the following configuration to the
/etc/logrotate.d/dns-monitorfile to enable log rotation weekly:
/var/log/dns_monitoring.log {
    su root root
    weekly
    rotate 4
    compress
    delaycompress
    missingok
    notifempty
    create 0640 root root

    postrotate
        /usr/bin/systemctl restart dns-monitor.service
    endscript
}
Where:
/var/log/dns_monitoring.logspecifies the target log file path to be rotated.su root rootruns rotation asrootuser and group to bypass directory permission errors.weeklytriggers rotation only if seven days have passed since the last rotation.rotate 4retains the 4 most recent archived logs before deleting older versions. This can be increased to a higher figure.compressarchives the log files to reduce disk usage.delaycompresswaits one cycle before compressing the most recent archive to ensure writing is complete.missingokprevents errors if the log file is missing during the rotation check.notifemptyskips rotation if the current log file contains no data.create 0640root root generates a new log file with defined permissions and ownership after rotation.postrotatebegins a block of custom commands to run after the log file is moved./usr/bin/systemctl restart dns-monitor.servicerestartsdns-monitor.serviceto switch the log file to the newly created one.endscriptends the custom command block.
- Run the debug command to confirm that there are no errors in the /etc/logrotate.d/dns-monitor file:
# logrotate -d /etc/logrotate.d/dns-monitor
- Run the following commands to enable
logrotateto be triggered by a timer unit and verify the status:
# systemctl enable --now logrotate.timer
# systemctl status logrotate.timer
● logrotate.timer - Daily rotation of log files
     Loaded: loaded (/usr/lib/systemd/system/logrotate.timer; enabled; preset: enabled)
     Active: active (waiting) since Thu 2026-03-05 15:17:54 WAT; 27min ago
    Trigger: Fri 2026-03-06 00:00:00 WAT; 8h left
   Triggers: ● logrotate.service
       Docs: man:logrotate(8)
             man:logrotate.conf(5)

Mar 05 15:17:54 SUbuntu systemd[1]: Started logrotate.timer - Daily rotation of log files.
Note
To instantly confirm that the log rotation works, run the command: sudo logrotate -f /etc/logrotate.d/dns-monitor. Rotated logs are stored in the /var/log directory and can be found using the command: ls -lh /var/log/dns_monitoring.log*.
Conclusion
In this post, we show a practical approach to detecting DNS tunneling by capturing DNS traffic using the tcpdump tool and analyzing it with Wazuh. This allows us to surface patterns commonly linked to DNS-based data exfiltration. By maintaining visibility into DNS activity, security teams can expose covert communication channels before serious data loss or command-and-control activity occurs.
Wazuh is a free, open source security platform that provides a wide range of capabilities to monitor and safeguard your infrastructure against malicious activities. If you have questions about this blog post or Wazuh, join our community to connect directly with the team.