
Security teams process large volumes of alerts each day, which makes it difficult to identify recurring threats, prioritize incidents, and respond consistently. While continuous monitoring is essential, organizations can also benefit from scheduled summaries that consolidate alert activity over a defined period. These reports help analysts recognize patterns, surface recurring issues, and track risk trends that are easy to miss when alerts are reviewed individually.
The Wazuh unified XDR and SIEM platform provides a built-in integration with Shuffle, an open source Security Orchestration, Automation, and Response (SOAR) platform. Organizations can automate the processing of daily security reports and incident escalation by combining both platforms. Instead of reacting to individual alerts in isolation, you can evaluate scheduled reports against predefined conditions such as alert thresholds, vulnerability status, or rule frequency. Automated workflows then escalate incidents, create tickets in ticketing or case management systems, or notify security teams only when the configured conditions are met.
In this blog post, we demonstrate how to build a scheduled Shuffle workflow that queries the Wazuh server and indexer APIs for daily alert activity. We also add conditional-response workflows to process the report data. The workflow triggers threshold-based alert escalation, automatically creates cases in TheHive, and delivers summary reports to Slack. It provides summaries of security information from the last 24 hours across five common operational areas:
- Critical and high-severity alerts generated on monitored endpoints.
- Brute-force activity detected on monitored endpoints.
- Critical and high-severity vulnerabilities detected on monitored endpoints.
- Newly installed software or packages on monitored endpoints.
- Monitored endpoints that are offline or no longer reporting to the Wazuh server.
Infrastructure
We use the following infrastructure to deploy the components required for automated workflows.
- A Wazuh 4.14.7 instance, which includes the Wazuh server, Wazuh indexer, and Wazuh dashboard. Follow the Assisted installation guide to install these Wazuh components.
Note
The Wazuh server and indexer API ports (55000 and 9200) should be accessible from the Shuffle cloud.
- A Shuffle SOAR Cloud (SaaS) account. You can also set up a self-hosted Shuffle Docker deployment.
- A Slack account with the following information:
- A channel to receive the generated report, for example,
wazuh-daily-reports - A Slack Bot User OAuth token to authenticate Shuffle and send the daily report
- A channel to receive the generated report, for example,
- A TheHive account with the following information:
- An API key to authenticate Shuffle and create a case
- A user account with the
org-adminrole to manage cases
- An Ubuntu 24.04 endpoint with the Wazuh agent 4.14.7 installed and enrolled in the Wazuh server. We use this endpoint to generate the events that the workflow evaluates.
Configuration
This section describes how to build the automated reporting workflow in Shuffle. The workflow runs on a daily schedule to query the Wazuh indexer and Wazuh server APIs for activity from the last 24 hours. It then scores each monitored endpoint against a set of escalation signals. Based on the results, the workflow branches as follows:
- Sends a formatted summary of the daily alerts to Slack.
- Creates a case in TheHive when a monitored endpoint crosses the escalation threshold.
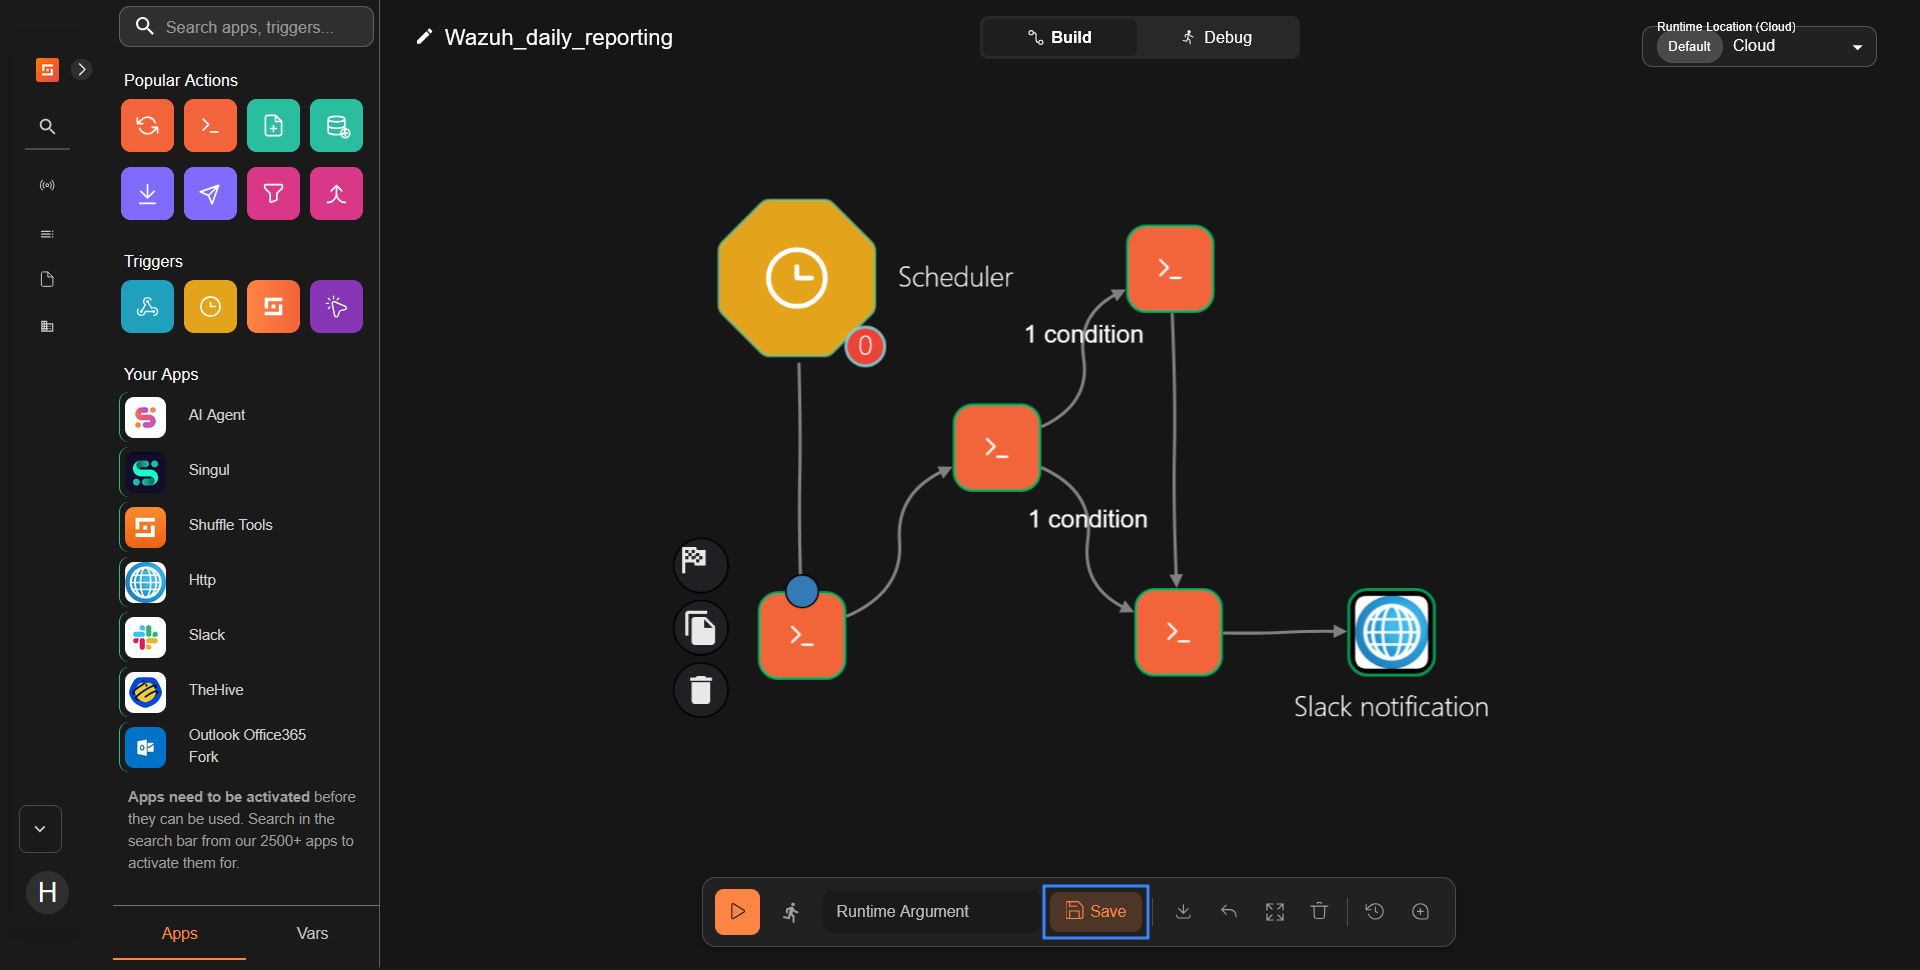
The workflow consists of the following Shuffle nodes:
- Scheduler: Triggers the workflow every day at 08:00 AM.
- Query_Wazuh_server_and_indexer_apis: Authenticates to the Wazuh indexer and Wazuh server APIs and runs the queries that collect the report data.
- Classify_by_monitored_endpoint: Scores each monitored endpoint against the escalation signals and decides which ones need a case.
- Create_TheHive_case: Creates a case in TheHive for each escalated endpoint only when the escalation condition is met.
- Slack_message_builder: Formats the full summary of the Wazuh alerts into a Slack message.
- Slack_notification: Posts the Wazuh alert summary to the configured Slack channel.
Create the scheduled workflow
Perform the following steps on the Shuffle platform to create the workflow.
| Warning: The scripts in this section are provided as a proof of concept (PoC). Review, test, and validate them to ensure they meet the operational and security requirements of your environment. |
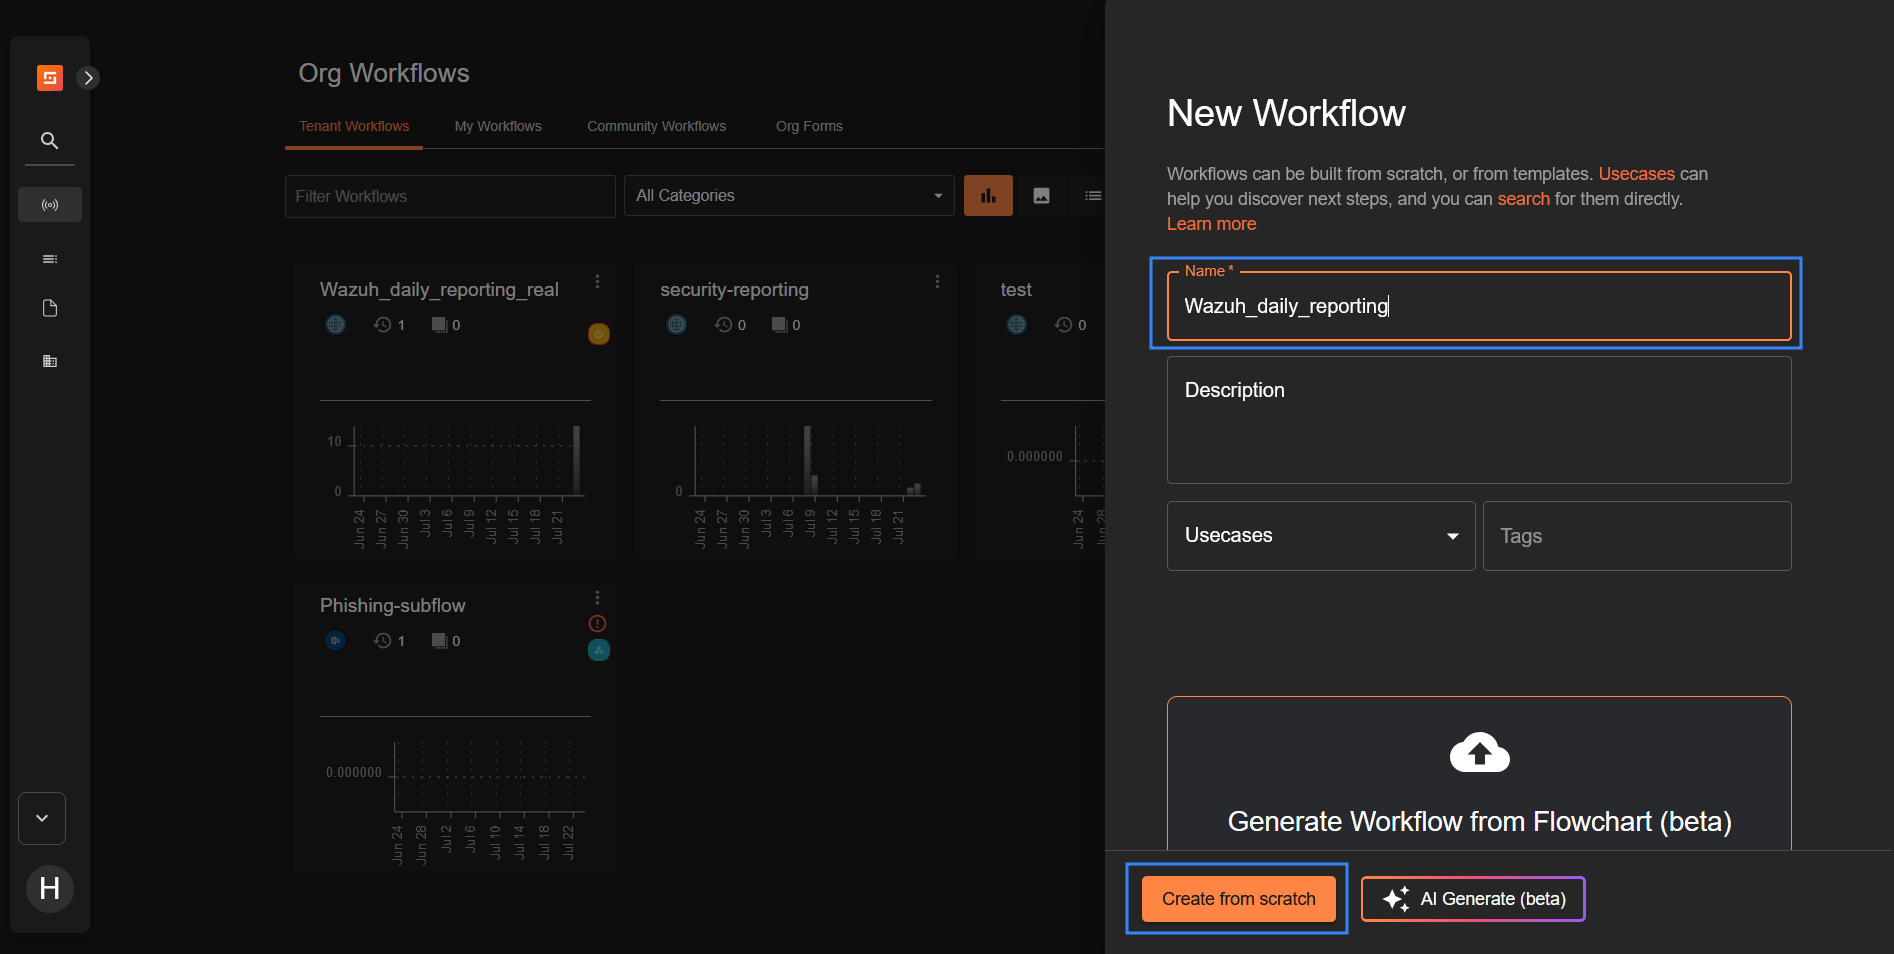
- Log in to Shuffle and navigate to Automate > Workflows, then click + Create Workflow. Name it
Wazuh_daily_reportingand click Create from scratch.
- Delete the default
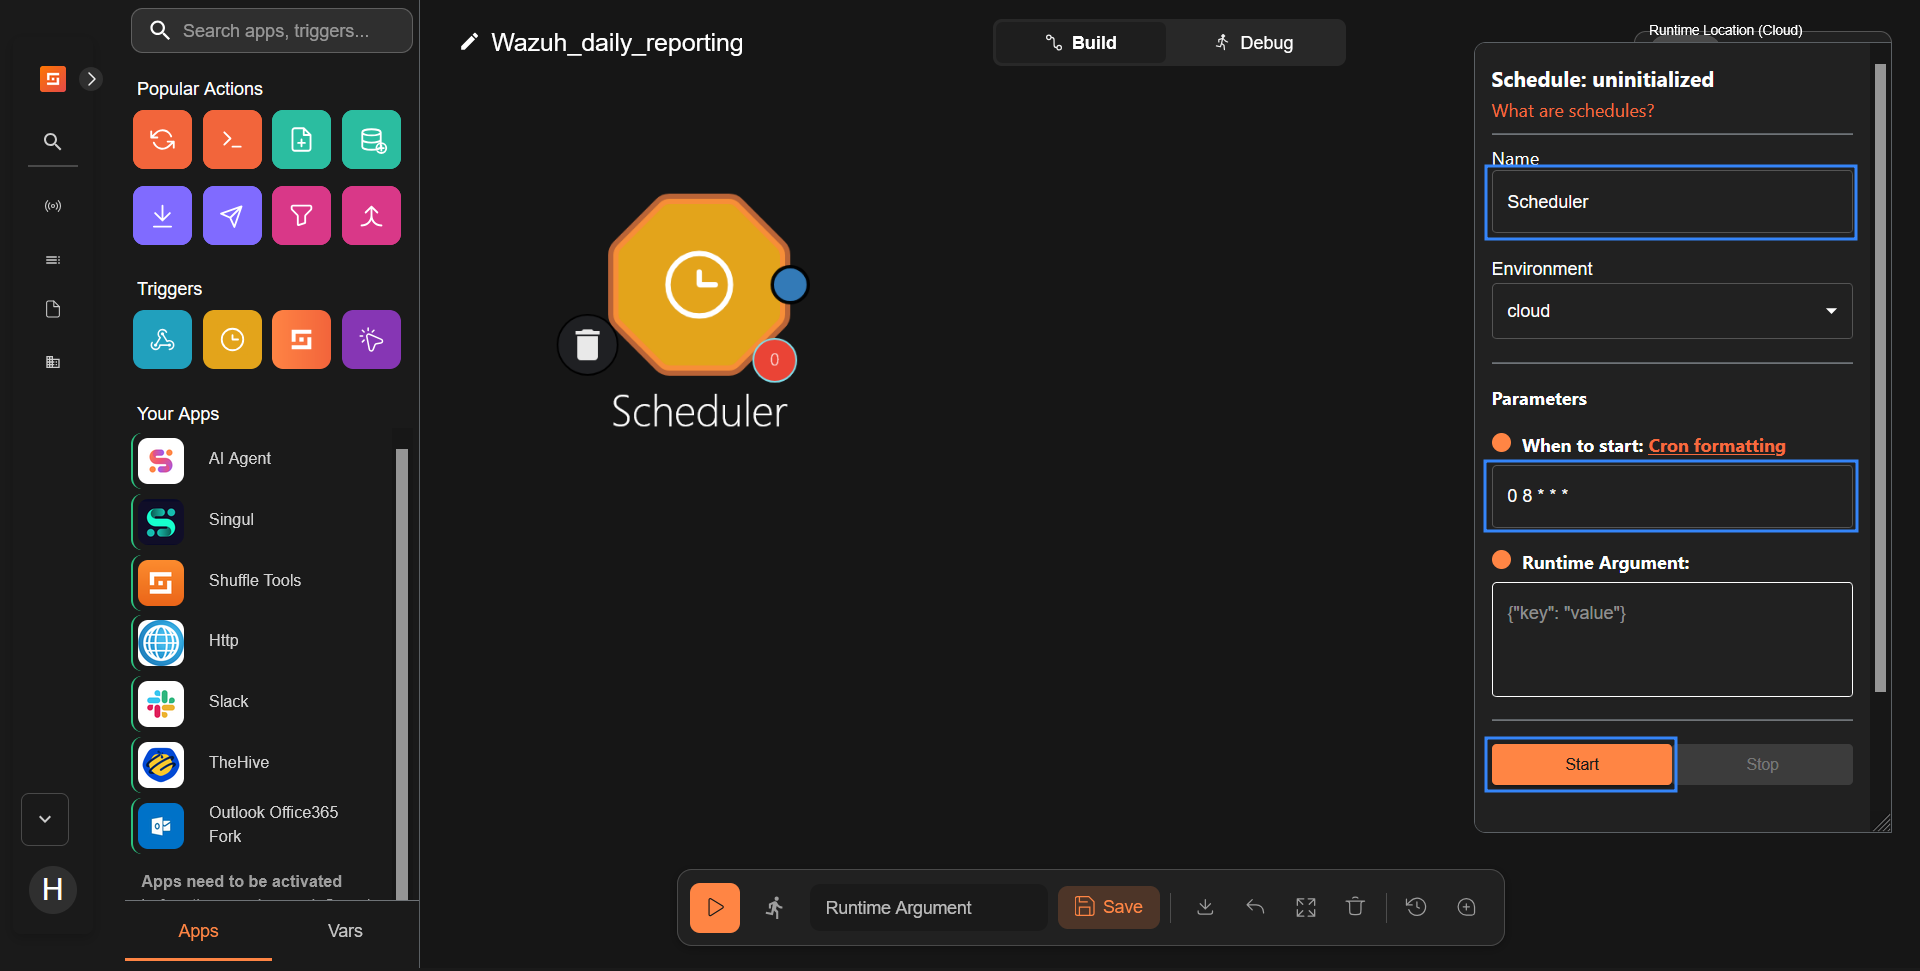
Change Menode. Drag a Schedule node onto the workflow canvas and rename it toScheduler. Set When to start to0 8 * * *to run every day at 08:00 AM, then click Start to enable it. You can adjust the cron expression to suit your reporting needs, for example,0 */4 * * *for every four hours.
- Drag an
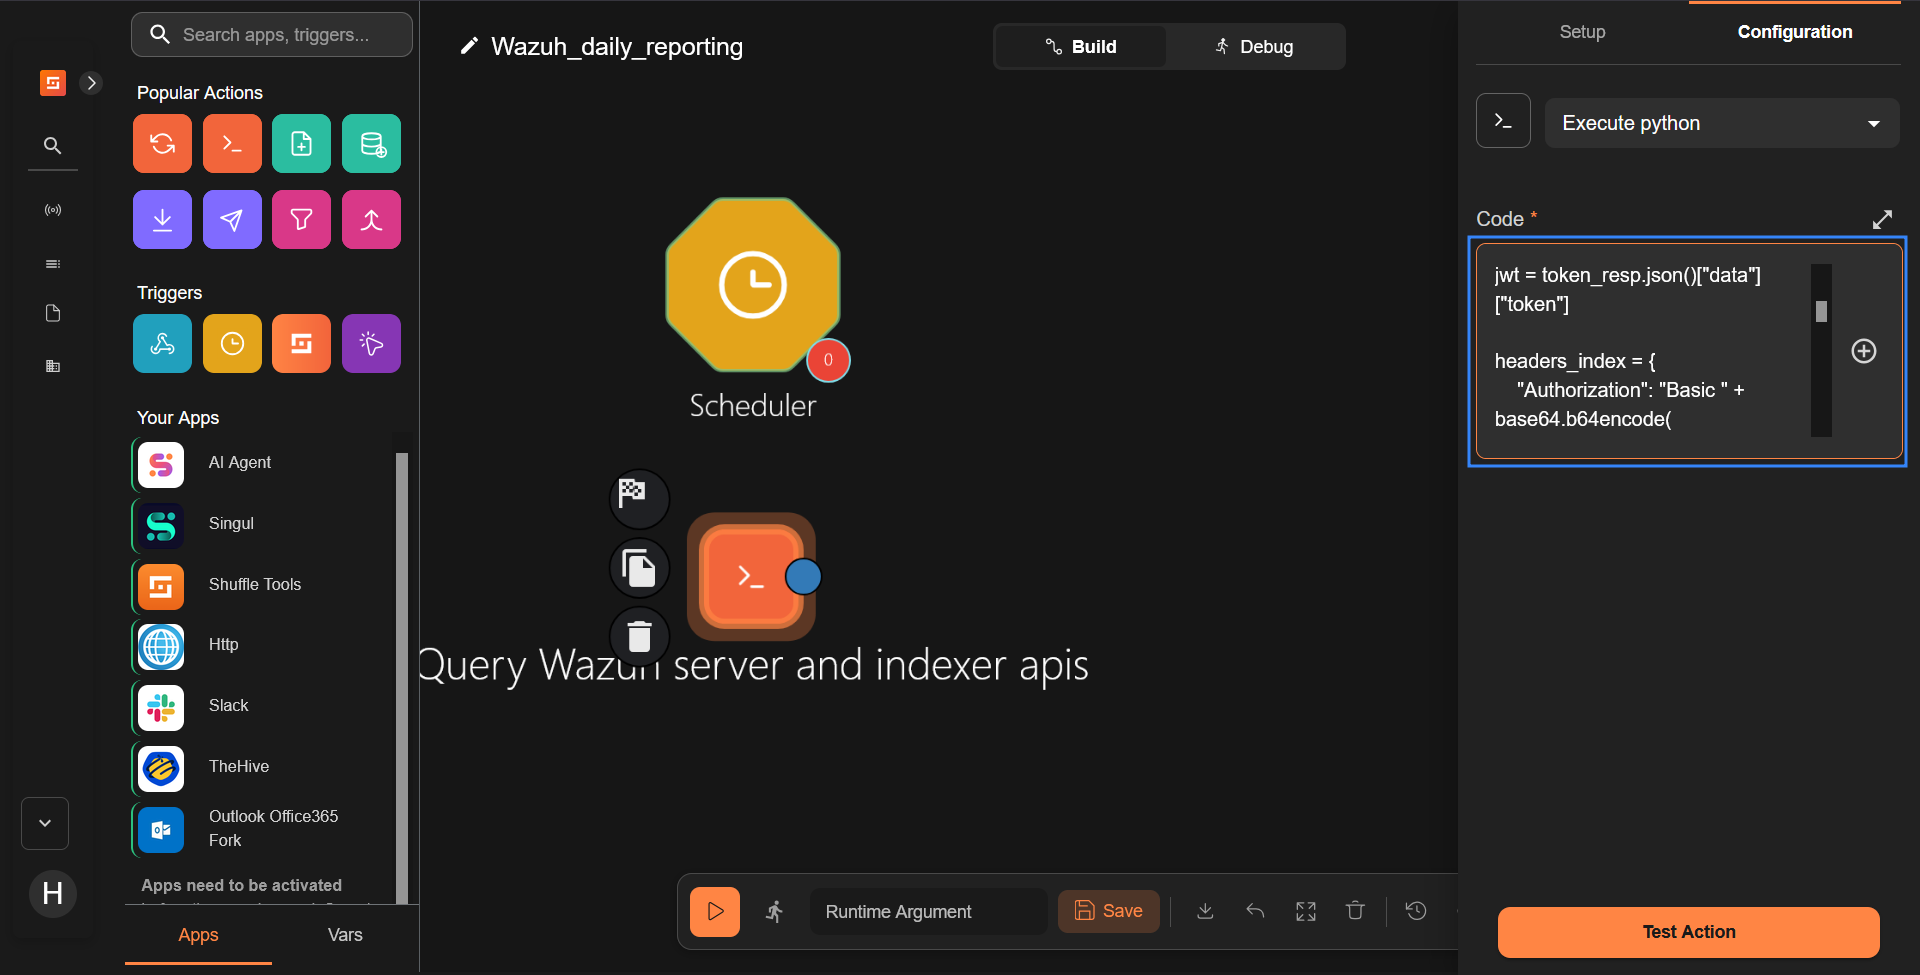
execute pythonnode from the Popular Actions section onto the workflow canvas and rename it toQuery_Wazuh_server_and_indexer_apis. Navigate to the Configuration tab, and add the code below in the Code section.
This node runs five searches against the Wazuh indexer in a single multi-search request, and one call to the Wazuh server API to list Wazuh agents that are no longer reporting. Each search gathers one piece of the report as noted in the script comments.
- Query 1: Alerts from the last 24 hours grouped per Wazuh agent, with a per-level breakdown for classification.
- Query 2: Level 7 and above aggregations for severity breakdown, top agents, top rule groups, and top rules.
- Query 3: Critical and high vulnerabilities grouped per agent.
- Query 4: Newly installed packages grouped per agent (dpkg, yum/dnf, and Windows MSIInstaller events).
- Query 5: Brute-force activity grouped by source IP address, with attempt counts.
Note
The verify=False setting in the script disables TLS certificate verification for testing purposes. In production, configure verify to use your trusted CA certificate instead.
Replace <WAZUH_SERVER_IP>, <WAZUH_INDEXER_IP>, <WAZUH_SERVER_USER>, <WAZUH_SERVER_PASS>, <WAZUH_INDEXER_USER>, and <WAZUH_INDEXER_PASS> with your own Wazuh server and indexer addresses and credentials.
import json, requests, base64

WAZUH_SERVER_URL   = "https://<WAZUH_SERVER_IP>:55000"
WAZUH_INDEXER_URL   = "https://<WAZUH_INDEXER_IP>:9200"
WAZUH_SERVER_USER  = "<WAZUH_SERVER_USER>"
WAZUH_SERVER_PASS  = "<WAZUH_SERVER_PASS>"
WAZUH_INDEXER_USER  = "<WAZUH_INDEXER_USER>"
WAZUH_INDEXER_PASS  = "<WAZUH_INDEXER_PASS>"

# Authenticate
token_resp = requests.post(
    f"{WAZUH_SERVER_URL}/security/user/authenticate",
    headers={
        "Authorization": "Basic " + base64.b64encode(
            f"{WAZUH_SERVER_USER}:{WAZUH_SERVER_PASS}".encode()
        ).decode()
    },
    verify=False
)
jwt = token_resp.json()["data"]["token"]

headers_index = {
    "Authorization": "Basic " + base64.b64encode(
        f"{WAZUH_INDEXER_USER}:{WAZUH_INDEXER_PASS}".encode()
    ).decode(),
    "Content-Type": "application/x-ndjson"
}

headers_api = {
    "Authorization": f"Bearer {jwt}",
    "Content-Type": "application/json"
}

# -- Wazuh indexer msearch (5 queries) —------------------------
body = (

    # Query 1 - alerts from the last 24 hours per agent (all levels, for classification)
    # Fetches the top 50 Wazuh agents
    '{}\n'
    '{"query":{"range":{"timestamp":{"gte":"now-24h"}}},"size":0,'
    '"aggs":{"by_agent":{"terms":{"field":"agent.name","size":50},'
    '"aggs":{"by_level":{"terms":{"field":"rule.level","size":20}},'
    '"max_level":{"max":{"field":"rule.level"}},'
    '"agent_id":{"terms":{"field":"agent.id","size":1}}}}}}\n'

    # Query 2 - level 7+ aggregations (severity, top agents, groups, rules)
    # Fetches the top 10 Wazuh agents
    '{}\n'
    '{"query":{"bool":{"must":['
    '{"range":{"timestamp":{"gte":"now-24h"}}},'
    '{"range":{"rule.level":{"gte":7}}}'
    ']}},"size":0,'
    '"aggs":{'
    '"by_severity":{"terms":{"field":"rule.level","size":20}},'
    '"top_agents":{"terms":{"field":"agent.name","size":10},'
    '"aggs":{"max_level":{"max":{"field":"rule.level"}}}},'
    '"top_groups":{"terms":{"field":"rule.groups","size":10}},'
    '"top_rules":{"terms":{"field":"rule.id","size":10},'
    '"aggs":{"rule_desc":{"terms":{"field":"rule.description","size":1}},'
    '"max_level":{"max":{"field":"rule.level"}}}}'
    '}}\n'

    # Query 3 - critical and high vulnerabilities grouped by agent
    '{}\n'
    '{"query":{"bool":{"must":['
    '{"range":{"timestamp":{"gte":"now-24h"}}},'
    '{"match":{"rule.groups":"vulnerability-detector"}},'
    '{"terms":{"data.vulnerability.severity":["Critical","High"]}}'
    ']}},"size":0,'
    '"aggs":{'
    '"by_agent":{"terms":{"field":"agent.name","size":50},'
    '"aggs":{'
    '"by_severity":{"terms":{"field":"data.vulnerability.severity","size":5}},'
    '"top_cves":{"terms":{"field":"data.vulnerability.cve","size":5}}'
    '}}'
    '}}\n'

    # Query 4 - new software/packages installed grouped by Wazuh agent
    # Rule 2902  = dpkg install (Debian/Ubuntu) - /var/log/dpkg.log
    # Rule 2932  = yum/dnf install (RHEL/Fedora) - /var/log/yum.log or dnf log
    # Rule 61138 = Windows MSIInstaller event
    '{}\n'
    '{"query":{"bool":{"must":['
    '{"range":{"timestamp":{"gte":"now-24h"}}},'
    '{"terms":{"rule.id":["2902","2932","61138"]}}'
    ']}},"size":0,'
    '"aggs":{'
    '"by_agent":{"terms":{"field":"agent.name","size":50},'
    '"aggs":{'
    '"by_rule":{"terms":{"field":"rule.id","size":3}},'
    '"linux_pkgs":{"terms":{"field":"data.package","size":10}},'
    '"win_products":{"terms":{"field":"data.win.eventdata.product","size":10}}'
    '}}'
    '}}\n'

    # Query 5 - brute-force activity grouped by source IP
    # Rule IDs cover SSH, RDP, and common auth failure patterns
    '{}\n'
    '{"query":{"bool":{"must":['
    '{"range":{"timestamp":{"gte":"now-24h"}}},'
    '{"terms":{"rule.id":["5551","5712","5503","5711","60204"]}}'
    ']}},"size":0,'
    '"aggs":{'
    '"by_srcip":{"terms":{"field":"data.srcip","size":20},'
    '"aggs":{'
    '"targeted_agents":{"terms":{"field":"agent.name","size":5}},'
    '"attack_types":{"terms":{"field":"rule.description","size":3}}'
    '}}'
    '}}\n'
)

msearch_resp = requests.post(
    f"{WAZUH_INDEXER_URL}/wazuh-alerts-*/_msearch",
    headers=headers_index,
    data=body,
    verify=False
)
responses = msearch_resp.json()['responses']

# -- Wazuh server API - Wazuh agents not reporting ------------
# Fetch agents with status disconnected or never_connected
agents_down_resp = requests.get(
    f"{WAZUH_SERVER_URL}/agents",
    headers=headers_api,
    params={
        "status": "disconnected,never_connected",
        "limit":  500,
        "select": "name,ip,status,lastKeepAlive,version,os.name"
    },
    verify=False
)
agents_down_raw = agents_down_resp.json().get('data', {}).get('affected_items', [])
agents_down = [
    {
        "name":      a.get('name', 'unknown'),
        "ip":        a.get('ip', 'unknown'),
        "status":    a.get('status', 'unknown'),
        "last_seen": a.get('lastKeepAlive', 'never'),
        "os":        a.get('os', {}).get('name', 'unknown'),
        "version":   a.get('version', 'unknown')
    }
    for a in agents_down_raw
]

print(json.dumps({
    "responses":   responses,
    "agents_down": agents_down
}))
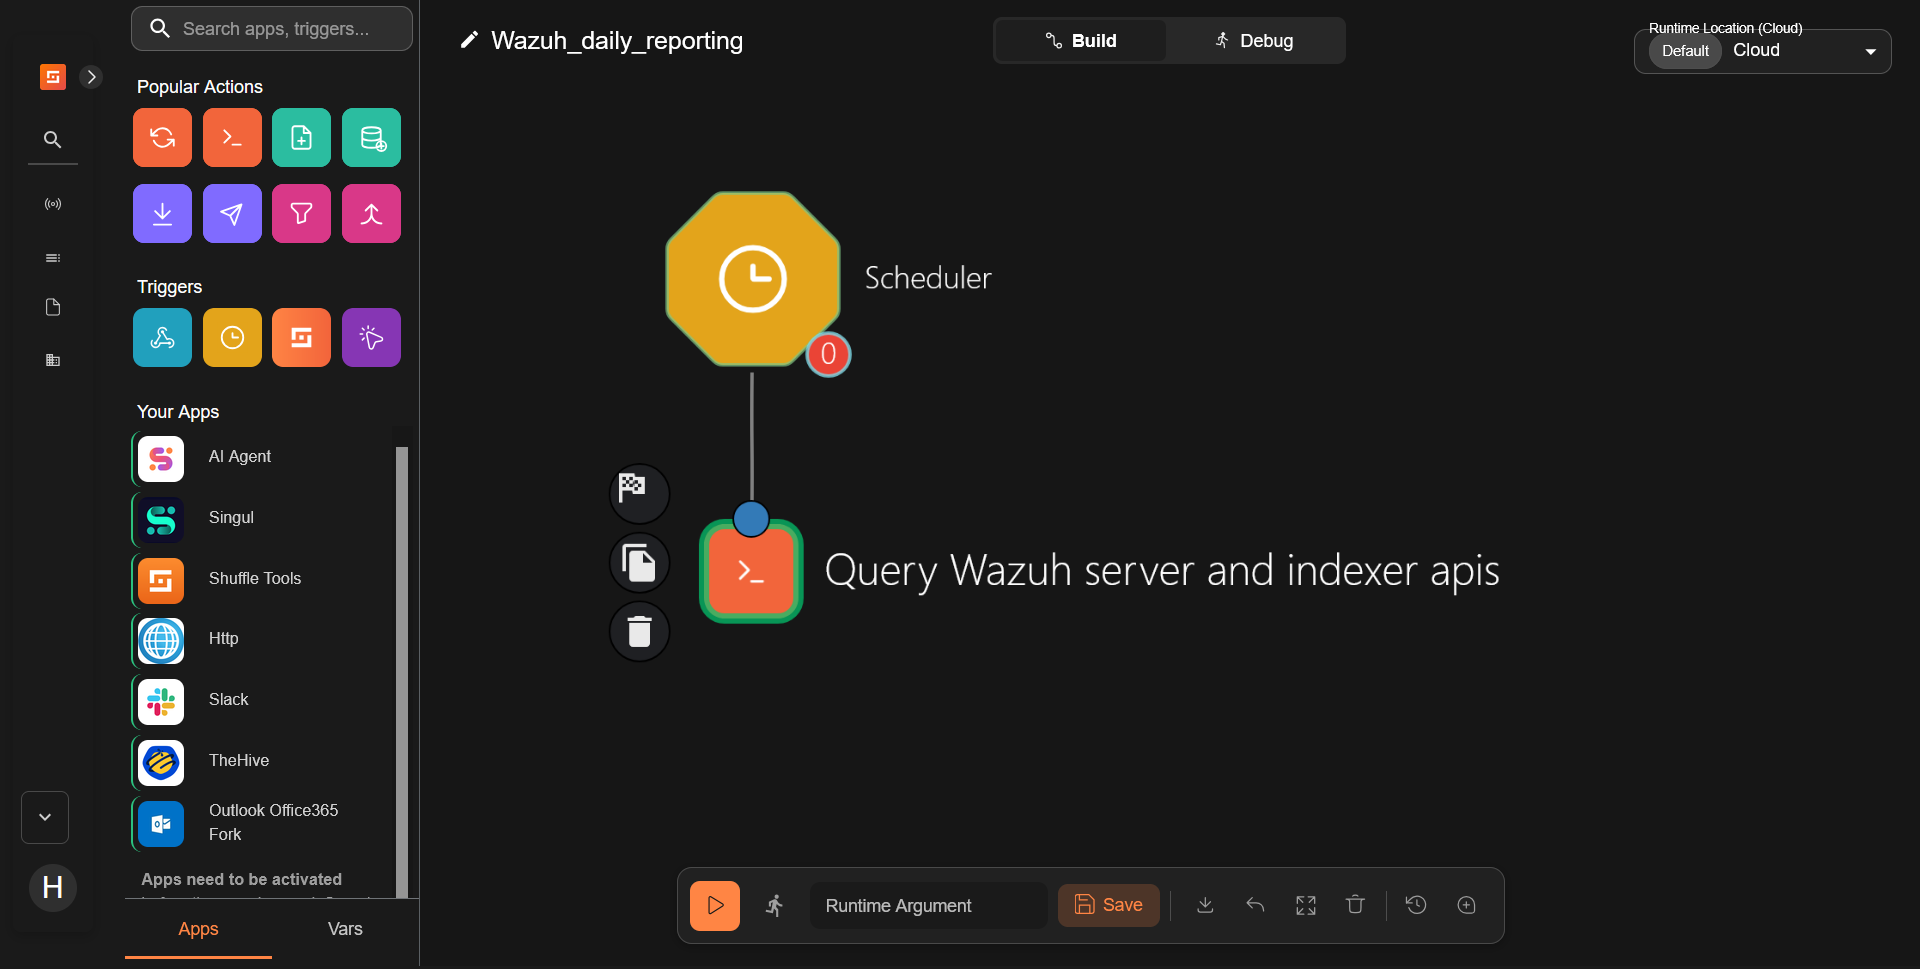
- Connect a branch from the
Schedulernode to theQuery_Wazuh_server_and_indexer_apisnode.
- Drag an
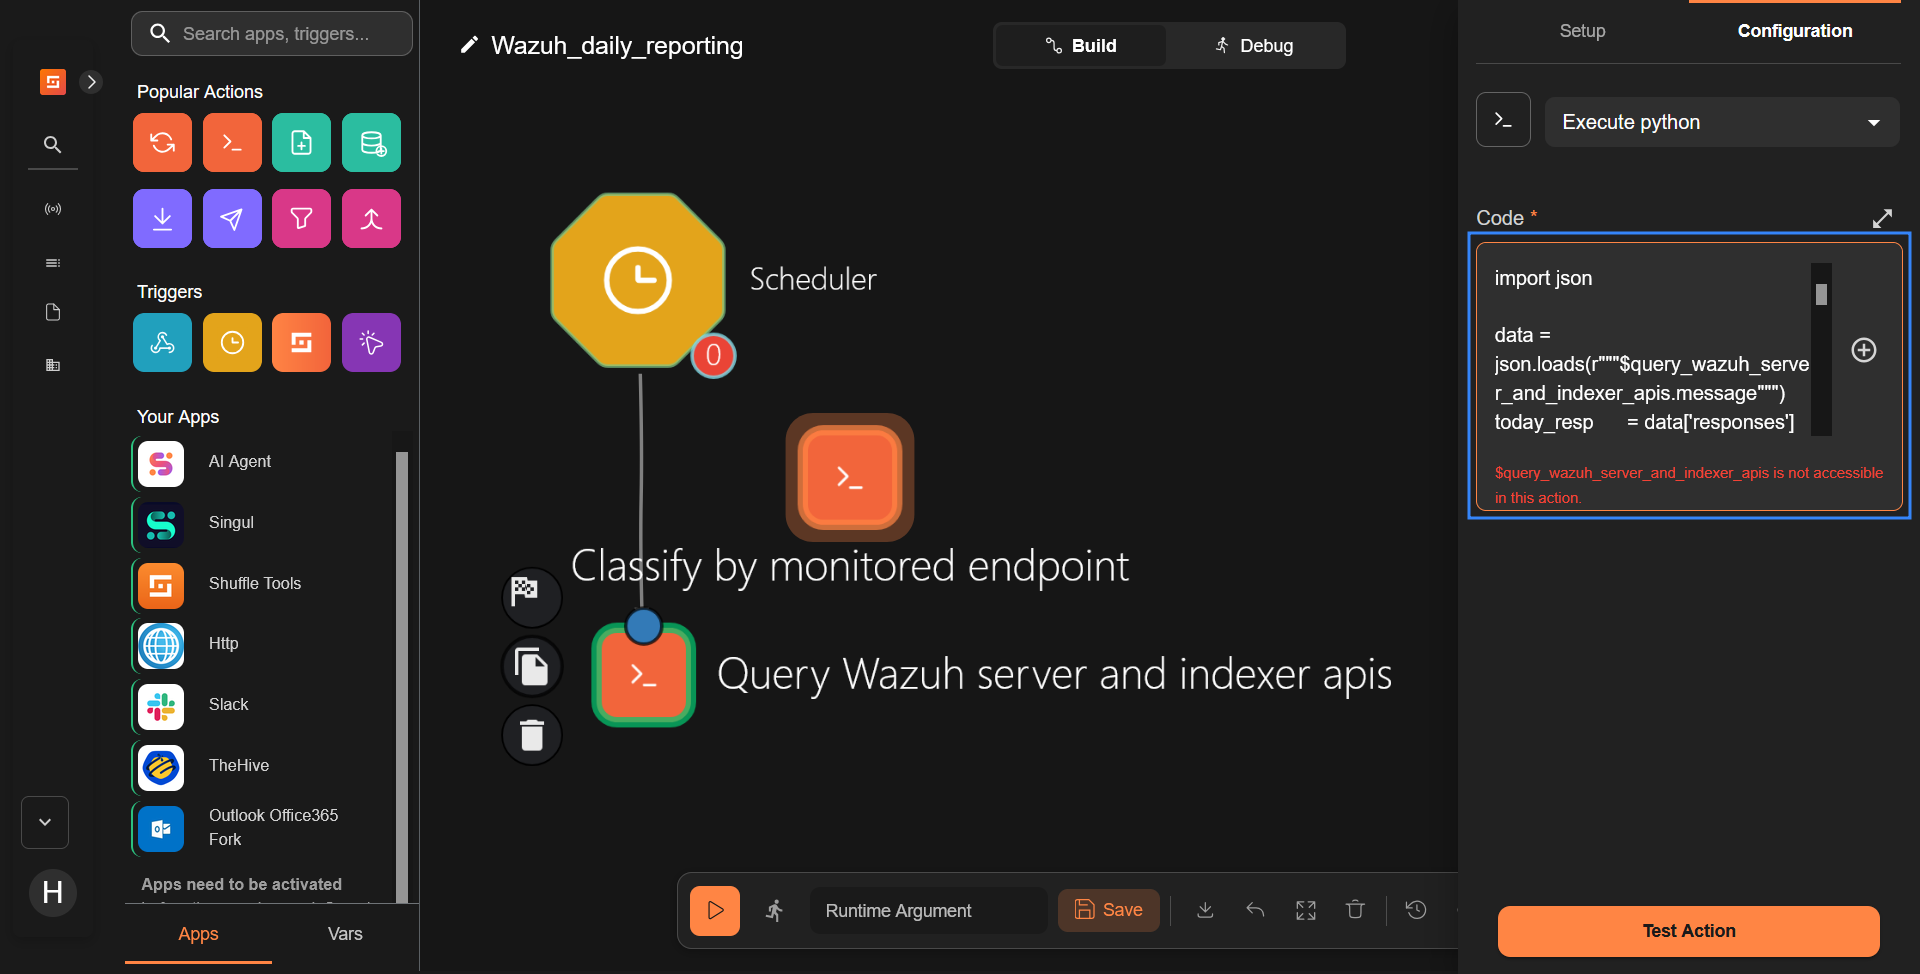
execute pythonnode from the Popular Actions section onto the workflow canvas and rename it toClassify_by_monitored_endpoint. Navigate to the Configuration tab, and add the code below in the Code section.
This node reads the raw query results from the Query_Wazuh_server_and_indexer_apis node and turns them into a scored summary. It reshapes the vulnerability, software, and brute-force data into per-agent structures, then runs a scoring function against every monitored endpoint. Each independent signal adds points, so an endpoint that shows several problems at once rises to the top. The key output field is any_escalation, which the workflow uses to decide whether to open cases in TheHive.
The scoring works as follows:
| Escalation signals | Scoring points | Meaning |
| Level 15+ alerts | +3 | Maximum Wazuh severity. This always escalates. |
| Level 12 to 14 alerts | +2 | High-severity alert on the monitored endpoint. |
| Critical CVE on an alerting endpoint with level 10+ alerts | +2 | Vulnerable and generating activity at the same time. |
| Brute-force targeting the monitored endpoint | +2 | More than two attempts from one or more source IP addresses. |
| High CVE with level 10+ alerts | +1 | Corroborating signal |
| Unexpected software install with level 10+ alert | +1 | New package on an alerting endpoint. |
A monitored endpoint with a total score of 2 or higher gets a case in TheHive. A score of 2 is assigned medium priority. A score of 3 or 4 is assigned high priority, and a score of 5 or higher is assigned critical priority. You can adjust these thresholds in the scoring function to match the level of noise in your environment.
import json

data = json.loads(r"""$query_wazuh_server_and_indexer_apis.message""")
today_resp      = data['responses'][0]
stats_resp      = data['responses'][1]
vuln_resp       = data['responses'][2]
software_resp   = data['responses'][3]
bruteforce_resp = data['responses'][4]
agents_down     = data['agents_down']

# -- Reshape supporting data ---------------------------------
vulns_by_agent = {}
for b in vuln_resp['aggregations']['by_agent']['buckets']:
    sev_counts = {s['key']: s['doc_count'] for s in b['by_severity']['buckets']}
    vulns_by_agent[b['key']] = {
        "total":    b['doc_count'],
        "critical": sev_counts.get('Critical', 0),
        "high":     sev_counts.get('High', 0),
        "top_cves": [c['key'] for c in b['top_cves']['buckets']]
    }

software_by_agent = {}
for b in software_resp['aggregations']['by_agent']['buckets']:

    linux = [p['key'] for p in b.get('linux_pkgs', {}).get('buckets', [])]
    win   = [p['key'] for p in b.get('win_products', {}).get('buckets', [])]

    rule_breakdown = {
        r['key']: r['doc_count']
        for r in b.get('by_rule', {}).get('buckets', [])
    }

    # Tag Linux packages by their source rule if identifiable
    packages = (
        [f"{p} (linux)" for p in linux] +
        [f"{p} (msi)"   for p in win]
    )

    software_by_agent[b['key']] = {
        "total":    b['doc_count'],
        "packages": packages[:10],
        "by_rule":  rule_breakdown
    }

bruteforce = []
for b in bruteforce_resp['aggregations']['by_srcip']['buckets']:
    bruteforce.append({
        "src_ip":          b['key'],
        "attempts":        b['doc_count'],
        "targeted_agents": [a['key'] for a in b['targeted_agents']['buckets']],
        "attack_types":    [t['key'] for t in b['attack_types']['buckets']]
    })

# -- Correlation scoring function --------------------------
# Each independent signal adds to the score.
# Score >= 2 creates a TheHive case.
# Score >= 3 = high priority. Score >= 5 = critical priority.
def escalation_score(agent_name, agent_info, vulns, software, bruteforce_list):
    score   = 0
    reasons = []

    # Alert severity signals
    if agent_info['max_level'] >= 15:
        score += 3
        reasons.append("level 15 alert (maximum severity)")
    elif agent_info['max_level'] >= 12:
        score += 2
        reasons.append(f"level {agent_info['max_level']} alert")

    # Critical vulnerability on an actively alerting endpoint
    v = vulns.get(agent_name, {})
    if v.get('critical', 0) > 0 and agent_info['max_level'] >= 10:
        score += 2
        reasons.append(
            f"{v['critical']} critical CVE(s) on active endpoint"
        )
    elif v.get('high', 0) > 0 and agent_info['max_level'] >= 10:
        score += 1
        reasons.append(f"{v['high']} high CVE(s) with level 10+ alert")

    # Unexpected software install on an alerting endpoint
    if agent_name in software and agent_info['max_level'] >= 10:
        score += 1
        reasons.append(
            f"unexpected software install ({software[agent_name]['total']} change(s))"
        )

    # Brute-force targeting this specific endpoint
    bf_targeting = [
        b for b in bruteforce_list
        if agent_name in b['targeted_agents'] and b['attempts'] > 2
    ]
    if bf_targeting:
        total_bf = sum(b['attempts'] for b in bf_targeting)
        score += 2
        reasons.append(
            f"brute-force from {len(bf_targeting)} source IP(s) ({total_bf} attempts)"
        )

    return score, reasons

# -- Classify and score every Wazuh agent -------------------------
agents = []
for bucket in today_resp['aggregations']['by_agent']['buckets']:
    name      = bucket['key']
    count     = bucket['doc_count']
    max_level = int(bucket['max_level']['value'] or 0)
    id_buckets = bucket.get("agent_id", {}).get("buckets", [])
    agent_id   = id_buckets[0]["key"] if id_buckets else ""
    level_counts = {
        str(int(b['key'])): b['doc_count']
        for b in bucket['by_level']['buckets']
    }

    if max_level >= 15:
        classification = "critical"
    elif max_level >= 12 and count > 100:
        classification = "high"
    elif max_level >= 12:
        classification = "medium"
    else:
        classification = "normal"

    agent_info = {
        "agent":          name,
        "agent_id": agent_id,
        "count":          count,
        "max_level":      max_level,
        "level_counts":   level_counts,
        "classification": classification
    }

    score, reasons = escalation_score(
        name, agent_info,
        vulns_by_agent, software_by_agent,
        bruteforce
    )

    agent_info['escalation_score']   = score
    agent_info['escalation_reasons'] = reasons
    agent_info['needs_ticket']       = score >= 2
    agent_info['priority']           = (
        "critical" if score >= 5 else
        "high"     if score >= 3 else
        "medium"
    )
    agents.append(agent_info)

print(json.dumps({
    "agents":            agents,
    "agents_down":       agents_down,
    "any_escalation":    any(a['needs_ticket'] for a in agents),
    "stats":             stats_resp['aggregations'],
    "vulns_by_agent":    vulns_by_agent,
    "software_by_agent": software_by_agent,
    "bruteforce":        bruteforce
}))
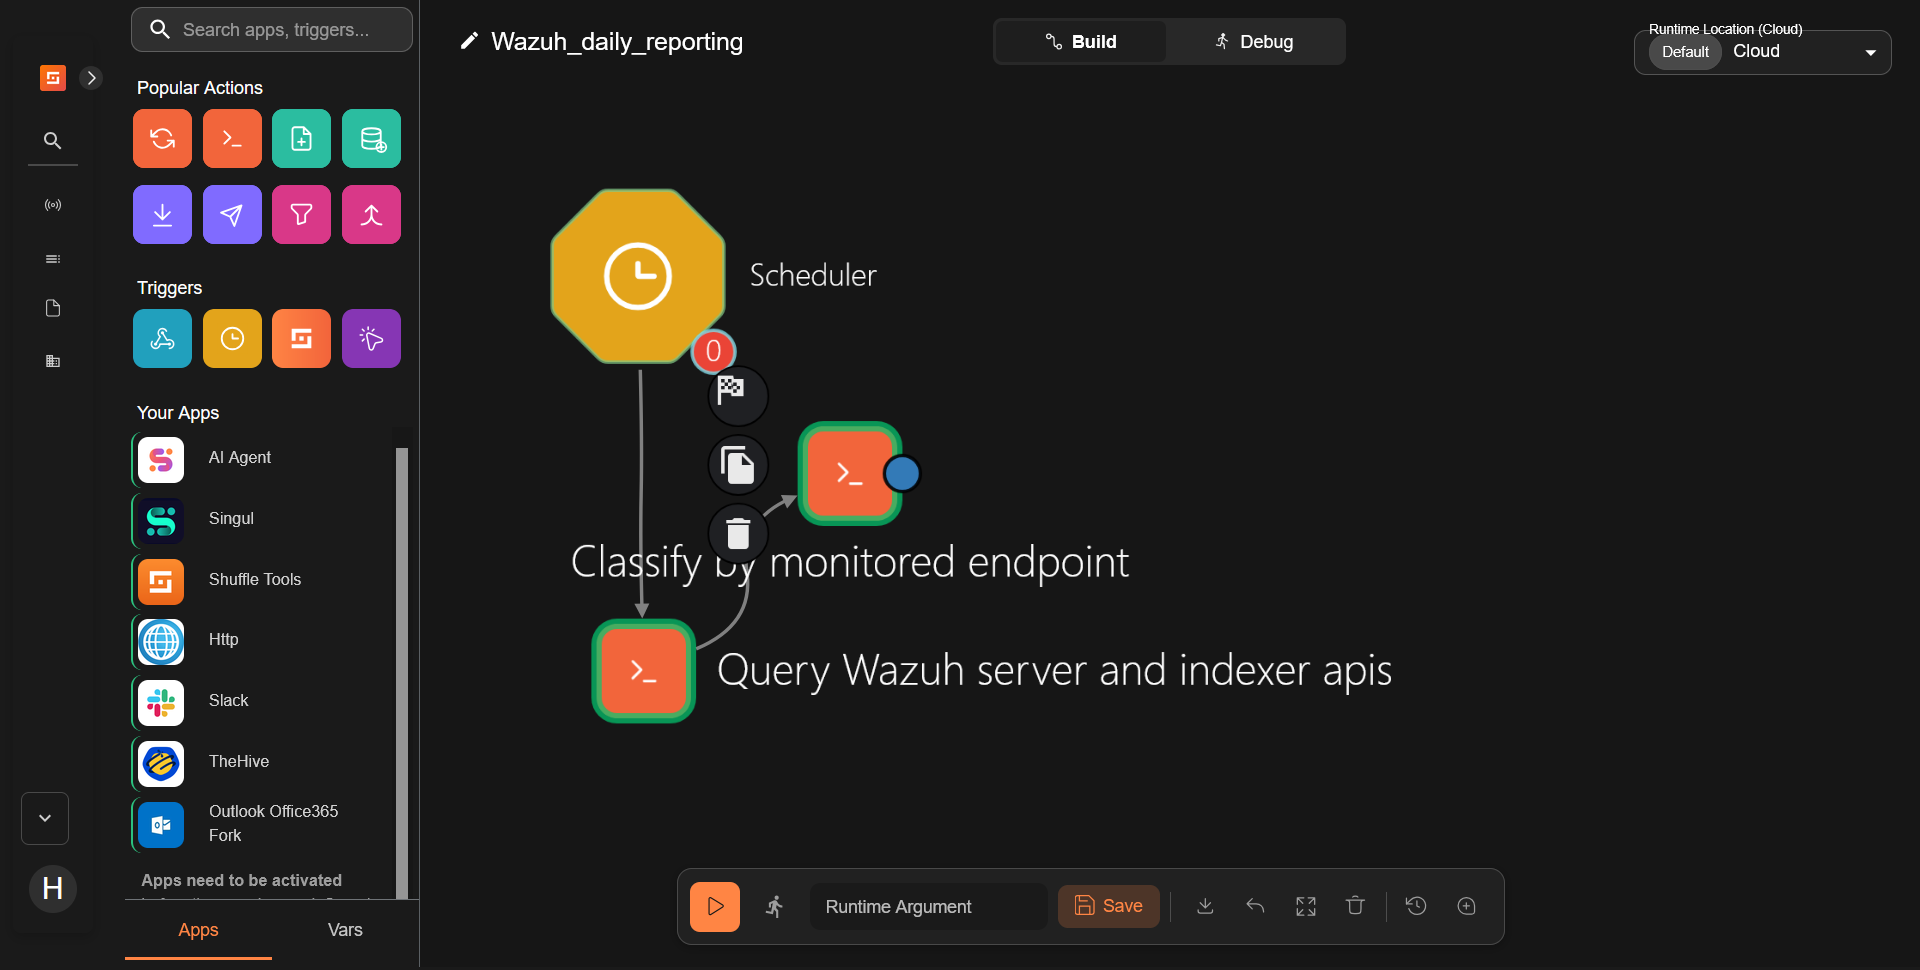
- Connect a branch from the
Query_Wazuh_server_and_indexer_apisnode to theClassify_by_monitored_endpointnode.
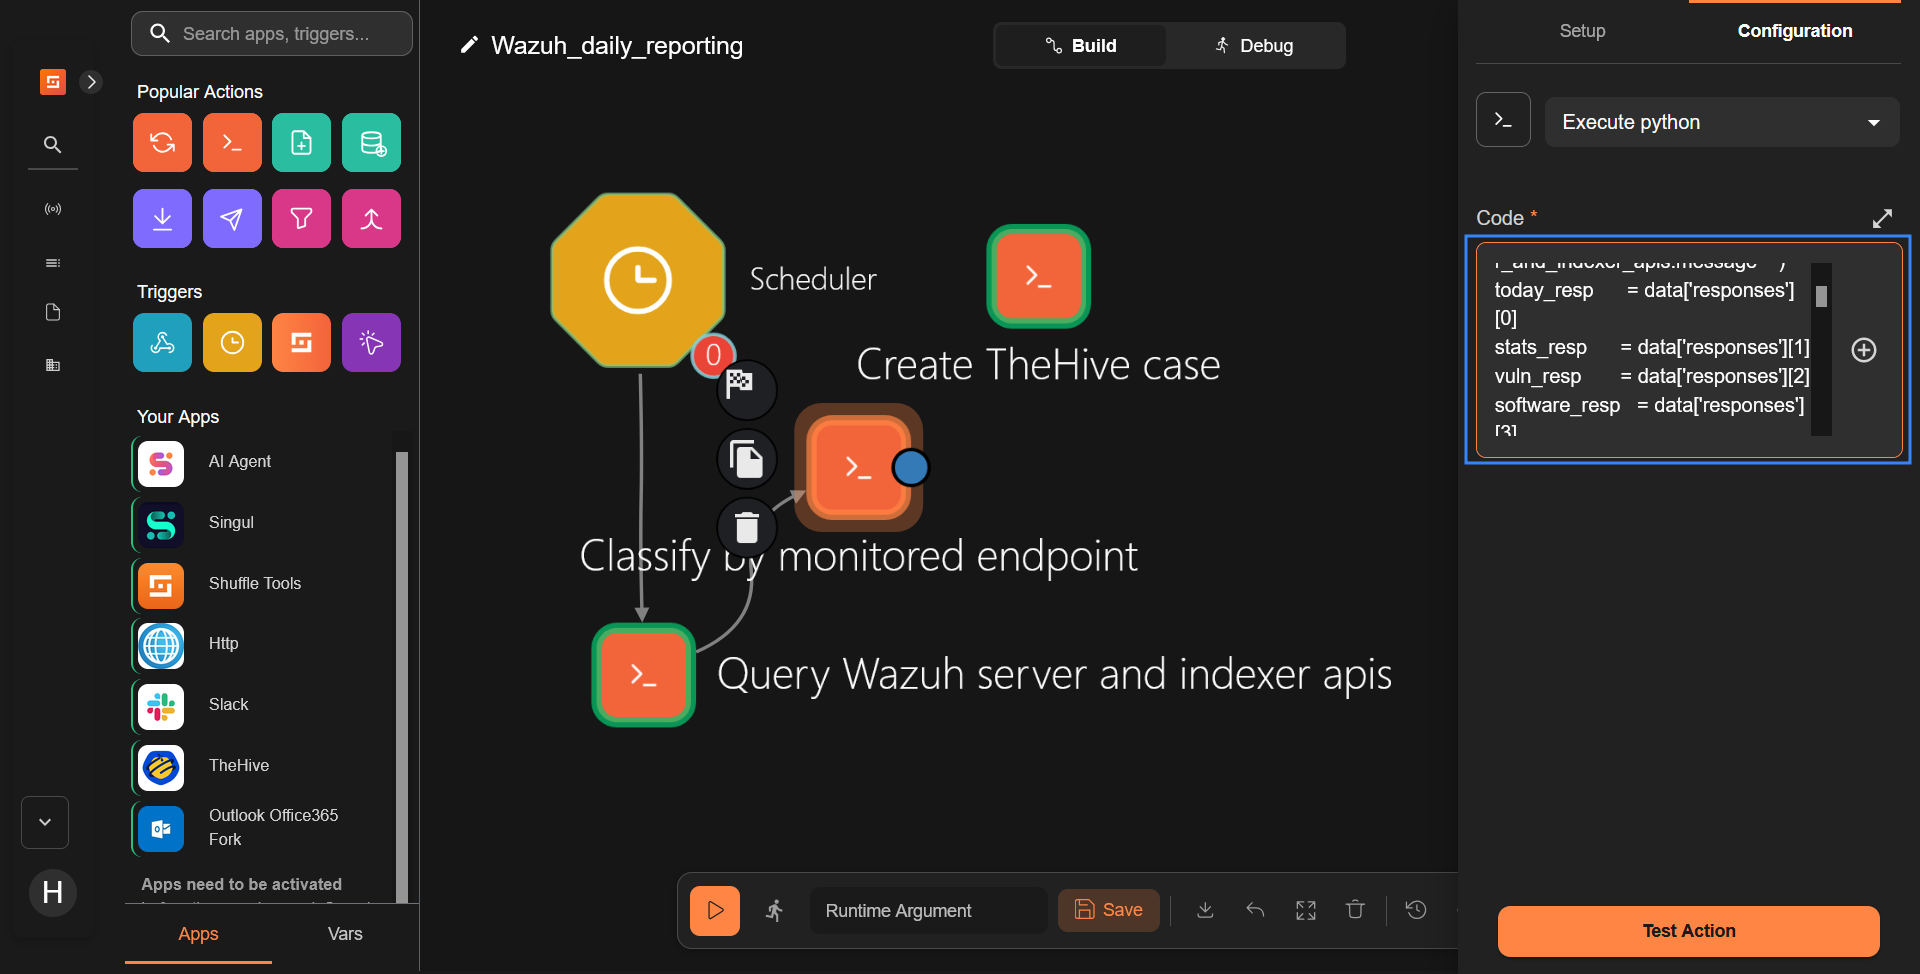
- Drag an
execute pythonnode from the Popular Actions section onto the workflow canvas and rename it toCreate_TheHive_case. Navigate to the Configuration tab, and add the code below in the Code section.
This node processes the scored data and opens a TheHive case for each monitored endpoint that requires one. Rather than pasting raw alert output into the case, it writes a short briefing: the escalation summary, the signals that triggered it, and a direct link back to the Wazuh dashboard filtered to that Wazuh agent. It also attaches the relevant indicators of compromise (IOCs), such as brute-force source IP addresses and vulnerable CVEs, as TheHive observables so analysts can enrich them in a single step. Tasks are added only when applicable. For example, a case created for a brute-force event does not include an unrelated patching task.
Replace <THEHIVE_URL>, <THEHIVE_API_KEY>, and <WAZUH_DASHBOARD_IP> with your own TheHive address and credentials, and Wazuh dashboard address.
import json, requests

classify_data = json.loads(r"""$classify_by_monitored_endpoint.message""")

THEHIVE_URL     = "<THEHIVE_URL>"
THEHIVE_API_KEY = "<THEHIVE_API_KEY>"
WAZUH_DASHBOARD_URL = "https://<WAZUH_DASHBOARD_IP>"

headers = {
    "Authorization": f"Bearer {THEHIVE_API_KEY}",
    "Content-Type":  "application/json"
}

# TheHive severity: 1=low, 2=medium, 3=high, 4=critical
priority_to_severity = {
    "critical": 4,
    "high":     3,
    "medium":   2
}

created_cases = []

for agent_info in classify_data['agents']:
    if not agent_info['needs_ticket']:
        continue

    agent    = agent_info['agent']
    reasons  = agent_info['escalation_reasons']
    score    = agent_info['escalation_score']
    priority = agent_info['priority']

    # -- Vulnerability block ------------------------------
    vuln_info = classify_data.get('vulns_by_agent', {}).get(agent, {})
    vuln_text = ""
    if vuln_info:
        cves     = ", ".join(vuln_info.get('top_cves', [])[:5]) or "none listed"
        vuln_text = (
            f"\n\n## Vulnerability context\n\n"
            f"| Severity | Count |\n"
            f"|---|---|\n"
            f"| Critical | {vuln_info.get('critical', 0)} |\n"
            f"| High | {vuln_info.get('high', 0)} |\n\n"
            f"**Top CVEs:** {cves}"
        )

    # -- Software install block ----------------------------
    sw_info  = classify_data.get('software_by_agent', {}).get(agent, {})
    sw_text  = ""
    if sw_info:
        pkgs    = "\n".join(
            f"- `{p}`" for p in sw_info.get('packages', [])[:10]
        )
        sw_text = (
            f"\n\n## New software installs ({sw_info.get('total', 0)} changes)\n\n"
            f"{pkgs}"
        )

    # -- Brute-force block ---------------------------------
    bf_targeting = [
        b for b in classify_data.get('bruteforce', [])
        if agent in b['targeted_agents']
    ]
    bf_text = ""
    if bf_targeting:
        bf_lines = "\n".join(
            f"| `{b['src_ip']}` | {b['attempts']} | "
            f"{b['attack_types'][0][:40] if b['attack_types'] else 'unknown'} |"
            for b in sorted(bf_targeting, key=lambda x: x['attempts'], reverse=True)
        )
        bf_text = (
            f"\n\n## Brute-force activity\n\n"
            f"| Source IP | Attempts | Type |\n"
            f"|---|---|---|\n"
            f"{bf_lines}"
        )

    # -- IOC list for observables ----------------------------
    observables = []
    for b in bf_targeting:
        observables.append({
            "dataType": "ip",
            "data":     b['src_ip'],
            "message":  f"Brute-force source - {b['attempts']} attempts against {agent}",
            "tags":     ["brute-force", "automated", "wazuh"]
        })
    for cve in vuln_info.get('top_cves', [])[:5]:
        observables.append({
            "dataType": "other",
            "data":     cve,
            "message":  f"Vulnerable CVE detected on {agent}",
            "tags":     ["vulnerability", "automated", "wazuh"]
        })

    # -- Wazuh deep link ------------------------------------
    wazuh_link = (
        f"{WAZUH_DASHBOARD_URL}/app/threat-hunting#/overview/?tab=general&tabView=events&_a=(filters:!(),query:(language:kuery,query:''))&_g=(filters:!(),refreshInterval:(pause:!t,value:0),time:(from:now-24h,to:now))&agentId={agent_info['agent_id']}"
    )

    # -- Build case description -----------------------------
    reasons_text = "\n".join(f"- {r}" for r in reasons)

    description = (
        f"## Escalation summary\n\n"
        f"**Agent:** {agent}\n"
        f"**Score:** {score}\n"
        f"**Priority:** {priority}\n\n"
        f"## Signals that triggered escalation\n\n"
        f"{reasons_text}\n\n"
        f"## Investigate in Wazuh\n\n"
        f"[Open agent alerts in Wazuh dashboard]({wazuh_link})"
        f"{vuln_text}"
        f"{sw_text}"
        f"{bf_text}"
    )

    # -- Tasks (only relevant ones) --------------------------
    tasks = [
        {"title": "Review agent alerts in Wazuh dashboard", "status": "Waiting"},
        {"title": "Determine if active threat or false positive", "status": "Waiting"}
    ]
    if vuln_info:
        tasks.append({
            "title":  "Check CVE patch availability and apply",
            "status": "Waiting"
        })
    if sw_info:
        tasks.append({
            "title":  "Verify software installs are authorized",
            "status": "Waiting"
        })
    if bf_targeting:
        tasks.append({
            "title":  "Block brute-force source IPs at firewall",
            "status": "Waiting"
        })
    if vuln_info or bf_targeting:
        tasks.append({
            "title":  "Enrich IOC observables via Cortex",
            "status": "Waiting"
        })

    # -- Create case ----------------------------------------
    case_resp = requests.post(
        f"{THEHIVE_URL}/api/v1/case",
        headers=headers,
        json={
            "title":       (
                f"[Score {score}] Wazuh: {agent} - "
                f"{', '.join(reasons[:2])}"
            ),
            "severity":    priority_to_severity.get(priority, 2),
            "tags":        ["wazuh", "automated", agent, priority],
            "description": description,
            "tasks":       tasks
        }
    )
    case = case_resp.json()
    case_id = case.get('_id', 'unknown')

    # -- Attach observables --------------------------------
    for obs in observables:
        requests.post(
            f"{THEHIVE_URL}/api/v1/case/{case_id}/observable",
            headers=headers,
            json=obs
        )

    created_cases.append({
        "agent":       agent,
        "case_id":     case_id,
        "case_number": case.get('number', '?'),
        "priority":    priority,
        "score":       score,
        "url":         f"{THEHIVE_URL}/cases/{case_id}/details"
    })

print(json.dumps({"cases": created_cases}))
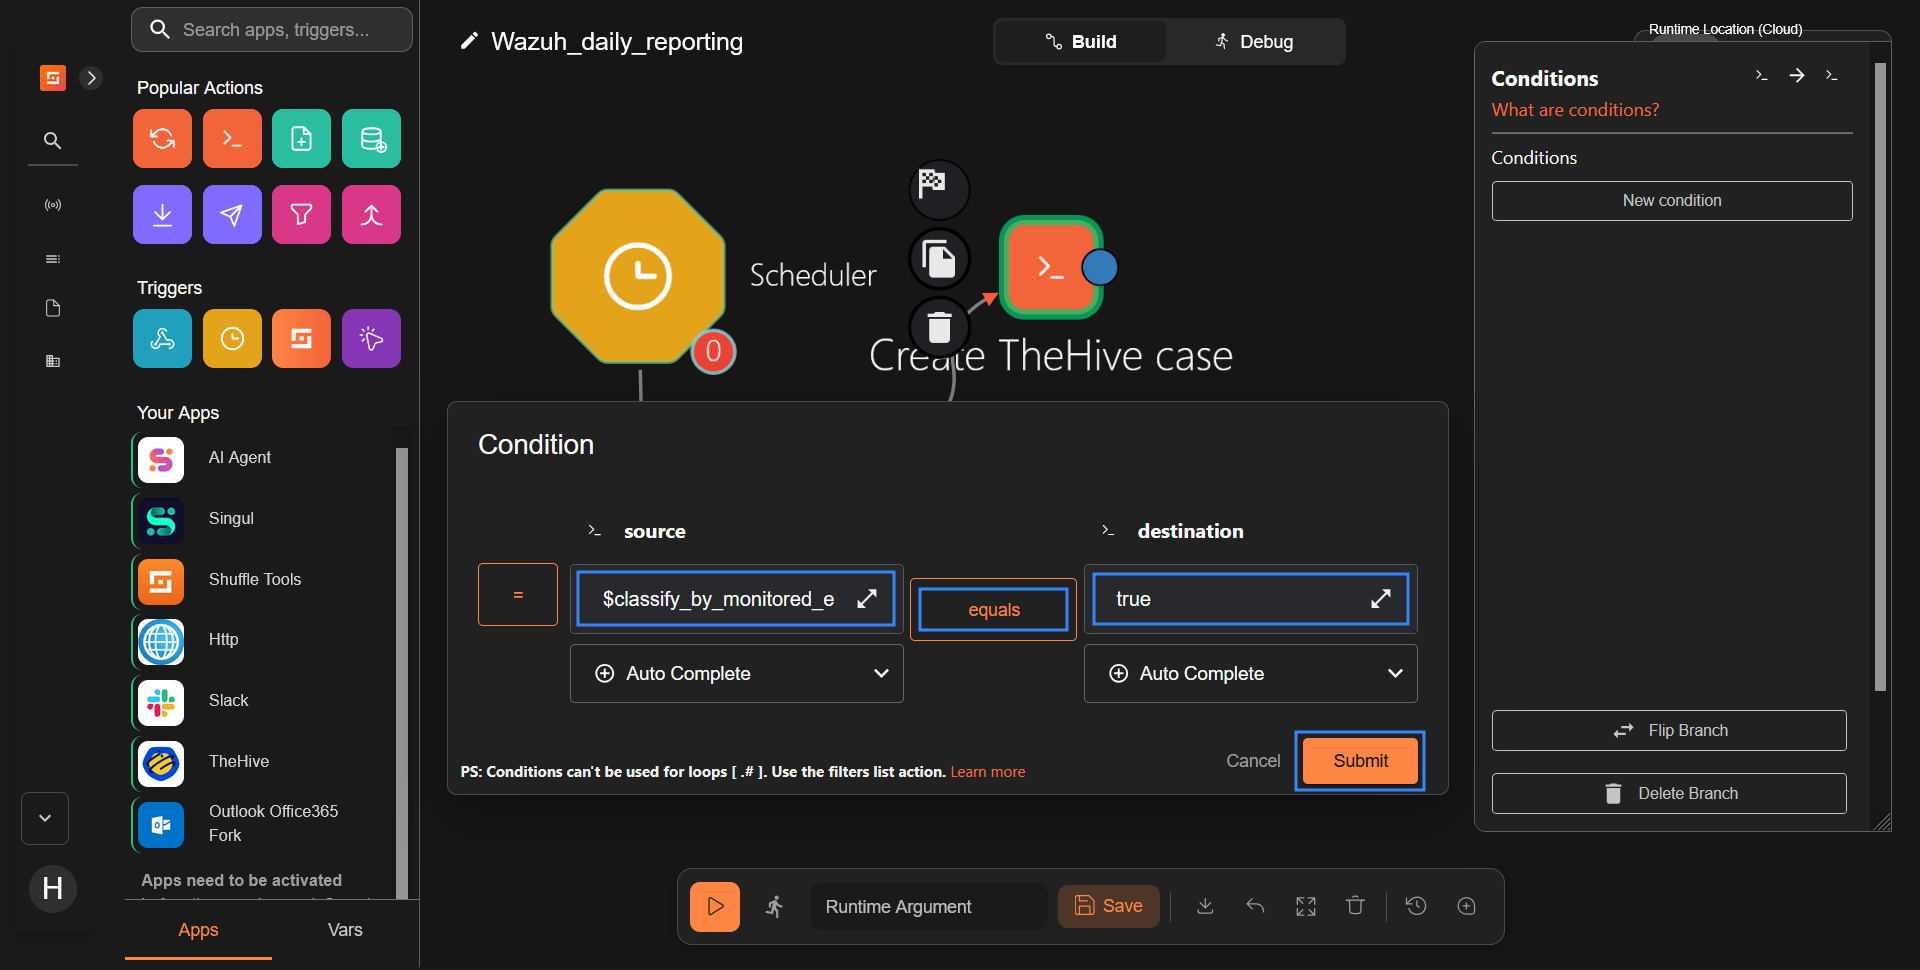
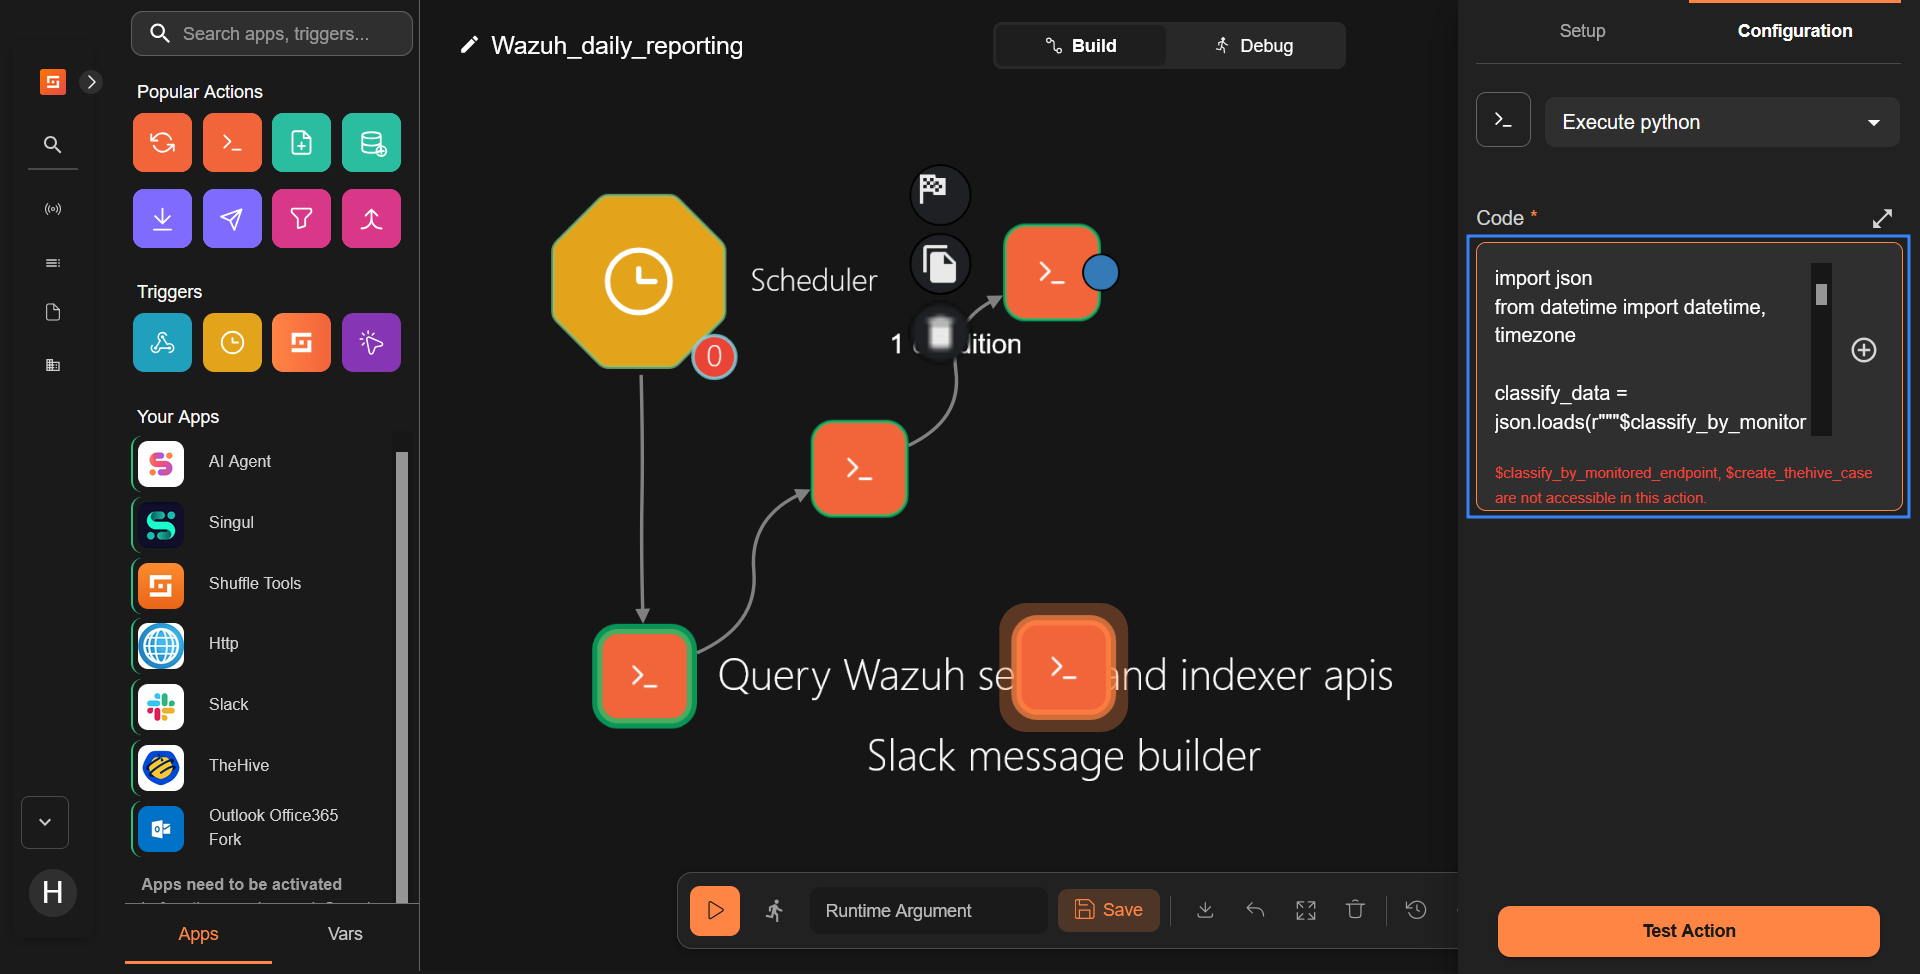
- Connect a branch from the
Classify_by_monitored_endpointnode to theCreate_TheHive_casenode, then click it and choose New condition. Configure it as follows, so this node runs only when at least one monitored endpoint escalates:
$classify_by_monitored_endpoint.message.any_escalationin the source fieldequalsin the middle fieldtruein the destination field- Click Submit to save the condition
- Drag an
execute pythonnode from the Popular Actions section onto the workflow canvas and rename it toSlack_message_builder. Navigate to the Configuration tab, and add the code below in the Code section.
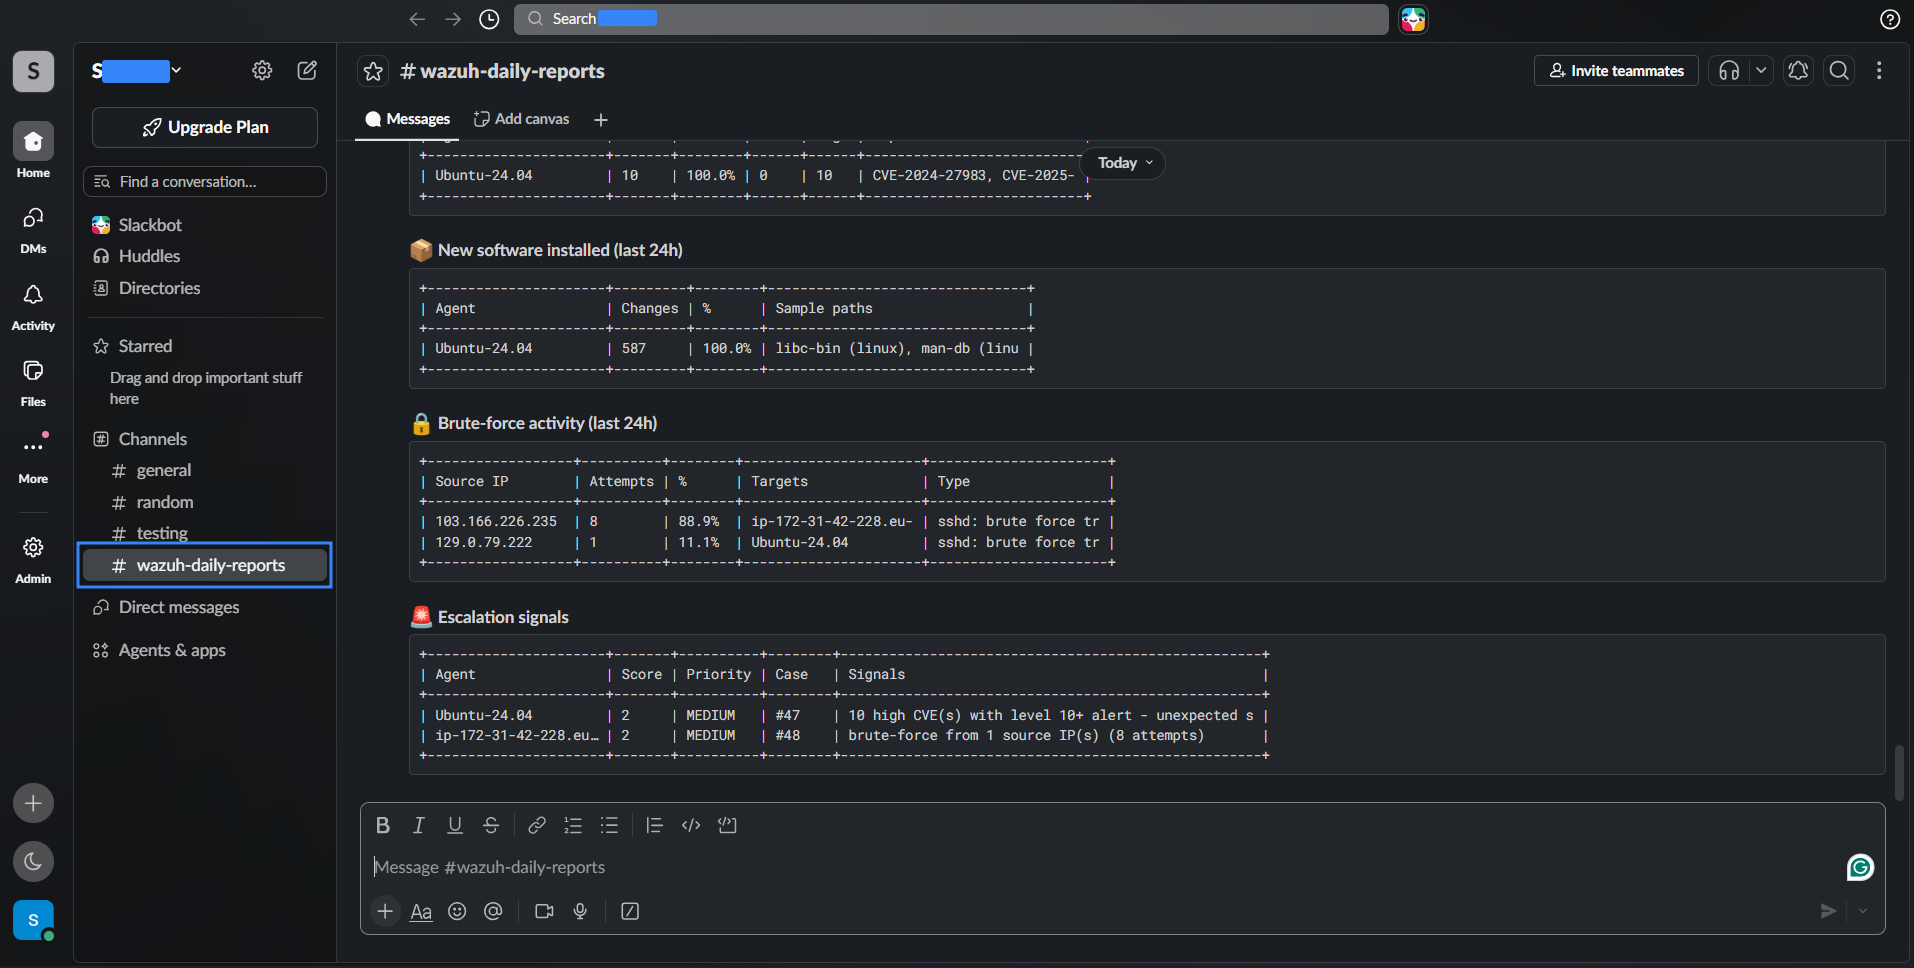
This node assembles the full report into a single Slack message. It reads the scored data from the Classify_by_monitored_endpoint node. Each part of the report is drawn as a fixed-width table so the columns line up in Slack. Slack renders text wrapped in triple backticks as monospace, which keeps the tables readable. The message covers the Wazuh agent status, the severity breakdown, vulnerabilities, new software, brute-force activity, Wazuh agents that are not reporting, and a final escalation summary.
import json
from datetime import datetime, timezone

classify_data = json.loads(r"""$classify_by_monitored_endpoint.message""")

# The TheHive node only runs on the escalation branch, so its
# output might not exist. Fall back to an empty case list.
try:
    cases_data = json.loads(r"""$create_thehive_case.message""")
except (ValueError, NameError, json.JSONDecodeError):
    cases_data = {"cases": []}

agents            = classify_data['agents']
agents_down       = classify_data['agents_down']
cases             = {c['agent']: c for c in cases_data.get('cases', [])}
stats             = classify_data['stats']
vulns_by_agent    = classify_data['vulns_by_agent']
software_by_agent = classify_data['software_by_agent']
bruteforce        = classify_data['bruteforce']
now               = datetime.now(timezone.utc).strftime('%Y-%m-%d %H:%M UTC')

# -- Helpers --------------------------------------------------
def pct(part, total):
    return f"{round(part / total * 100, 1)}%" if total else "0%"

def pad(text, width, align="left"):
    text = str(text)
    if len(text) > width:
        text = text[:width - 1] + "…"
    return text.ljust(width) if align == "left" else text.rjust(width)

def table(headers, rows, col_widths):
    """Build a fixed-width monospace table for Slack."""
    sep = "+" + "+".join("-" * (w + 2) for w in col_widths) + "+"
    def fmt_row(cells):
        return "| " + " | ".join(
            pad(c, col_widths[i]) for i, c in enumerate(cells)
        ) + " |"
    lines = [sep, fmt_row(headers), sep]
    for row in rows:
        lines.append(fmt_row(row))
    lines.append(sep)
    return "\n".join(lines)

priority_icon = {
    "critical": "CRIT",
    "high":     "HIGH",
    "medium":   "MED ",
    "normal":   "    "
}

# -- Totals --------------------------------------------------
total_all        = sum(a['count'] for a in agents)
sev_buckets      = stats['by_severity']['buckets']
total_7up        = sum(b['doc_count'] for b in sev_buckets)
total_agents_7up = sum(b['doc_count'] for b in stats['top_agents']['buckets'])
total_vulns      = sum(v['total'] for v in vulns_by_agent.values())
total_sw         = sum(s['total'] for s in software_by_agent.values())
total_bf         = sum(b['attempts'] for b in bruteforce)

lines = [
    f"> _*[WAZUH DAILY SECURITY SUMMARY - {now}]*_",
    f"> _Agents monitored: {len(agents)} | Total alerts: {total_all} | "
    f"Level 7+: {total_7up} ({pct(total_7up, total_all)}) | Cases opened: {len(cases)}_",
    ""
]

# -- Section 1: Agent status ---------------------------------
lines.append("*:bust_in_silhouette: Agent status*")
agent_rows = []
for a in sorted(agents, key=lambda x: x['escalation_score'], reverse=True):
    case      = cases.get(a['agent'])
    ticket    = f"#{case['case_number']}" if case else "-"
    pri       = priority_icon.get(a['priority'], "    ") if a['needs_ticket'] else "    "
    agent_rows.append([
        pri,
        a['agent'],
        str(a['count']),
        pct(a['count'], total_all),
        str(a['max_level']),
        str(a['escalation_score']),
        ticket
    ])

lines.append("```")
lines.append(table(
    ["Pri ", "Agent", "Alerts", "%", "MaxLvl", "Score", "Case"],
    agent_rows,
    [4, 20, 6, 6, 6, 5, 6]
))
lines.append("```\n")

# -- Section 2: Severity breakdown (level 7+) ----------------
lines.append("*:bar_chart: Severity breakdown (level 7+)*")
sev_rows = []
max_count = max((b['doc_count'] for b in sev_buckets), default=1)
for b in sorted(sev_buckets, key=lambda x: x['key'], reverse=True):
    bar = "#" * max(1, int(b['doc_count'] / max_count * 8))
    sev_rows.append([
        str(int(b['key'])),
        bar,
        str(b['doc_count']),
        pct(b['doc_count'], total_7up)
    ])
lines.append("```")
lines.append(table(
    ["Level", "Bar     ", "Count", "%"],
    sev_rows,
    [5, 8, 6, 6]
))
lines.append("```\n")

# -- Section 3: Critical and high vulnerabilities -------------
if vulns_by_agent:
    lines.append("*:shield: Critical & high vulnerabilities*")
    vuln_rows = []
    for agent_name, v in sorted(
        vulns_by_agent.items(), key=lambda x: x[1]['total'], reverse=True
    ):
        cve_str = ", ".join(v['top_cves'][:2]) if v['top_cves'] else "-"
        vuln_rows.append([
            agent_name,
            str(v['total']),
            pct(v['total'], total_vulns),
            str(v['critical']),
            str(v['high']),
            cve_str[:25]
        ])
    lines.append("```")
    lines.append(table(
        ["Agent", "Total", "%", "Crit", "High", "Top CVEs"],
        vuln_rows,
        [20, 5, 6, 4, 4, 25]
    ))
    lines.append("```\n")

# -- Section 4: New software installed ------------------------
if software_by_agent:
    lines.append("*:package: New software installed (last 24h)*")
    sw_rows = []
    for agent_name, s in sorted(
        software_by_agent.items(), key=lambda x: x[1]['total'], reverse=True
    ):
        pkgs = ", ".join(s['packages'][:2]) if s['packages'] else "-"
        sw_rows.append([
            agent_name,
            str(s['total']),
            pct(s['total'], total_sw),
            pkgs[:30]
        ])
    lines.append("```")
    lines.append(table(
        ["Agent", "Changes", "%", "Sample paths"],
        sw_rows,
        [20, 7, 6, 30]
    ))
    lines.append("```\n")

# -- Section 5: Brute-force activity --------------------------
if bruteforce:
    lines.append("*:lock: Brute-force activity (last 24h)*")
    bf_rows = []
    for b in sorted(bruteforce, key=lambda x: x['attempts'], reverse=True):
        targets  = ", ".join(b['targeted_agents'][:2]) or "unknown"
        atk_type = b['attack_types'][0][:20] if b['attack_types'] else "unknown"
        bf_rows.append([
            b['src_ip'],
            str(b['attempts']),
            pct(b['attempts'], total_bf),
            targets[:20],
            atk_type
        ])
    lines.append("```")
    lines.append(table(
        ["Source IP", "Attempts", "%", "Targets", "Type"],
        bf_rows,
        [16, 8, 6, 20, 20]
    ))
    lines.append("```\n")

# -- Section 6: Agents not reporting -------------------------
if agents_down:
    lines.append("*:x: Agents not reporting to manager*")
    down_rows = []
    for a in agents_down:
        last = a['last_seen'][:16] if a['last_seen'] != 'never' else 'never'
        down_rows.append([
            a['name'],
            a['ip'],
            a['status'],
            last,
            a['os'][:20]
        ])
    lines.append("```")
    lines.append(table(
        ["Agent", "IP", "Status", "Last seen", "OS"],
        down_rows,
        [20, 15, 16, 16, 20]
    ))
    lines.append("```\n")

# -- Section 7: Escalation reasons summary (only escalated agents) --------
escalated = [a for a in agents if a['needs_ticket']]
if escalated:
    lines.append("*:rotating_light: Escalation signals*")
    lines.append("```")
    esc_rows = []
    for a in sorted(escalated, key=lambda x: x['escalation_score'], reverse=True):
        case    = cases.get(a['agent'])
        ticket  = f"#{case['case_number']}" if case else "-"
        reasons = " - ".join(a['escalation_reasons'])[:50]
        esc_rows.append([
            a['agent'],
            str(a['escalation_score']),
            a['priority'].upper(),
            ticket,
            reasons
        ])
    lines.append(table(
        ["Agent", "Score", "Priority", "Case", "Signals"],
        esc_rows,
        [20, 5, 8, 6, 50]
    ))
    lines.append("```")

print(json.dumps({"message": "\n".join(lines)}))
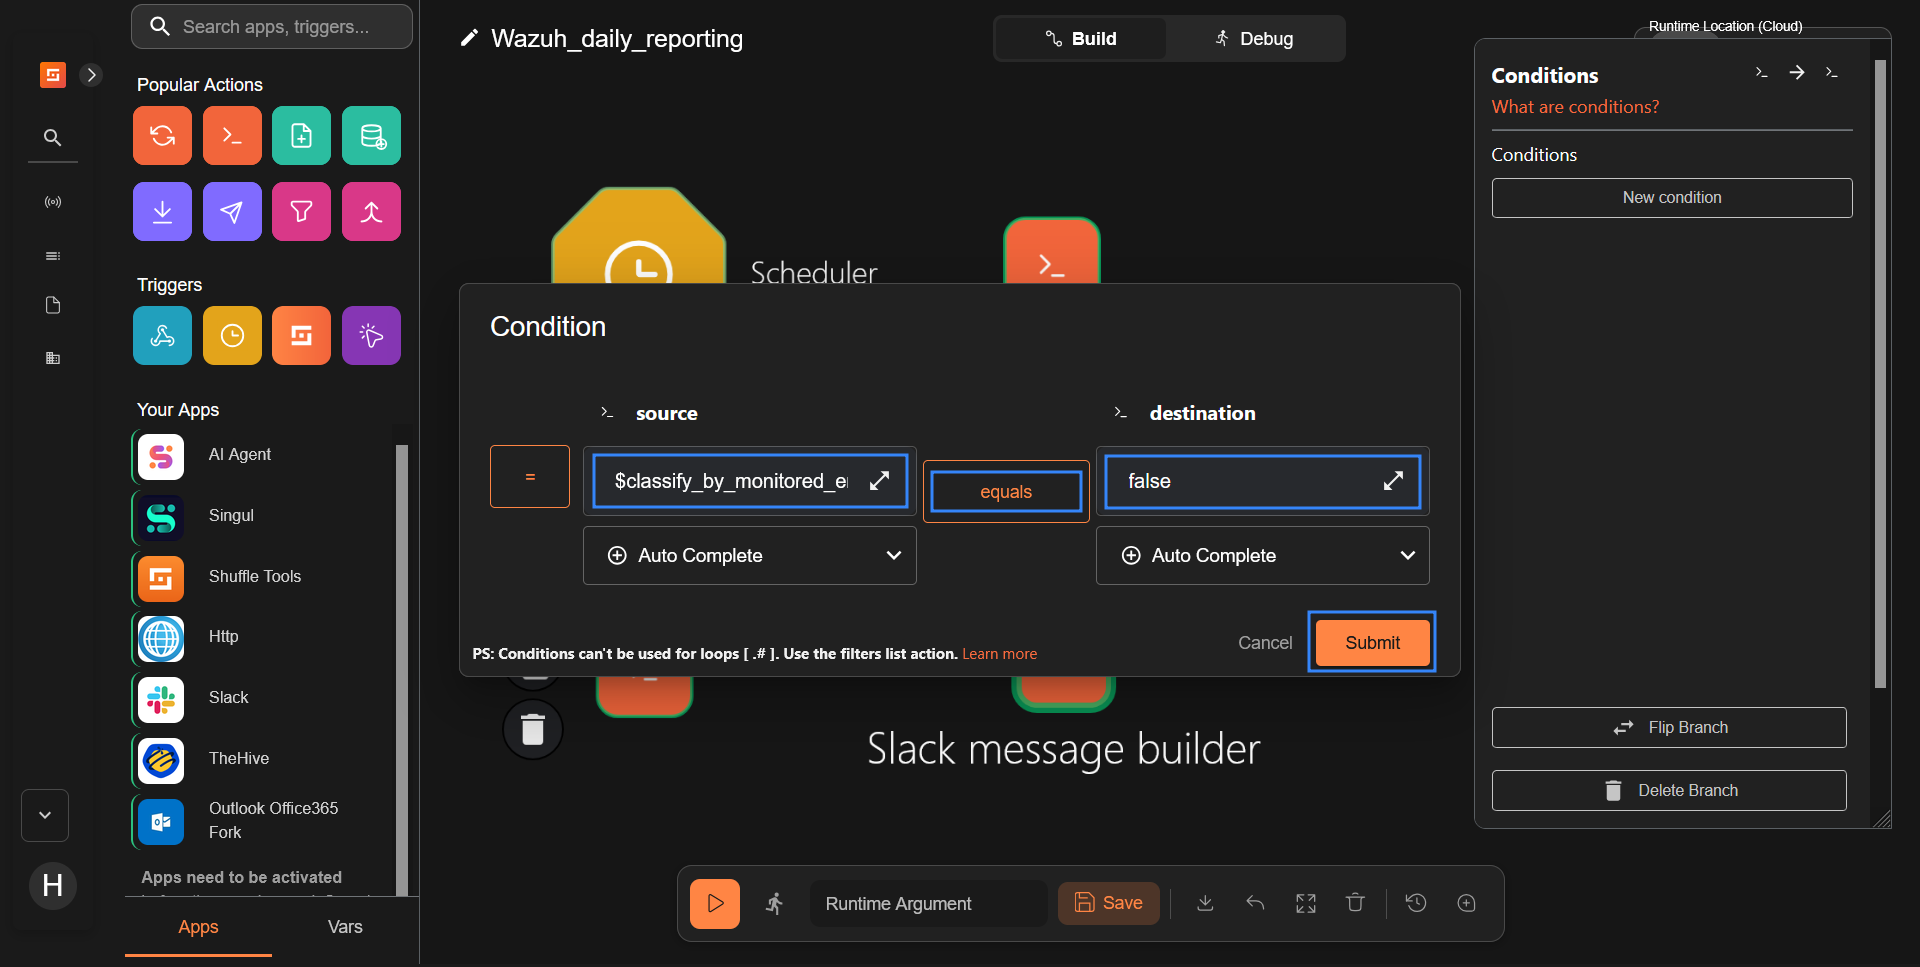
- Connect a branch from the
Classify_by_monitored_endpointnode to theSlack_message_buildernode, then click it and choose New condition. Enter the following values, so it runs when there are no escalations:
$classify_by_monitored_endpoint.message.any_escalationin the source fieldequalsin the middle fieldfalsein the destination field- Click Submit to save the condition
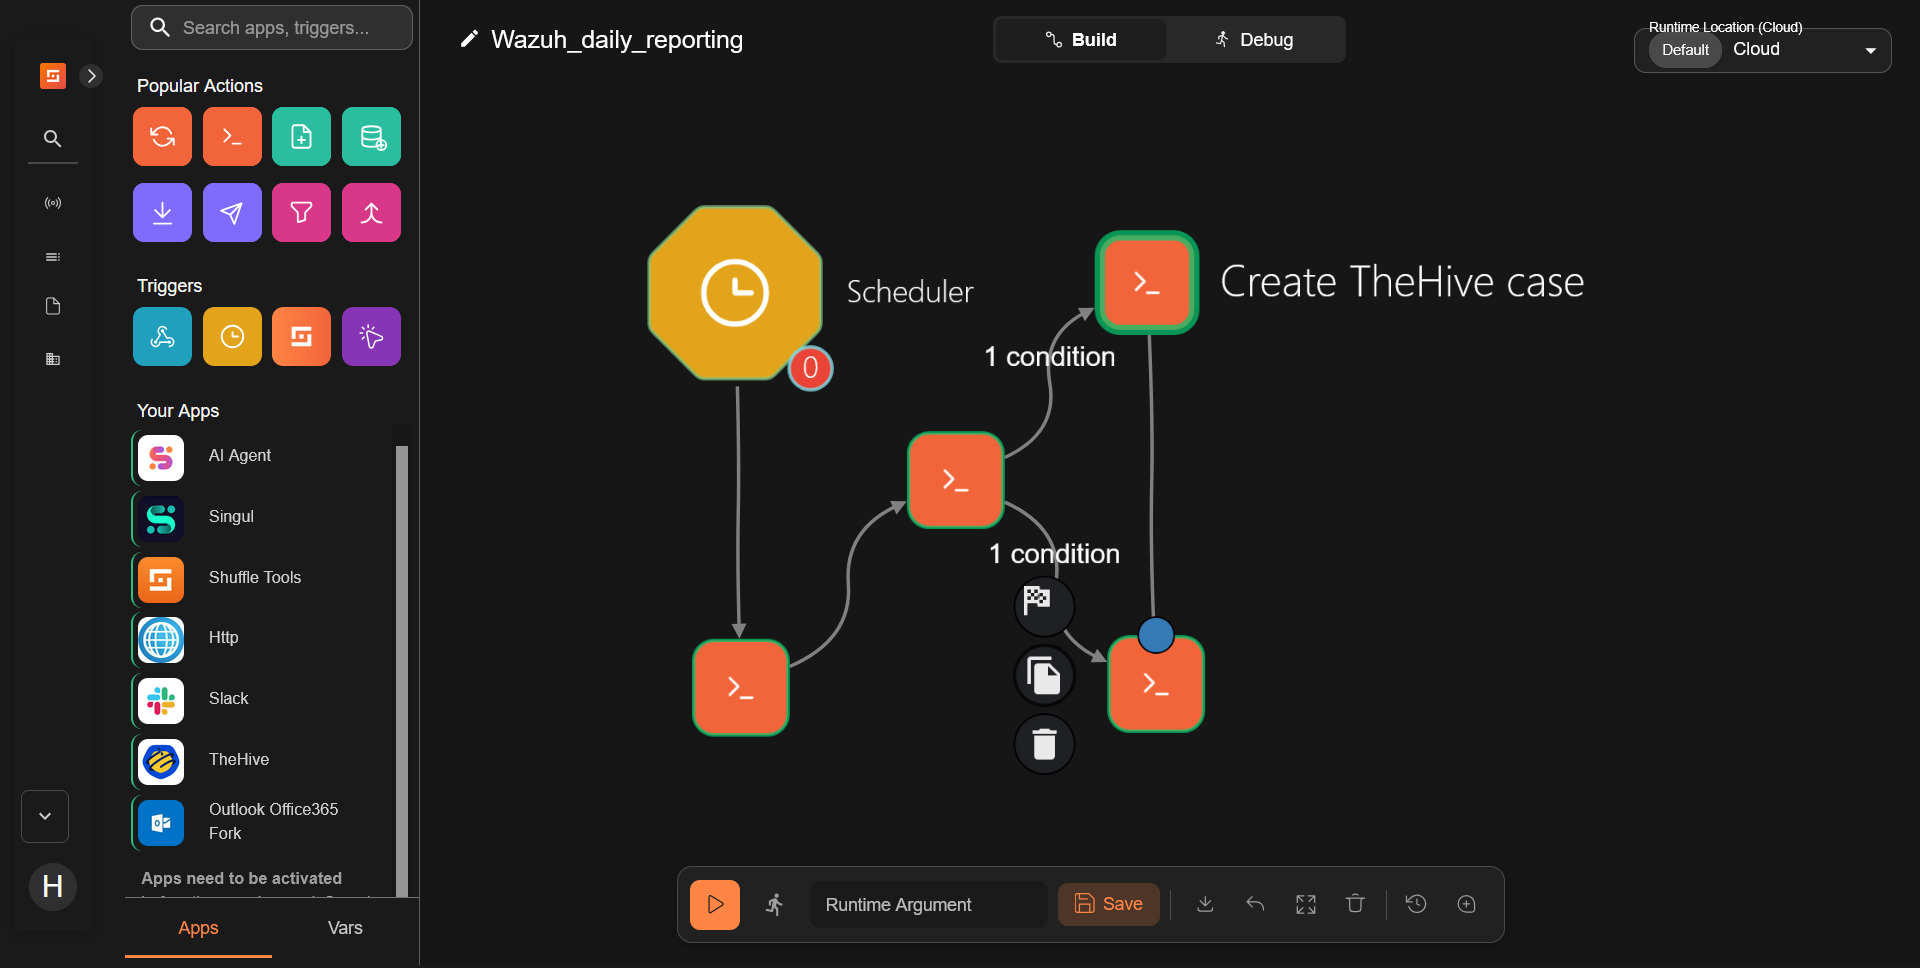
- Connect a branch from the
Create_TheHive_casenode to theSlack_message_buildernode to send the opened cases information for processing.
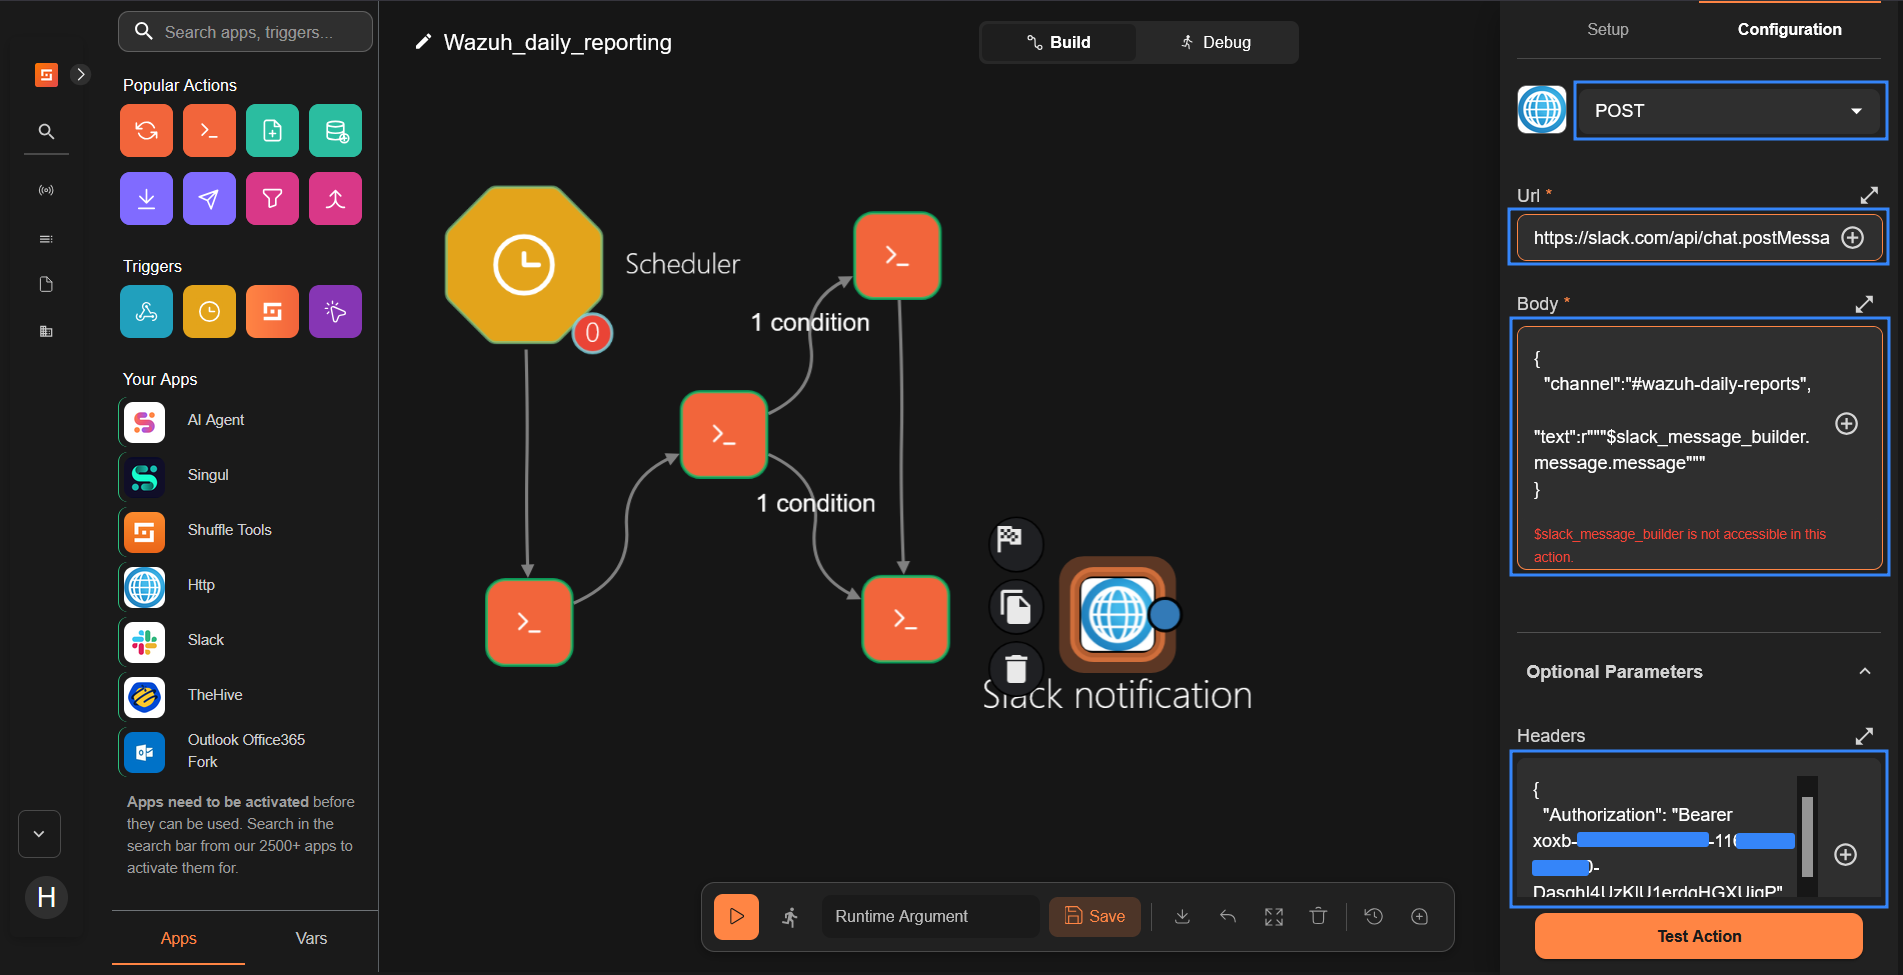
- Drag an
HTTPnode onto the workflow canvas and configure it as follows:
- Rename the node to
Slack_notification. - Select
POSTunder Find Actions. - Set the URL value to
https://slack.com/api/chat.postMessage. - Replace the content of the Body field with the following, and
<SLACK_CHANNEL>with the name of the Slack channel that receives the alert summary report:
{
  "channel":"#<SLACK_CHANNEL>",
  "text":r"""$slack_message_builder.message.message"""
}
- Expand Optional Parameters, replace the content of the Headers field with the following, and
<SLACK_BOT_USER_OAUTH_TOKEN>with your Slack bot user OAuth token.
{
  "Authorization": "Bearer <SLACK_BOT_USER_OAUTH_TOKEN>",
  "Content-Type": "application/json"
}
- Connect a branch from the
Slack_message_buildernode to theSlack_notificationnode, then click Save.
Security monitoring with Wazuh
Wazuh continuously monitors enrolled endpoints and generates alerts when it detects security-relevant activity. The following scenarios demonstrate several Wazuh detection capabilities, including threat detection, IT hygiene, and vulnerability detection.
To validate the detection and the workflow, generate activity on the monitored Ubuntu endpoint that matches the signals the workflow scores. Wait for the next scheduled run, or trigger the workflow manually in Shuffle with the Execute workflow button, then check the results in the Wazuh dashboard, Slack, and TheHive.
In these scenarios, we show how Wazuh:
- Detects brute-force activity on monitored endpoints
- Identifies newly installed software or packages on monitored endpoints
- Detects critical and high-severity vulnerabilities on monitored endpoints
Brute-force attempt
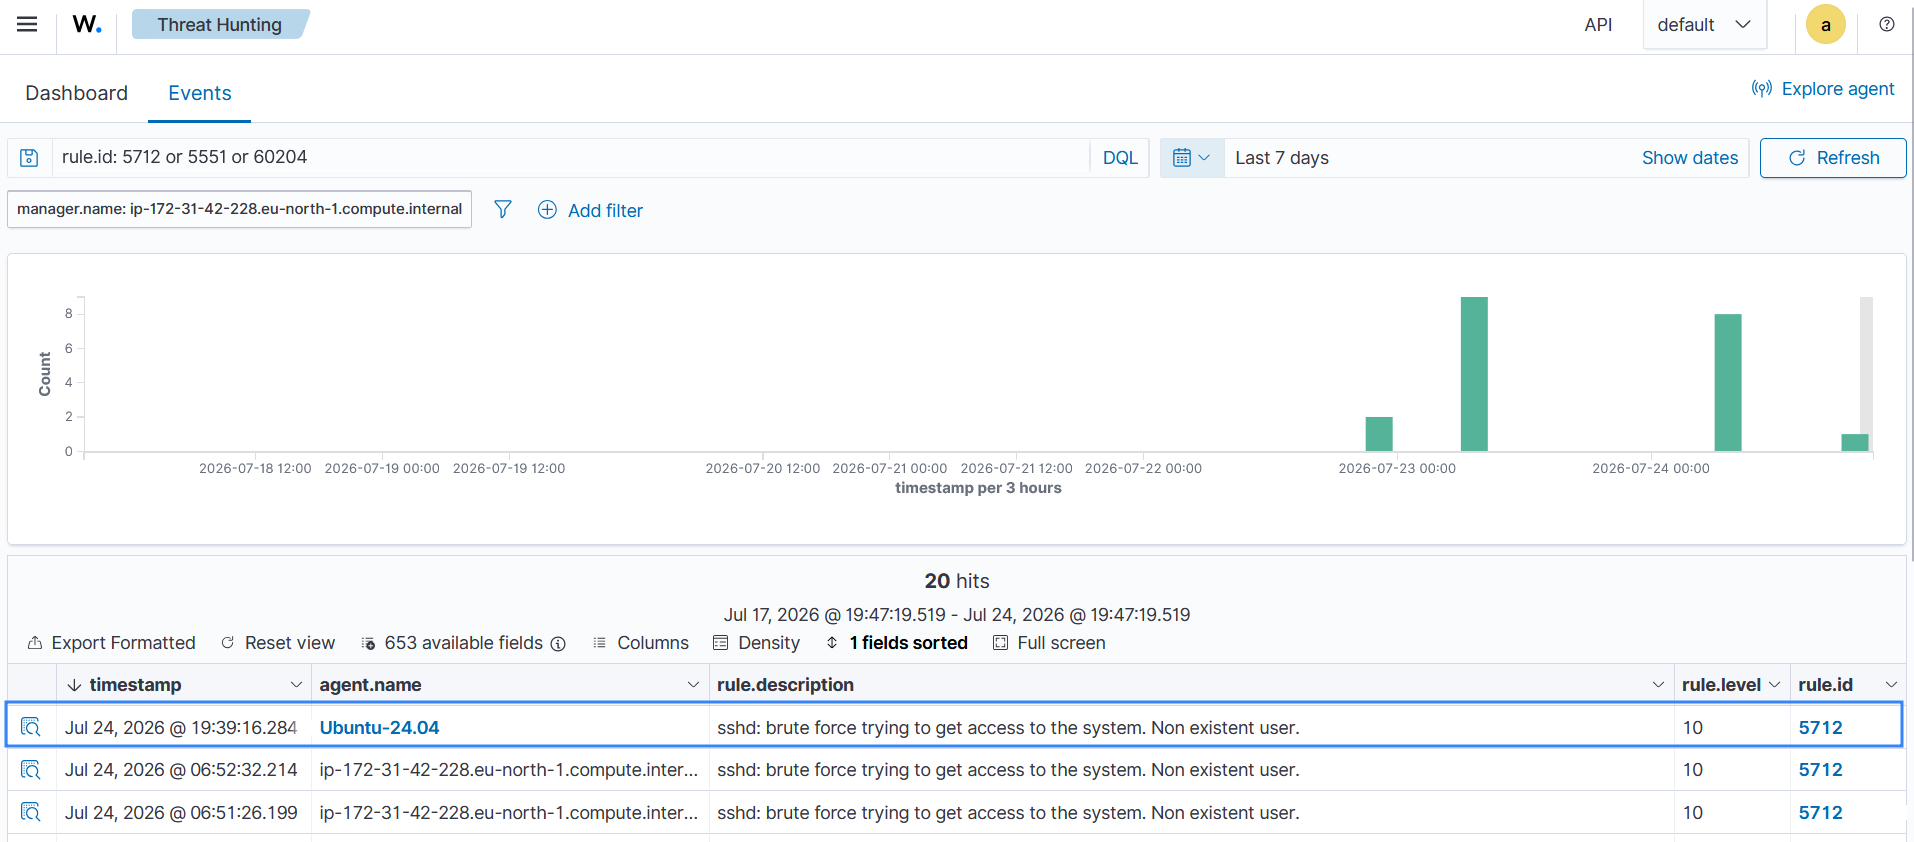
From a separate endpoint, repeatedly attempt to log in over SSH to the publicly accessible Ubuntu endpoint using an invalid user. Wazuh detects the failed SSH authentication attempts and generates alerts for rule IDs 5551, 5710, 5711, 5712, and 60204.
Run the command below to generate several SSH connection attempts. Replace <UBUNTU_IP> with the IP address of the Ubuntu endpoint.
$ for i in $(seq 1 30); do
    ssh -o BatchMode=yes -o ConnectTimeout=3 invaliduser@<UBUNTU_IP>
  done
Wazuh dashboard
Perform the following steps on the Wazuh dashboard to visualize the generated alerts.
- Navigate to Threat Hunting and click the Events tab.
- Input the query rule.id:
5712 or 5551 or 60204and click Update to view the generated alerts.
Package installation detection
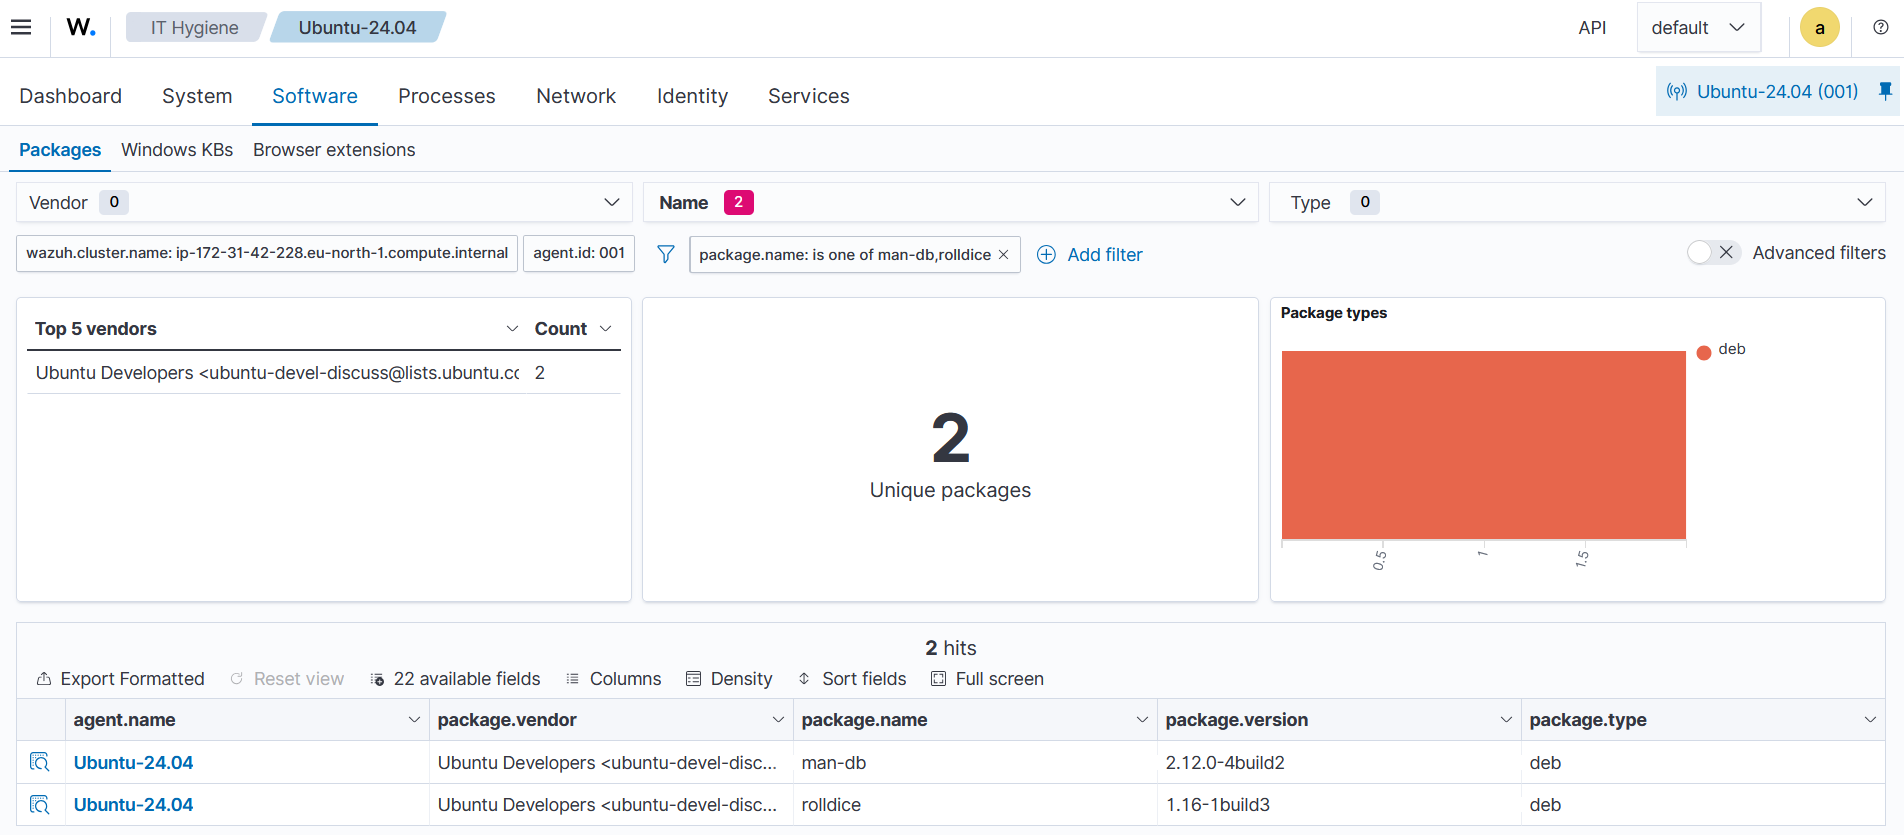
Wazuh monitors the package manager logs on each monitored endpoint and generates an alert whenever new software is installed. On Debian and Ubuntu systems, it reads /var/log/dpkg.log and generates an alert for rule ID 2902, which the workflow groups per endpoint in the scoring stage. An unexpected package on an endpoint that is also generating alerts contributes to that endpoint’s escalation score.
Install a sample package, such as rolldice, on the Ubuntu endpoint. This package also installs man-db.
$ sudo apt install rolldice
Wazuh dashboard
Perform the following steps on the Wazuh dashboard to view the installed package inventory.
- Navigate to Security operations > IT Hygiene and click the Software tab.
- Click Explore agent and select the monitored Ubuntu endpoint
- Filter by
package.name: is one of man-db,rolldiceto view the inventory entries.
Vulnerable software detection
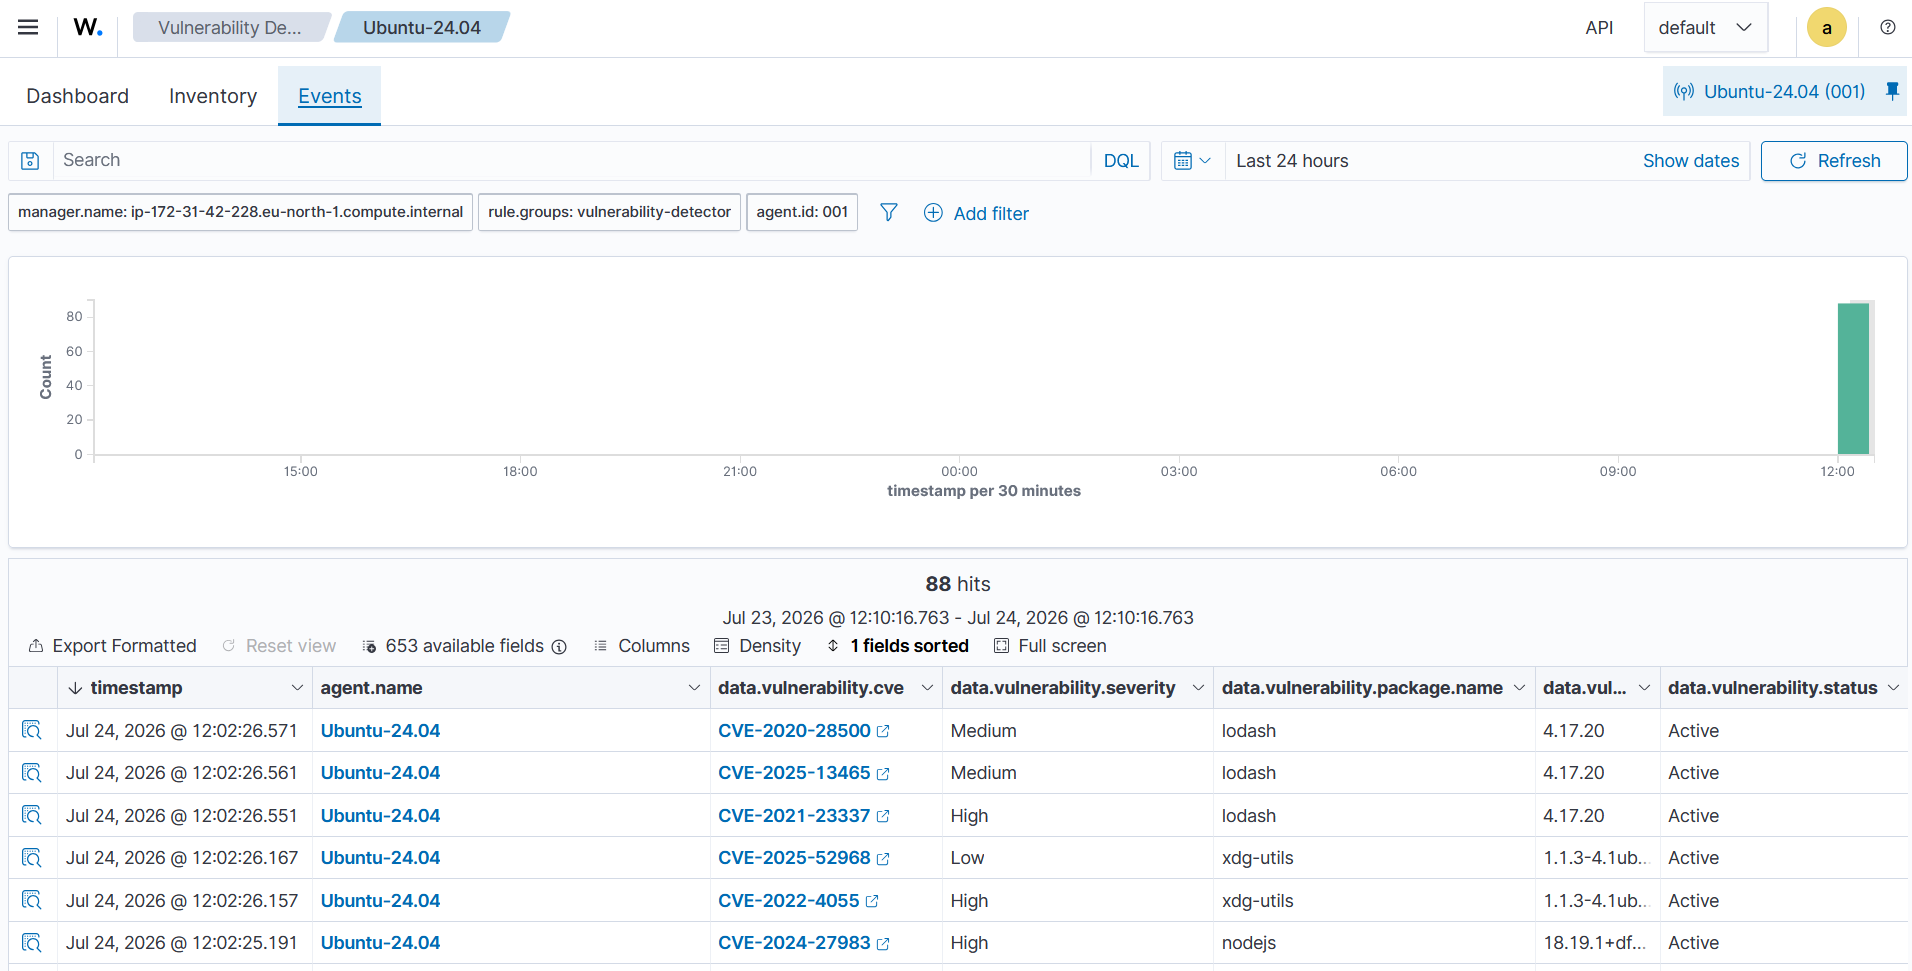
The Wazuh Vulnerability Detection module scans the packages installed on each monitored endpoint. It compares the results against the Wazuh Cyber Threat Intelligence (CTI) feed to identify known Common Vulnerabilities and Exposures (CVEs). Installing packages with known critical or high vulnerabilities causes the Wazuh Vulnerability Detection module to generate alerts, which the workflow groups per endpoint in the scoring stage. A critical CVE on an endpoint that is also generating level 10 or above alerts contributes to that endpoint’s escalation score.
Install an outdated version of a package, for example, lodash@4.17.20 with known vulnerabilities on the Ubuntu endpoint:
$ sudo apt install npm
$ sudo npm install -g lodash@4.17.20
Wazuh dashboard
Perform the following steps on the Wazuh dashboard to visualize the generated alerts.
- Navigate to Threat intelligence > Vulnerability Detection and click the Events tab.
- Click Explore agent and select the monitored Ubuntu endpoint to view the generated alerts.
Visualizing the results
After the workflow runs, you can confirm the end-to-end flow in the following places.
- The Wazuh dashboard shows the underlying alerts.
- The Shuffle execution view shows the output of each node.
- TheHive shows the opened cases, if any.
- Slack shows the delivered summary report.
Wazuh dashboard
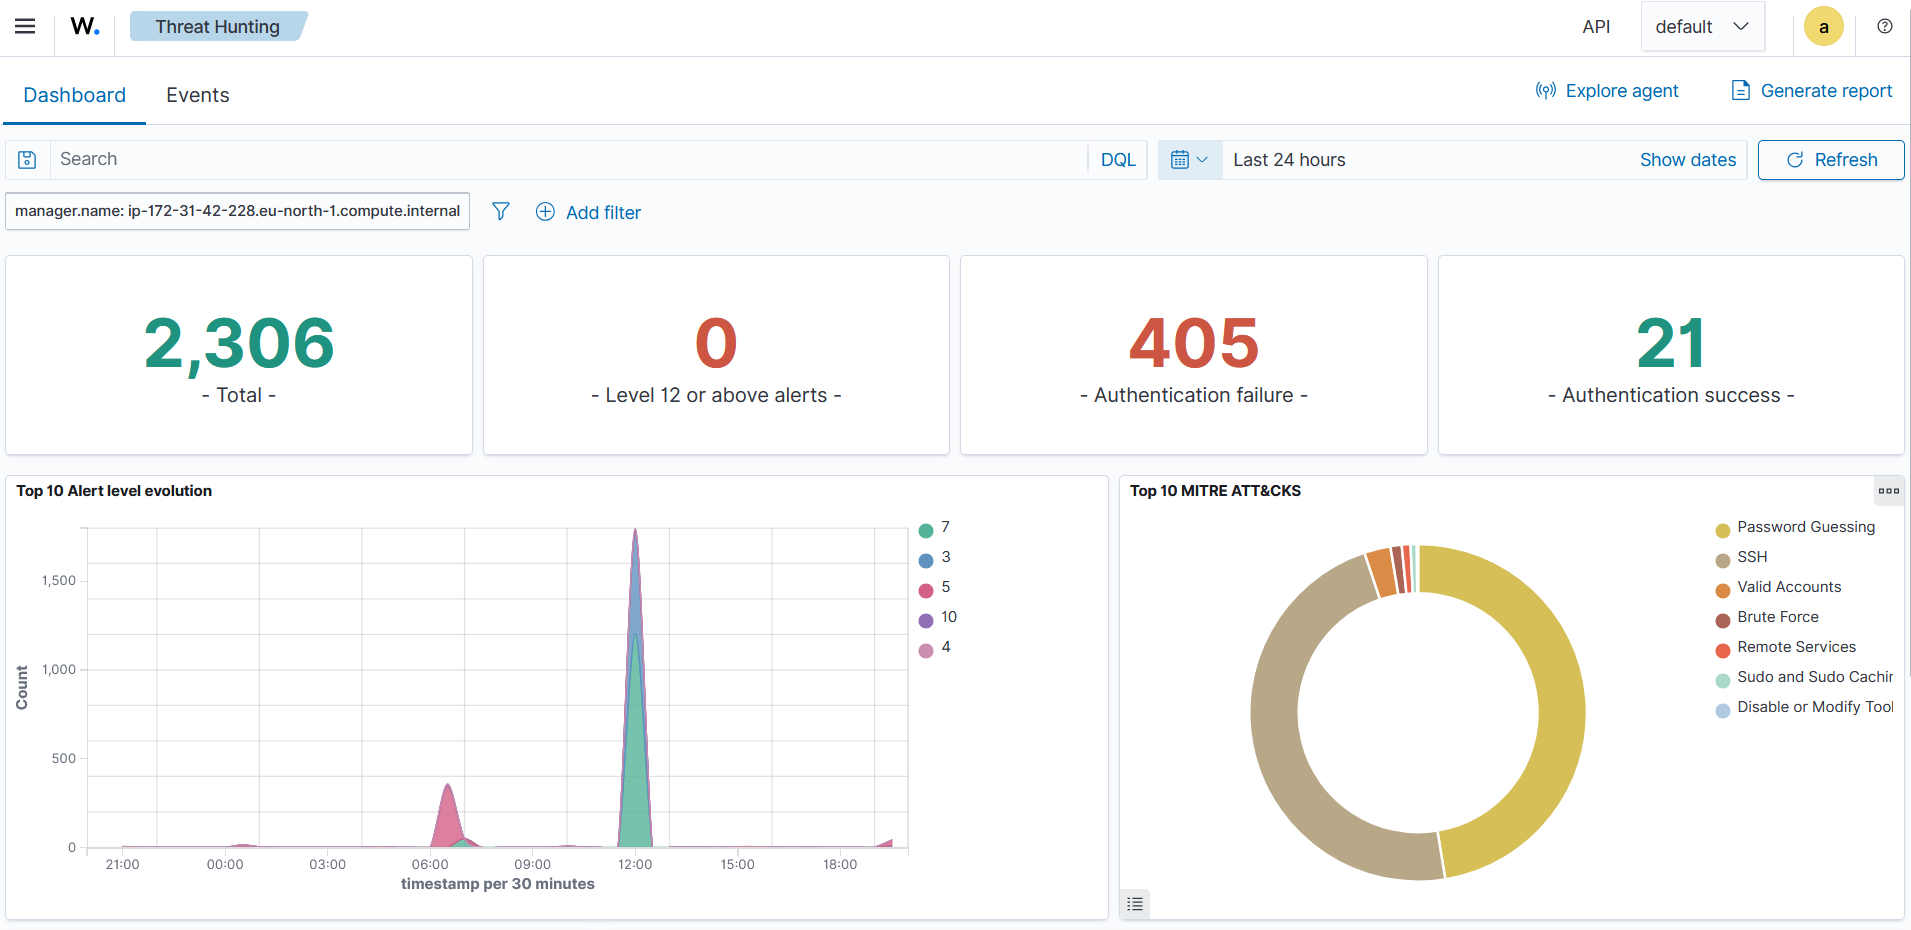
The Wazuh dashboard confirms the activity that the workflow reports. Click Threat Hunting and review the summary tiles and visualizations for the reporting window. The overview shows a total alert count of 2306 generated during the simulation. This view corresponds to the data the workflow queried and summarized in the Slack report.
Shuffle execution
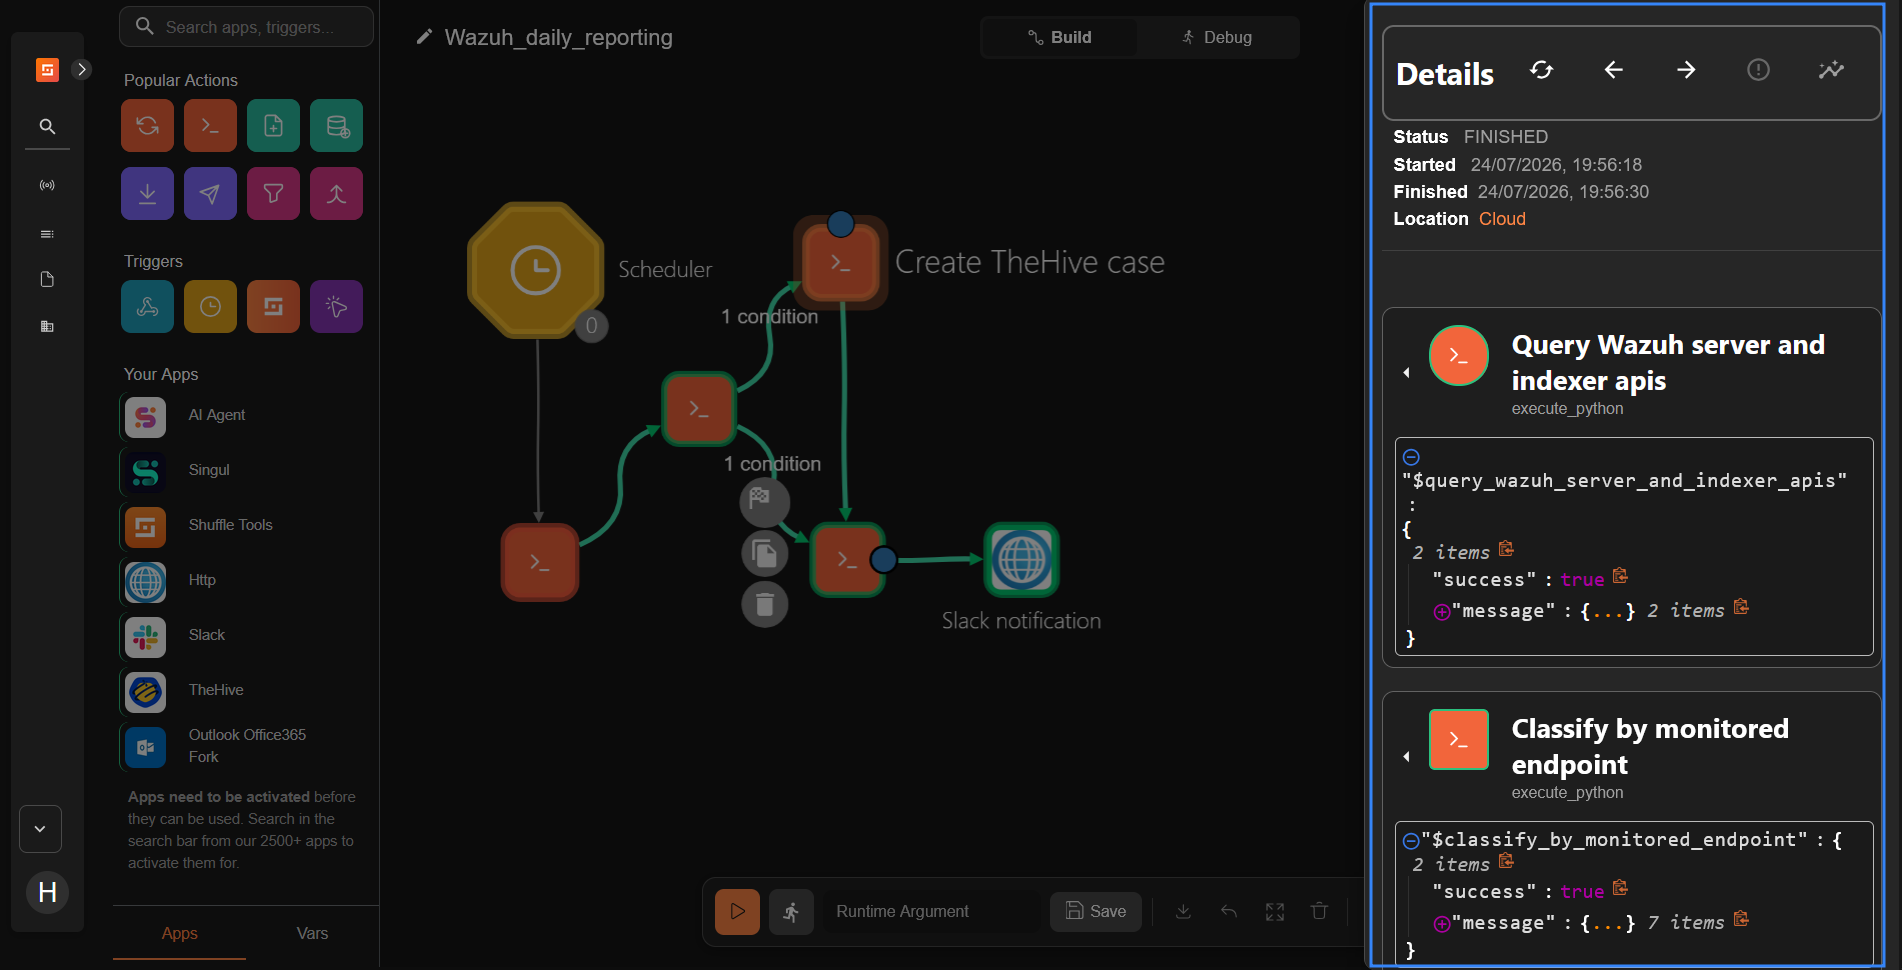
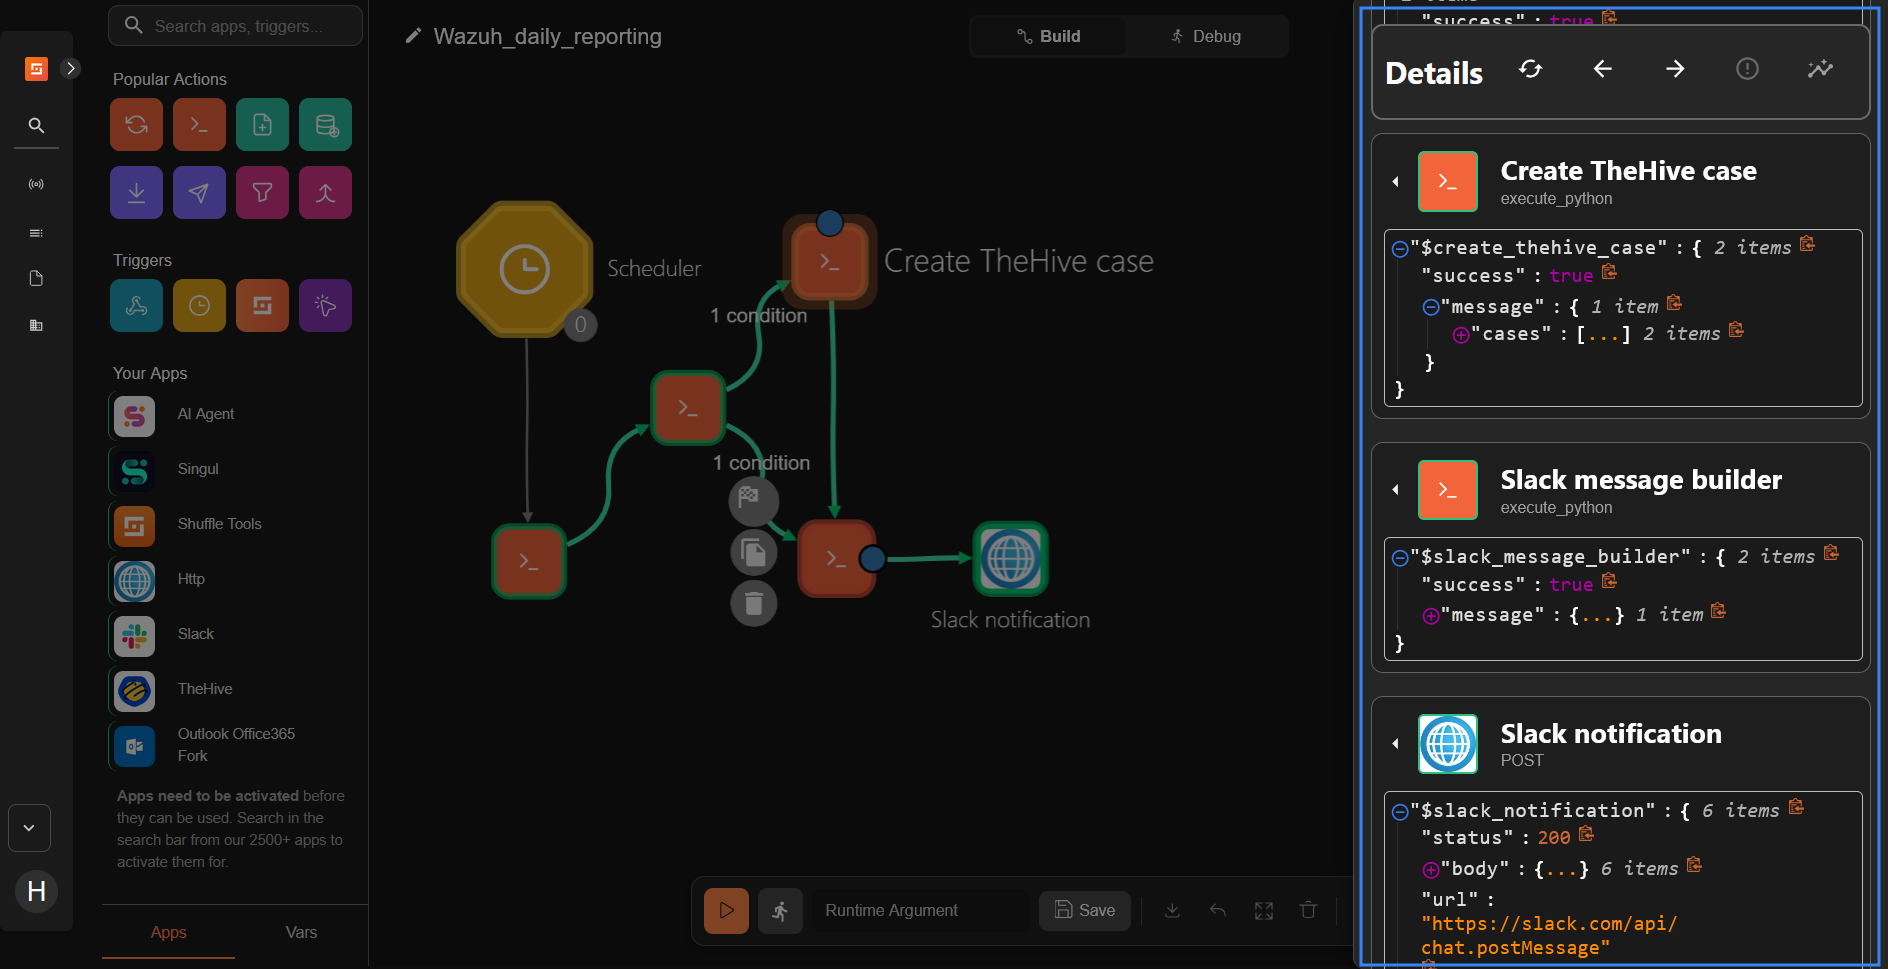
When the Shuffle workflow runs, you can see the following results:
- The
Query_Wazuh_server_and_indexer_apisnode returns the raw query responses and the list of Wazuh agents that are not reporting. - The
Classify_by_monitored_endpointnode returns the scored summary, including any_escalation. - When escalation occurs, the
Create_TheHive_casenode lists the cases it opened. - The
Slack_message_buildernode returns the finished message. - The
Slack_notificationnode shows the Slack API response.
Slack notifications
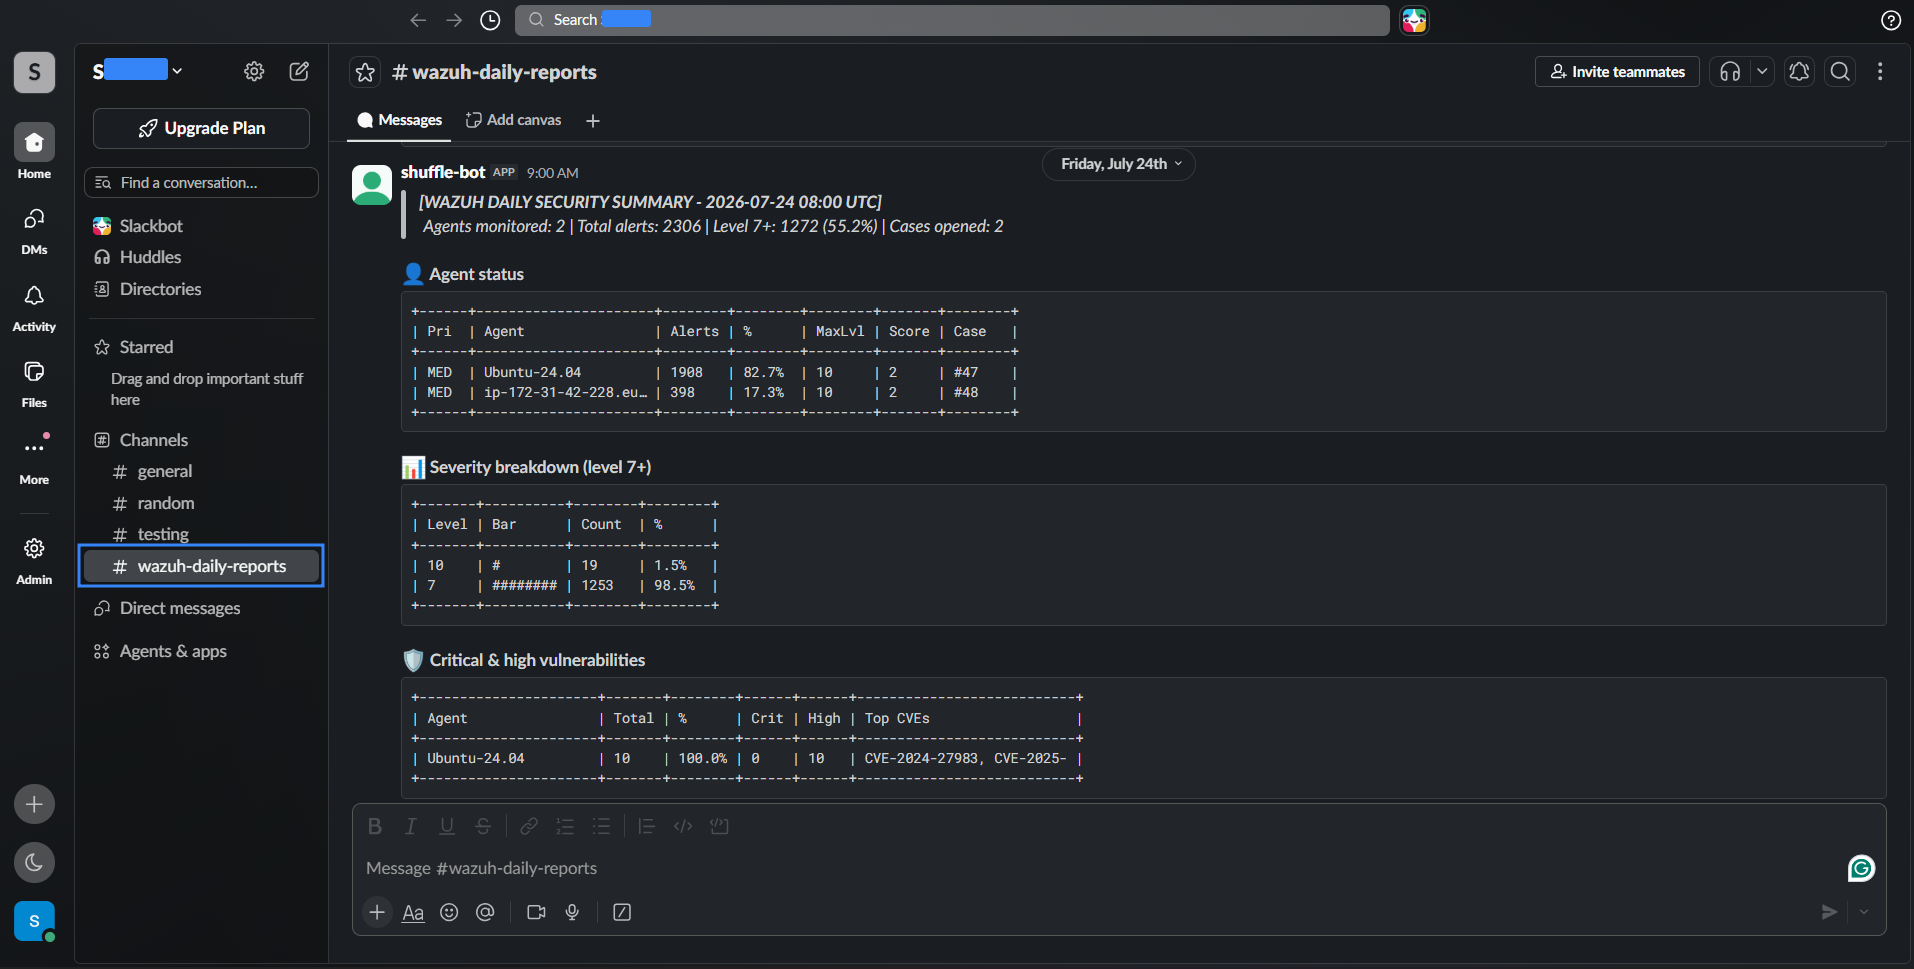
The Slack channel receives one message for each workflow run. The message begins with the totals line and the Wazuh agent status table. It is followed by the severity breakdown, vulnerabilities, new software, brute-force activity, and Wazuh agents that are not reporting. The message ends with an escalation summary that lists each escalated endpoint with its score, priority, case number, and the signals that triggered it.
TheHive cases
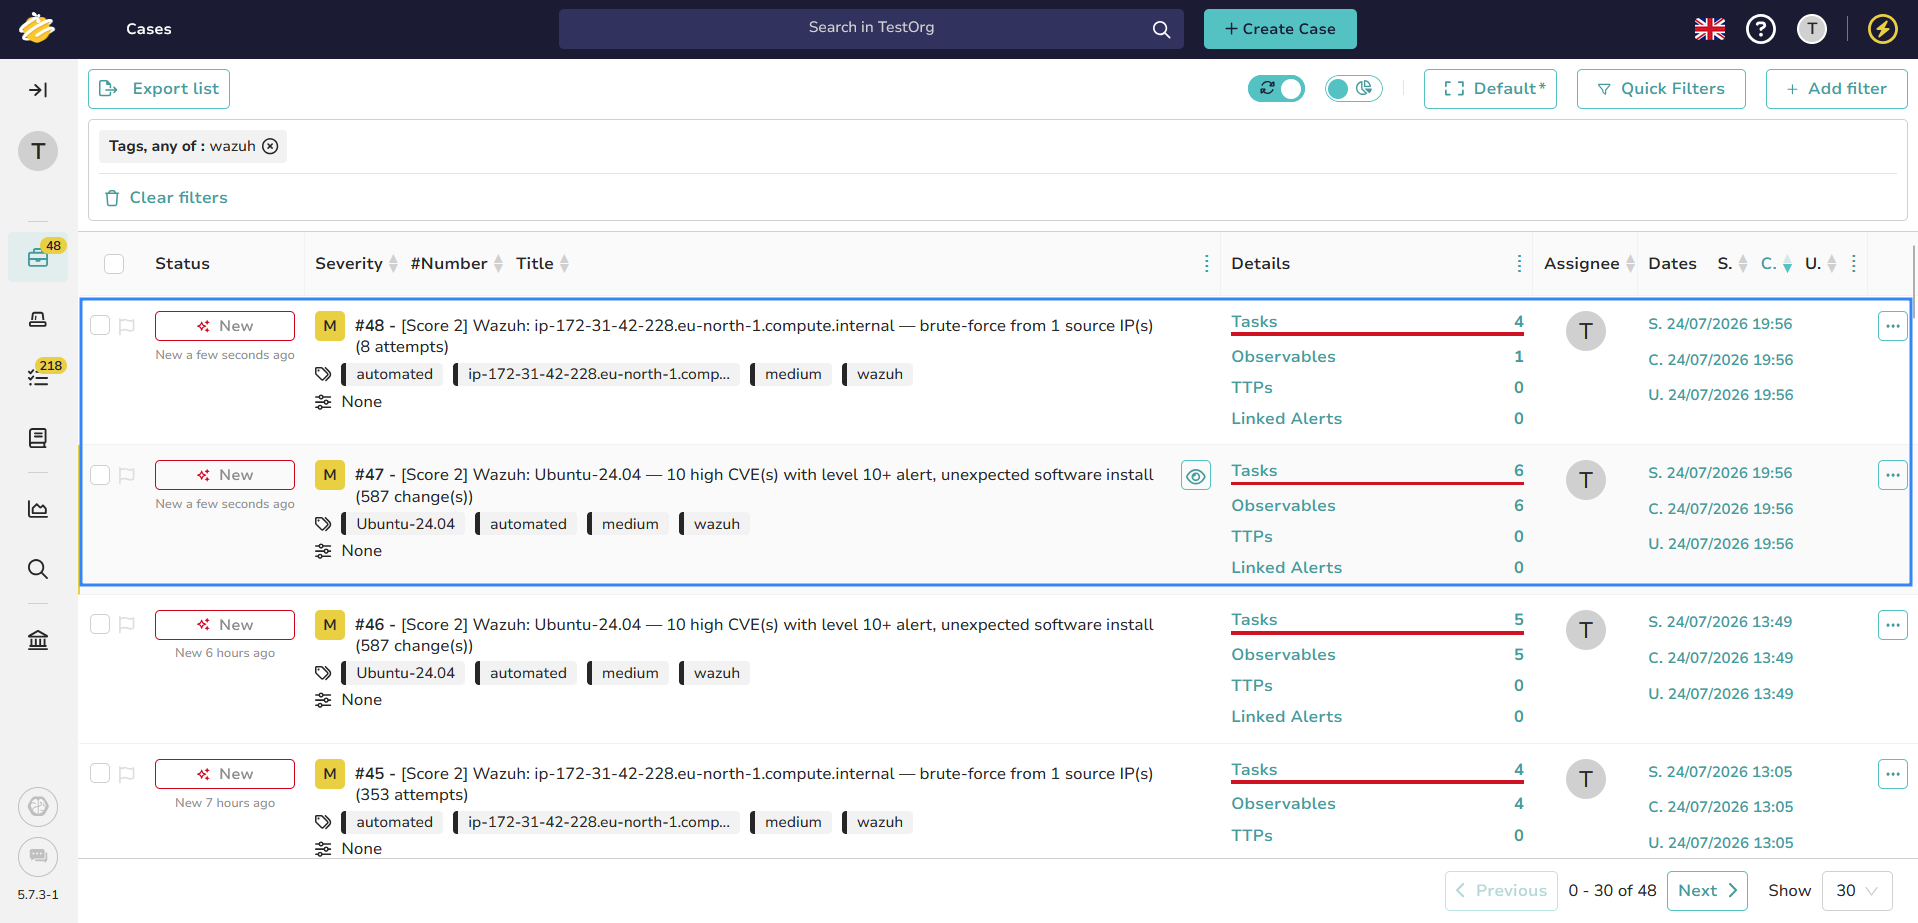
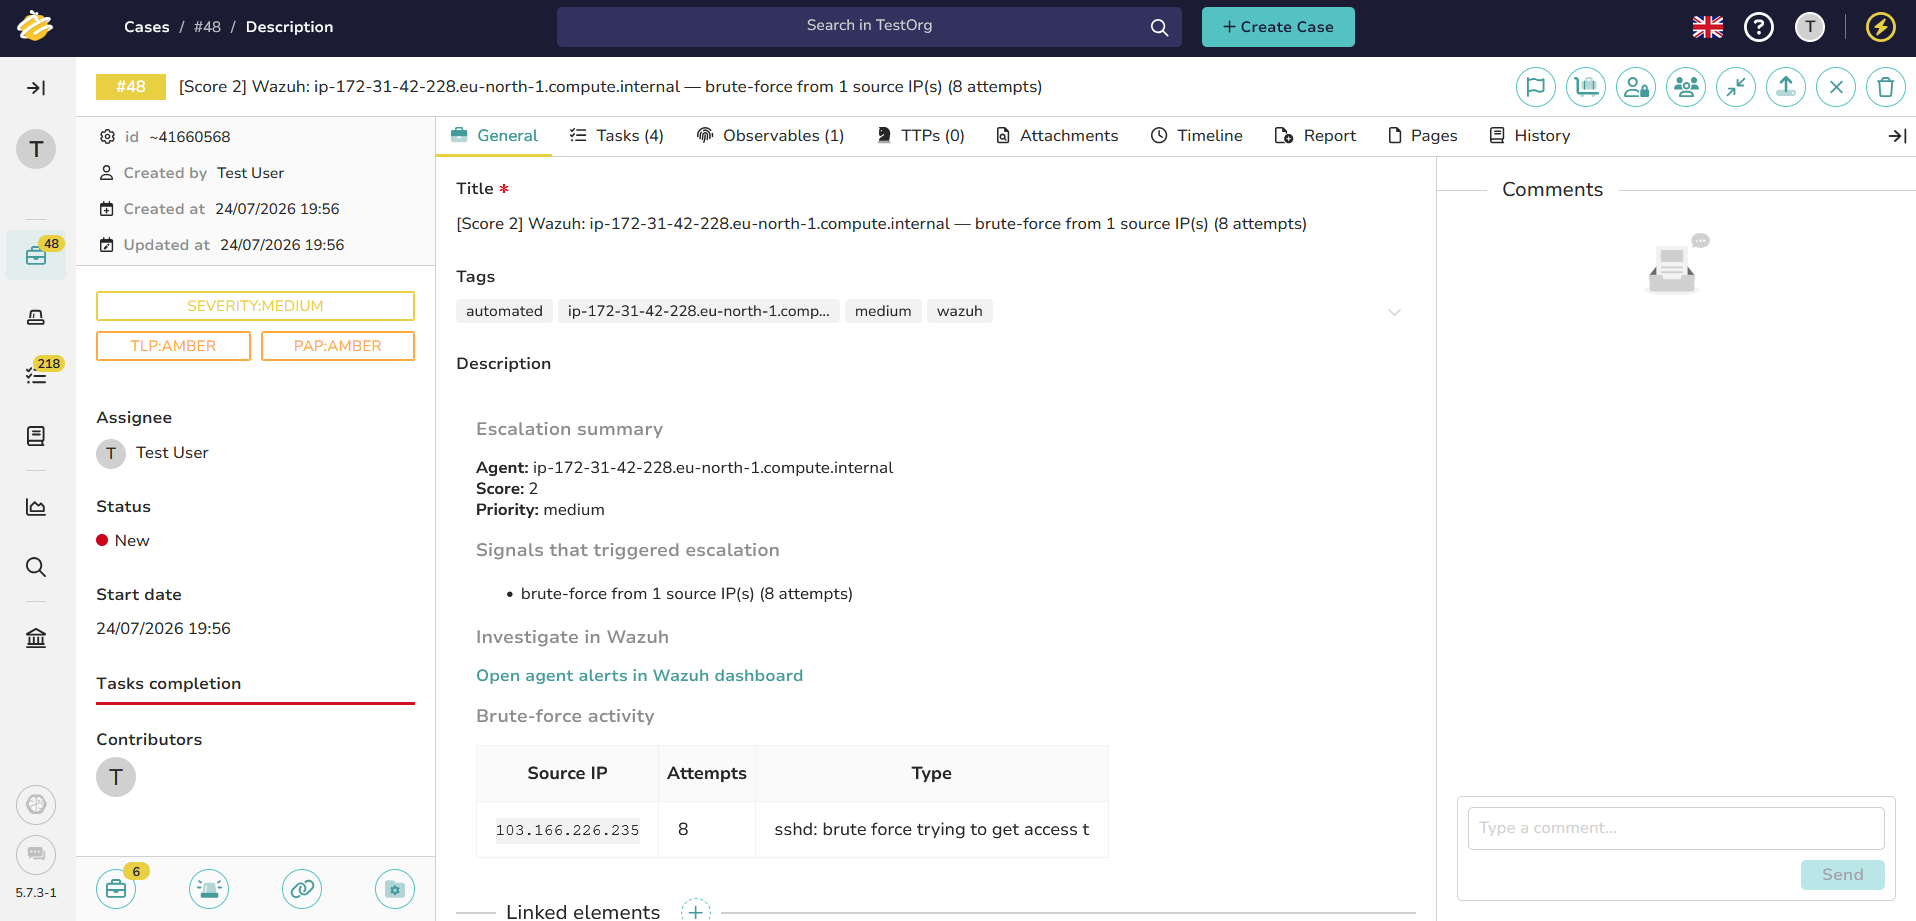
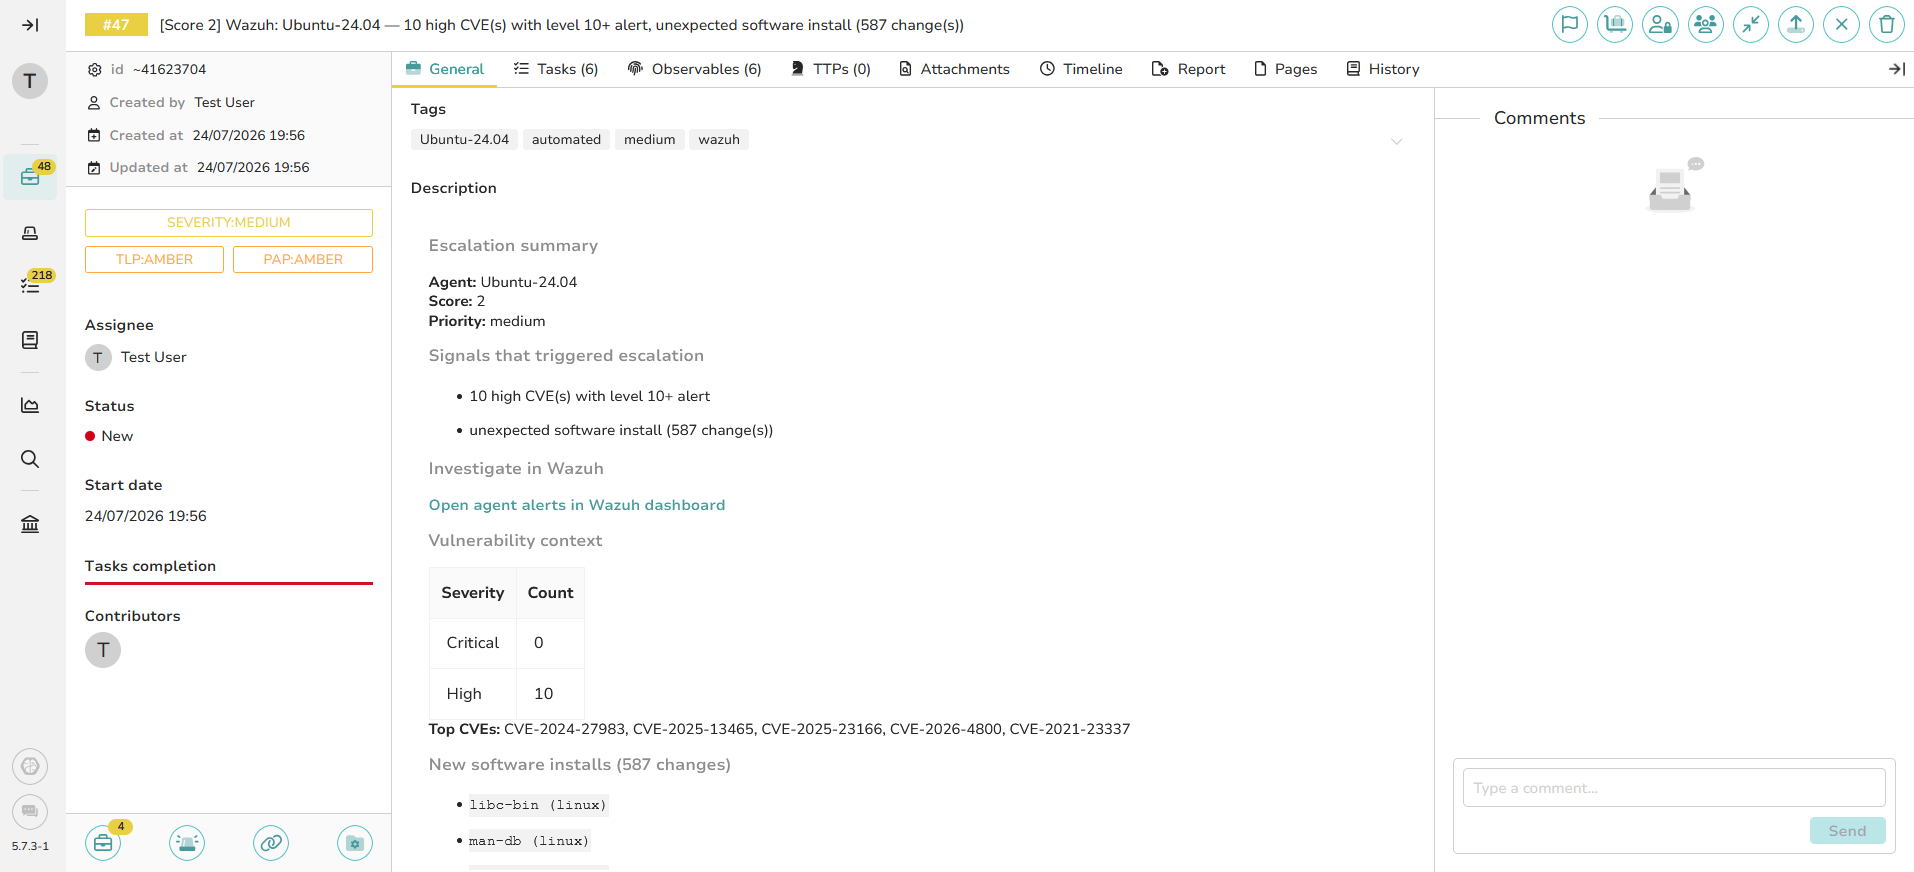
For each escalated endpoint, TheHive shows a new case titled with the score, the Wazuh agent, and the top signals. The case description contains the escalation summary, the signals that triggered it, and a link to the Wazuh dashboard. It also includes vulnerability, software, and brute-force sections when applicable. The attached observables such as source IPs and CVEs are ready for enrichment, and the pre-filled tasks guide the analyst through the investigation.
Click any of the created cases to view their details. The following images show the details for cases 48 and 47.
Conclusion
In this blog post, we showed how to combine Wazuh detection with Shuffle automation to deliver daily security reports to Slack and open cases in TheHive when a Wazuh agent meets the configured escalation threshold. Wazuh detects the relevant security events, and Shuffle queries the Wazuh APIs to collect, score, and process the results. The workflow scores five signals against each monitored endpoint, including critical severity alerts, disconnected Wazuh agents, critical vulnerabilities, new software installations, and brute-force attempts. Shuffle then formats a useful notification and escalates the alert when appropriate.
This approach reduces the manual work of copying alert details into chat and ticketing tools, and it gives analysts consistent, actionable context. Once the report data reaches Shuffle, you can extend the workflows with threat-intelligence enrichment, active response actions, or additional destinations to align with your security playbooks.
Feel free to connect with the Wazuh community, where our team and contributors actively share knowledge and provide support.