
MongoDB Atlas is a fully managed, cloud-native database service that provides scalable and flexible document-oriented data storage. Built on the popular MongoDB engine, it enables organizations to deploy, operate, and scale databases across multiple cloud providers with minimal operational overhead. MongoDB Atlas supports high-performance workloads, real-time analytics, and modern application development. It is often used to store sensitive data, including user profiles, application logs, financial records, and business-critical transactions. As a centralized data platform, it represents a valuable target for attackers seeking unauthorized access or data exfiltration.
Monitoring MongoDB Atlas with Wazuh extends security visibility into managed database environments. By integrating MongoDB Atlas audit logs with Wazuh, security teams can detect behavior such as unauthorized access attempts, privilege escalations, and configuration changes. This improves threat detection, accelerates incident response, and supports compliance requirements by ensuring continuous monitoring of database access and operations.
This blog post explains how to export MongoDB Atlas logs and forward them to the Wazuh server for centralized analysis and real-time security monitoring.
Infrastructure
We use the following infrastructure to demonstrate the configuration required for monitoring MongoDB Atlas:
- A Wazuh 4.14.5 central components (Wazuh server, Wazuh indexer, Wazuh dashboard) installed on an Ubuntu 24.04 endpoint using the Quickstart guide.
- A MongoDB Atlas account. This requires an M10+ cluster and the user to have Project Owner or Organization Owner access permission.
- An AWS CLI or an AWS CloudShell terminal.
Configuration
MongoDB Atlas collects logs in two mediums: the database engine plane (your database clusters) and the management plane (the Atlas web UI). Database operations and platform management actions happen in entirely different environments, preventing the capture of all activity from a single stream. The database engine logs support streaming of logs to a storage bucket such as AWS S3, while the management plane logs can be retrieved via the provided API. To capture logs from both planes, we need to configure the collection separately:
Exporting database engine logs via Amazon S3
In this configuration, Atlas continuously delivers logs to S3, where they can be retained and managed centrally. The logs export tracks everything happening inside the database engine itself. This includes raw database authentication attempts, connections, slow queries, and database auditing events (mongod and mongos processes).
A Wazuh manager or Wazuh agent can then be configured to periodically retrieve these logs from the S3 bucket and forward them to the Wazuh server for analysis. Follow the steps below to configure your Atlas to forward logs to an AWS S3 bucket.
Note
Exporting logs incurs data transfer charges, which vary by the destination and the S3 bucket’s region. Network interruptions or retry attempts may lead to duplicate log entries in your AWS S3 bucket. The AWS IAM role and the S3 bucket must reside within the same AWS account.
Create a new role with the AWS CLI
Perform the following steps on your Atlas account and AWS CLI:
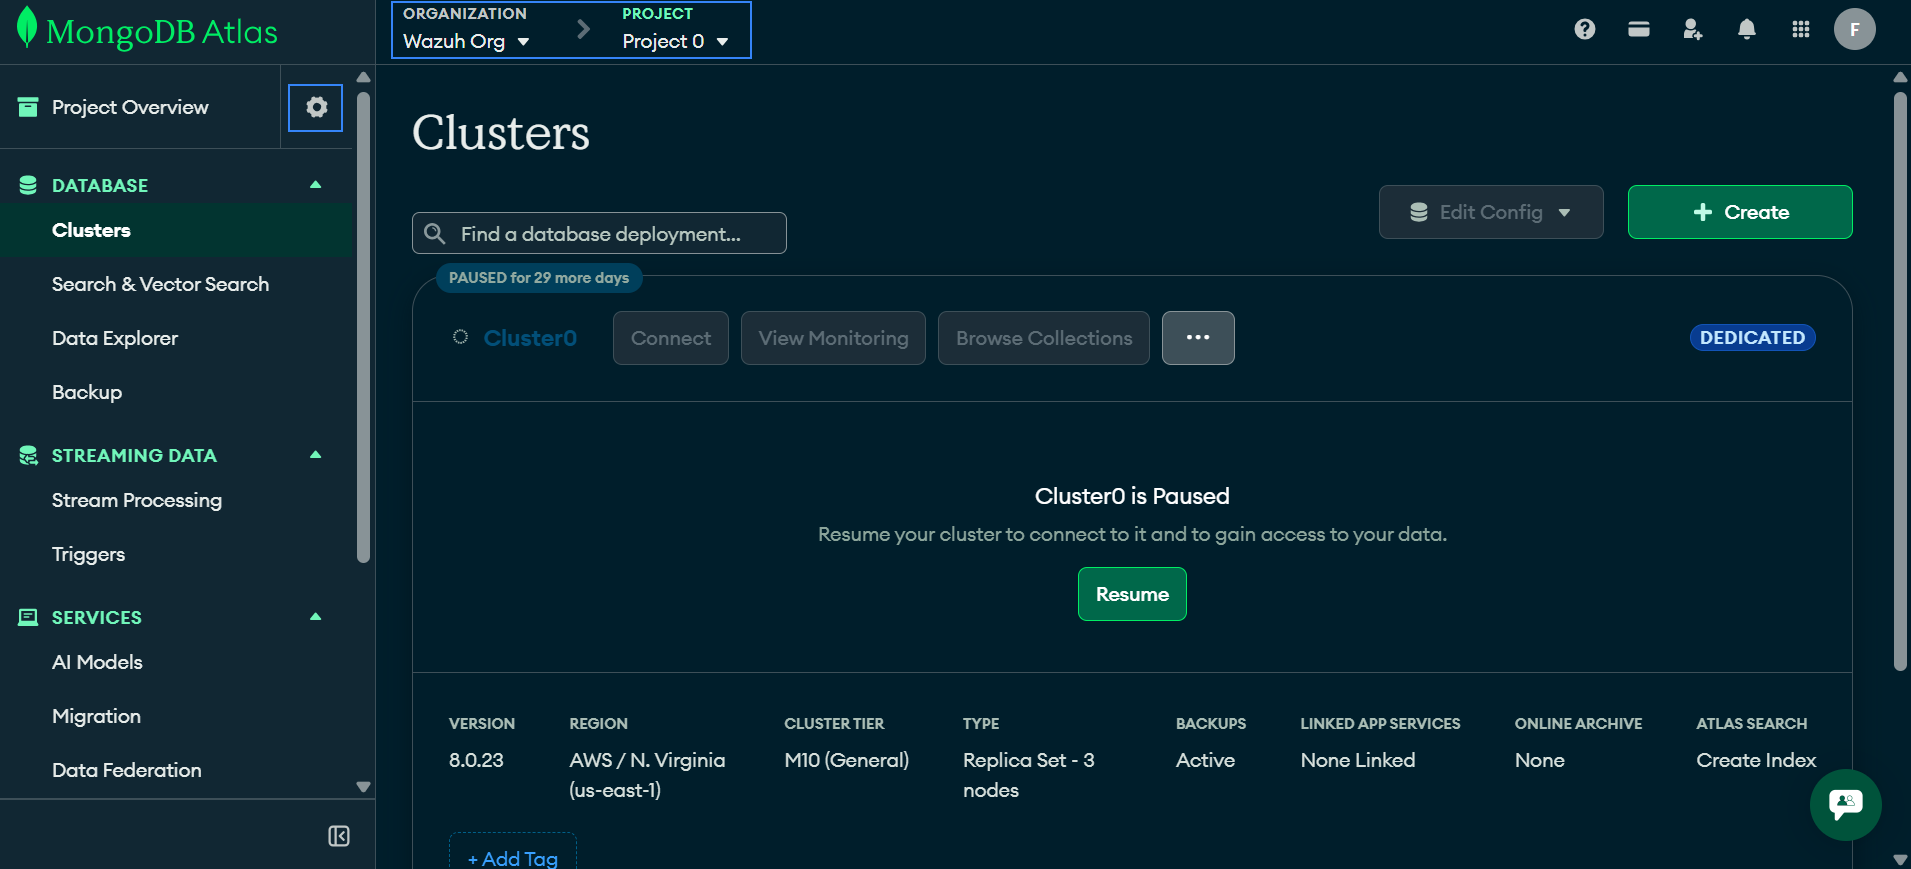
- Select your desired organization and project, then click the settings icon next to Project Overview to open the Project Settings page.
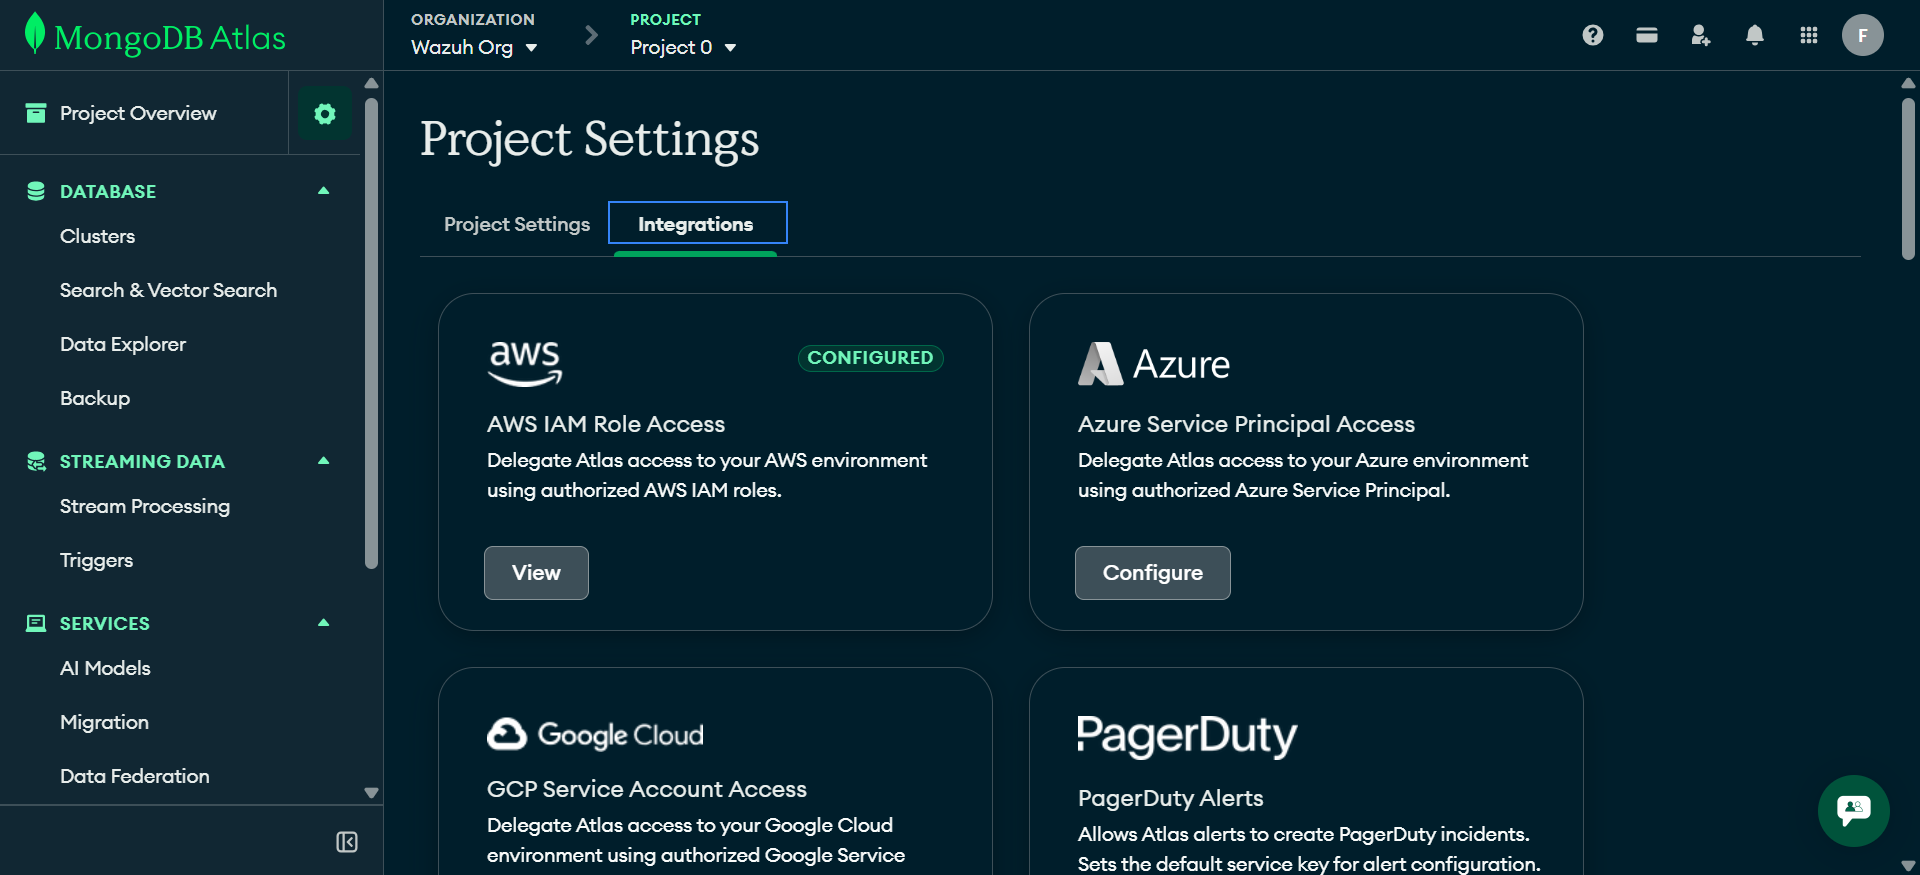
- Click the Integrations tab and click the Configure button in the AWS IAM Role Access panel.
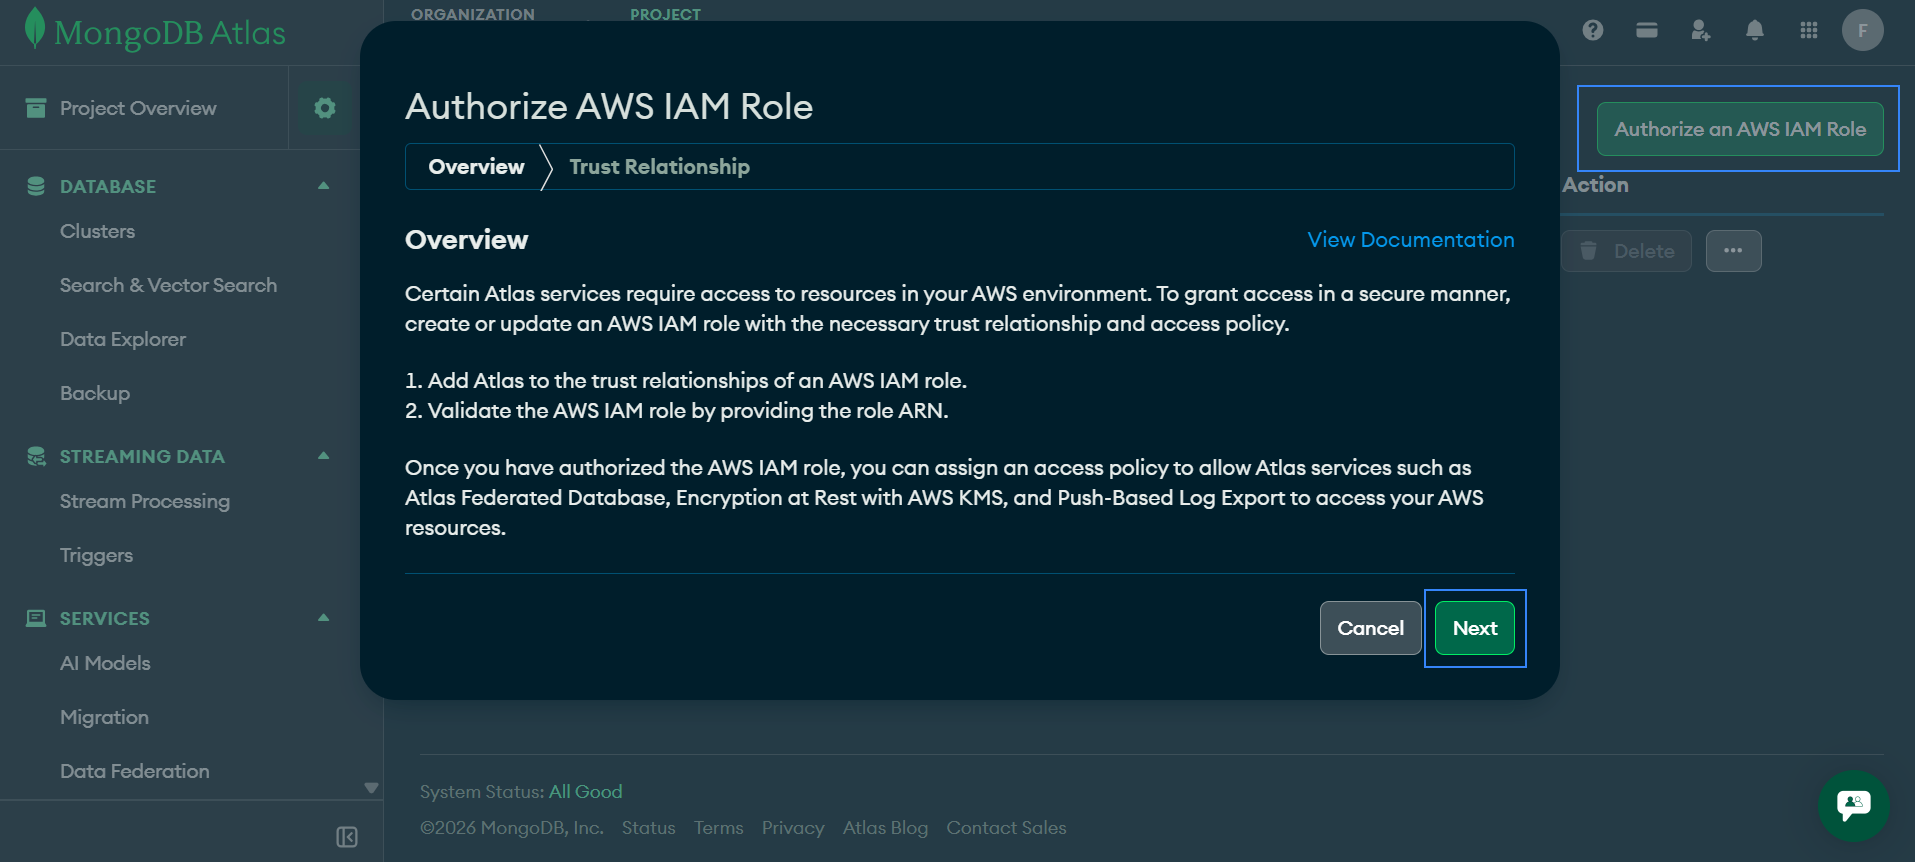
- Click the Authorize an AWS IAM Role button, then click Next.
- Click Create New Role with the AWS CLI to expand the next section.
- Copy the JSON text and save it to a file named
role-trust-policy.json.
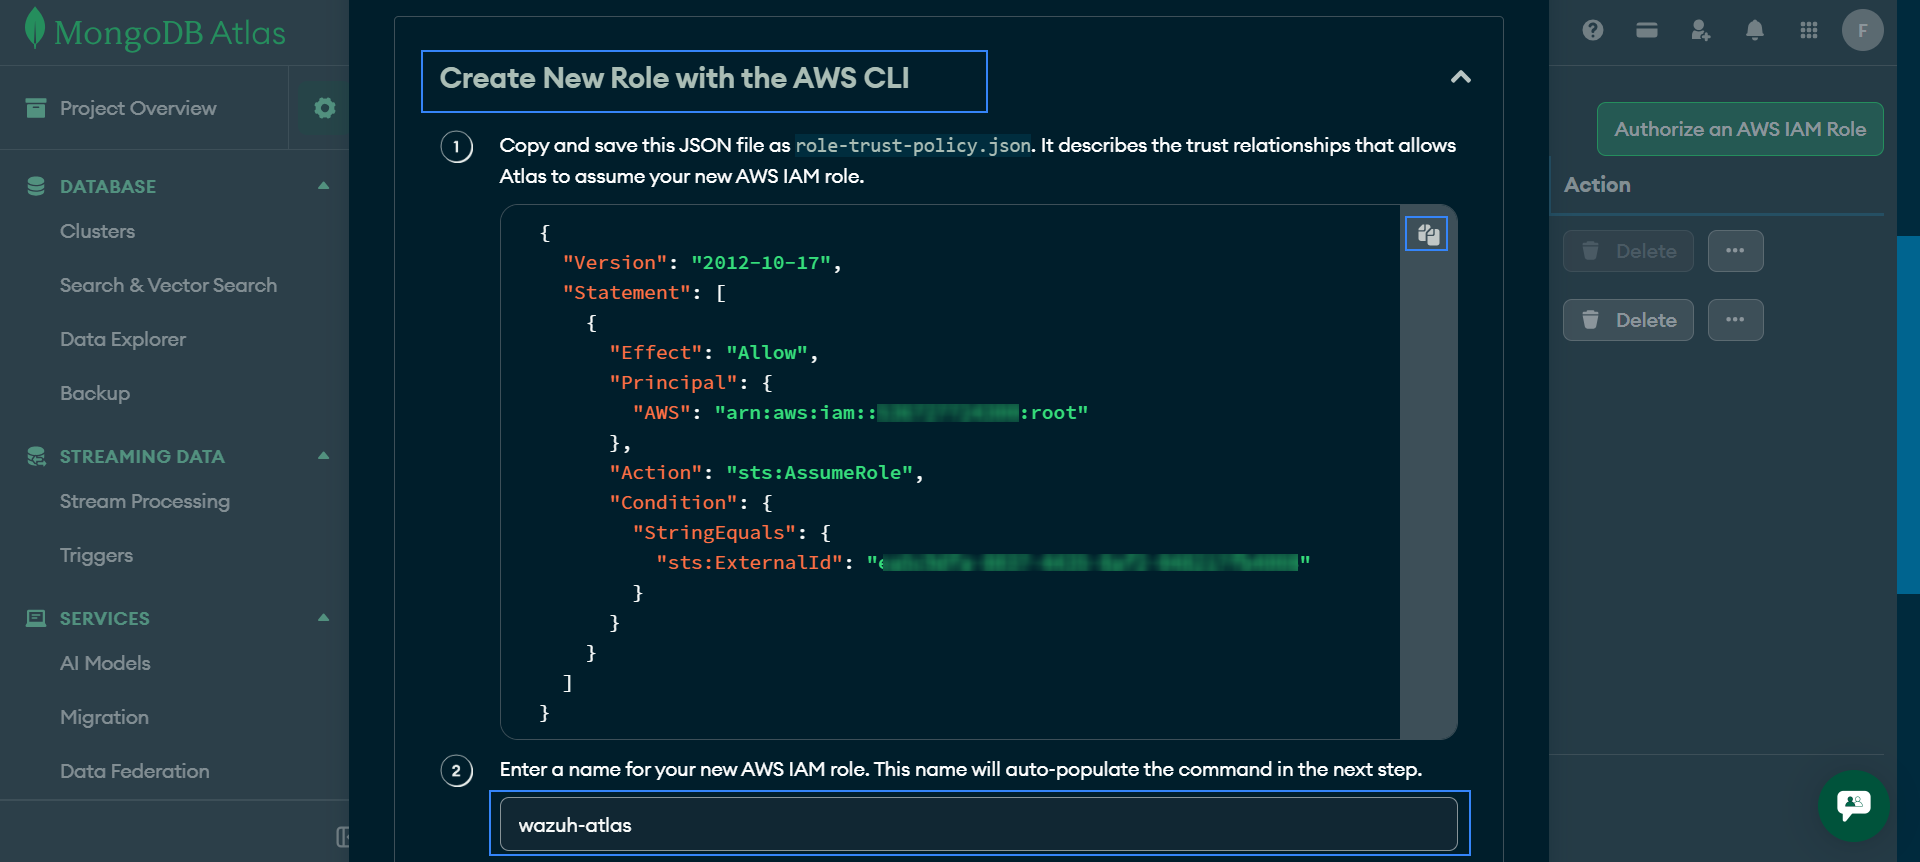
- Enter a name for your new AWS IAM role in the text box.
- Copy the CLI command and enter it at the command prompt. If successful, the CLI command returns a JSON document with information about the newly created AWS IAM role. Locate the field named Arn and copy it into the text box labeled Enter the Role ARN in the Atlas modal window.
- Click Validate and Finish.
Connect Atlas to your AWS S3 bucket
- Navigate to the Project Settings page, click the Integrations tab, and click Configure on the AWS S3 Log Monitoring card.
- Click the Authorize an AWS IAM Role dropdown, select your ARN.
- Click Next.
- Enter the name of your existing S3 bucket as it appears in your AWS account in the Bucket Name field.
- Optional: In the Prefix field, enter a directory name to organize the contents of your S3 bucket. For example, entering
logs/creates alogsdirectory in your S3 bucket to store the exported logs. - Select the types of logs you want to export under Log Type, then click Next. The various log types are seen below:
- Mongod: Diagnostic logs written by each
mongodserver process. They record server startup and shutdown, configuration, connections, slow queries, replication, sharding activity, and other operational events. - Mongod Audit: Auditing logs emitted by
mongodthat track system event actions such as authentication attempts, authorization checks, role changes, and other security-relevant operations. These logs are separate from the main MongoDB log.
- Mongos: Diagnostic logs written by each
mongosrouter process in a sharded cluster. They capture router-specific behavior such as routing of queries to shards, sharding metadata refreshes, and general process diagnostics. - Mongos Audit: Auditing logs emitted by
mongosrouter processes that record the same system events as in a sharded deployment, but from the router’s perspective.
- Copy the access policy generated by Atlas and save it locally with the file name
AtlasS3LogExportPolicy - Copy the CLI command generated by Atlas, then run the command in your terminal to attach the access policy to your AWS IAM role.
- Click Validate to confirm your configuration and credentials are correct before enabling the export. If the configuration is correct, a Bucket validation was successful message is displayed on the screen.
- Click Finish.
Exporting management logs via MongoDB Atlas API
By leveraging the MongoDB Atlas API, the Wazuh manager or Wazuh agent can periodically pull audit logs in near real-time. This medium collects logs on activities happening outside the database engine on the Atlas management platform. This includes actions taken in the Web UI or via the cloud API, such as modifying IP access lists (firewalls), scaling clusters, and creating database users.
Create a service account
To connect to the MongoDB Atlas API, we need to authenticate using a service account. Follow the steps below to create a service account and grant it the required permissions and access to your projects.
- Select your desired organization.
- Navigate to Identity & Access > Applications in the sidebar.
- Click Add new, then select Service Account.
- Enter a preferred Name, Description, and Client Secret Expiration for the service account.
- Select the Organization Permissions menu, select the Organization Read Only role.
- Click Create, then copy and save the Client ID and Client Secret.
Grant programmatic access to projects
Projects do not automatically grant organization service accounts access to projects. To retrieve management logs from a project, we need to grant the service user created for the project programmatic access to the project.
- Select your desired organization and project, then navigate to Security > Project Identity & Access > Users.
- Click Invite to Project.
- Start typing the client ID of your service account in the field, then select your service account from the menu.
- Assign the Project Read Only role to your service account.
- Click Invite to Project.
- Repeat the above steps for all projects that require monitoring.
Wazuh server
Perform the following steps on the Wazuh server to configure the log collection from AWS S3 and the required detection rules.
- Follow the steps in Custom Logs Buckets to configure the AWS S3 bucket for log collection.
- Install the required Python modules:
# apt install python3-venv python3-pip
# pip3 install python-dotenv
- Create a Python script at
/etc/mongodb_atlas/mongo_atlas.pyto connect to the MongoDB Atlas API and retrieve logs:
# mkdir /etc/mongodb_atlas
# touch /etc/mongodb_atlas/mongo_atlas.py
- Add the following Python code to the
/etc/mongodb_atlas/mongo_atlas.pyscript:
#!/usr/bin/env python3

import base64
import json
import time
from datetime import datetime, timezone
from pathlib import Path
import os

import requests
from dotenv import load_dotenv


# LOAD ENV
load_dotenv()

# CONFIG
ATLAS_BASE_URL = "https://cloud.mongodb.com/api/atlas/v2"
OAUTH_TOKEN_URL = "https://cloud.mongodb.com/api/oauth/token"

ORG_ID = os.getenv("MONGODB_ATLAS_ORG_ID")

CLIENT_ID = os.getenv("MONGODB_ATLAS_CLIENT_ID")
CLIENT_SECRET = os.getenv("MONGODB_ATLAS_CLIENT_SECRET")

OUTPUT_FILE = Path("/var/log/mongodb_atlas/atlas_events.json")

PAGE_SIZE = 500

# VALIDATION
required = {
    "MONGODB_ATLAS_ORG_ID": ORG_ID,
    "MONGODB_ATLAS_CLIENT_ID": CLIENT_ID,
    "MONGODB_ATLAS_CLIENT_SECRET": CLIENT_SECRET,
}

missing = [k for k, v in required.items() if not v]

if missing:
    raise ValueError(
        f"Missing environment variables: {', '.join(missing)}"
    )


# OAUTH TOKEN MANAGER
class OAuthTokenManager:
    def __init__(self, client_id, client_secret):
        self.client_id = client_id
        self.client_secret = client_secret

        self.access_token = None
        self.expires_at = 0

    def get_access_token(self):
        now = time.time()

        # Reuse token until close to expiry
        if self.access_token and now < (self.expires_at - 60):
            return self.access_token

        print("Refreshing OAuth token...")

        credentials = f"{self.client_id}:{self.client_secret}"

        base64_auth = base64.b64encode(
            credentials.encode()
        ).decode()

        response = requests.post(
            OAUTH_TOKEN_URL,
            headers={
                "Accept": "application/json",
                "Cache-Control": "no-cache",
                "Authorization": f"Basic {base64_auth}",
                "Content-Type": "application/x-www-form-urlencoded",
            },
            data="grant_type=client_credentials",
            timeout=30,
        )

        if response.status_code != 200:
            raise Exception(
                f"OAuth token request failed "
                f"{response.status_code}: {response.text}"
            )

        data = response.json()

        self.access_token = data["access_token"]

        expires_in = data.get("expires_in", 3600)

        self.expires_at = now + expires_in

        return self.access_token


token_manager = OAuthTokenManager(
    CLIENT_ID,
    CLIENT_SECRET,
)

# CHECKPOINT HANDLING
def load_checkpoint(checkpoint_file):
    if not checkpoint_file.exists():
        return {
            "last_created": "1970-01-01T00:00:00Z",
            "last_event_id": None,
        }

    with open(checkpoint_file, "r") as f:
        return json.load(f)


def save_checkpoint(checkpoint_file, created, event_id):
    checkpoint_file.parent.mkdir(parents=True, exist_ok=True)

    checkpoint = {
        "last_created": created,
        "last_event_id": event_id,
        "updated_at": datetime.now(timezone.utc).isoformat(),
    }

    with open(checkpoint_file, "w") as f:
        json.dump(checkpoint, f, indent=2)

# API REQUEST
def atlas_get(url, params=None):
    token = token_manager.get_access_token()

    headers = {
        "Authorization": f"Bearer {token}",
        "Accept": "application/vnd.atlas.2025-02-19+json",
    }

    response = requests.get(
        url,
        headers=headers,
        params=params,
        timeout=60,
    )

    # Retry once if token expired unexpectedly
    if response.status_code == 401:
        print("Token expired unexpectedly. Refreshing and retrying...")

        token_manager.access_token = None

        token = token_manager.get_access_token()

        headers["Authorization"] = f"Bearer {token}"

        response = requests.get(
            url,
            headers=headers,
            params=params,
            timeout=60,
        )

    if response.status_code != 200:
        raise Exception(
            f"Atlas API Error {response.status_code}: {response.text}"
        )

    return response.json()


# FETCH ALL PROJECTS
def get_all_projects():
    url = f"{ATLAS_BASE_URL}/groups"

    projects = []
    page_num = 1

    while True:
        params = {
            "itemsPerPage": PAGE_SIZE,
            "pageNum": page_num,
        }

        data = atlas_get(url, params=params)

        results = data.get("results", [])

        if not results:
            break

        projects.extend(results)

        if len(results) < PAGE_SIZE:
            break

        page_num += 1

    return projects


# FETCH EVENTS FOR A SCOPE
def fetch_events_for_scope(scope_name, url, checkpoint_file):
    checkpoint = load_checkpoint(checkpoint_file)

    last_created = checkpoint["last_created"]
    last_event_id = checkpoint["last_event_id"]

    total_written = 0
    page_num = 1

    newest_created = last_created
    newest_event_id = last_event_id

    OUTPUT_FILE.parent.mkdir(parents=True, exist_ok=True)

    with open(OUTPUT_FILE, "a", encoding="utf-8") as out_f:

        while True:
            params = {
                "itemsPerPage": PAGE_SIZE,
                "pageNum": page_num,
                "includeCount": "false",
                "minDate": last_created,
            }

            data = atlas_get(url, params=params)

            results = data.get("results", [])

            if not results:
                break

            # Stable ordering
            results.sort(
                key=lambda x: (
                    x.get("created", ""),
                    x.get("id", ""),
                )
            )

            wrote_new_data = False

            for event in results:
                event_created = event.get("created")
                event_id = event.get("id")

                # Skip already processed event
                if (
                    event_created < last_created
                    or (
                        event_created == last_created
                        and event_id == last_event_id
                    )
                ):
                    continue

                enriched_event = {
                    "scope": scope_name,
                    **event,
                }

                out_f.write(
                    json.dumps(
                        enriched_event,
                        ensure_ascii=False,
                    ) + "\n"
                )

                newest_created = event_created
                newest_event_id = event_id

                total_written += 1
                wrote_new_data = True

            out_f.flush()

            if wrote_new_data:
                save_checkpoint(
                    checkpoint_file,
                    newest_created,
                    newest_event_id,
                )

            # Last page
            if len(results) < PAGE_SIZE:
                break

            page_num += 1

            time.sleep(0.25)

    print(f"{scope_name}: downloaded {total_written} new events")


# MAIN ENTRYPOINT
def fetch_events():

    print("Starting MongoDB Atlas event collection...")

    # ORG EVENTS

    org_url = f"{ATLAS_BASE_URL}/orgs/{ORG_ID}/events"

    fetch_events_for_scope(
        scope_name=f"org:{ORG_ID}",
        url=org_url,
        checkpoint_file=Path("/etc/mongodb_atlas/state/org_checkpoint.json"),
    )

    # PROJECT EVENTS

    projects = get_all_projects()

    print(f"Found {len(projects)} projects")

    for project in projects:
        group_id = project["id"]
        project_name = project.get("name", group_id)

        print(f"Fetching project events: {project_name}")

        project_url = (
            f"{ATLAS_BASE_URL}/groups/{group_id}/events"
        )

        checkpoint_file = Path(
            f"/etc/mongodb_atlas/state/project_{group_id}_checkpoint.json"
        )

        fetch_events_for_scope(
            scope_name=f"project:{project_name}",
            url=project_url,
            checkpoint_file=checkpoint_file,
        )

    print("Finished fetching all events.")

if __name__ == "__main__":
    fetch_events()
- Create an environment variable file to hold the MongoDB Atlas credentials:
# touch /etc/mongodb_atlas/.env
- Add the following configuration to the
/etc/mongodb_atlas/.envfile. Replace the variables with the values obtained from create a service account.
MONGODB_ATLAS_ORG_ID=<ORG_ID>
MONGODB_ATLAS_CLIENT_ID=<CLIENT_ID>
MONGODB_ATLAS_CLIENT_SECRET=<CLIENT_SECRET>
Replace:
<ORG_ID>with your Atlas organization ID.<CLIENT_ID>with your Atlas service user ID.<CLIENT_SECRET>with your Atlas service user secret.
- Append the following configuration to the
/var/ossec/etc/ossec.conffile. This configuration runs the script periodically and reads the content of the/var/log/mongodb_atlas/atlas_events.jsonfile for monitoring:
<ossec_config>
  <wodle name="command">
    <disabled>no</disabled>
    <command>python3 /etc/mongodb_atlas/mongo_atlas.py</command>
    <interval>5m</interval>
    <ignore_output>yes</ignore_output>
    <run_on_start>yes</run_on_start>
    <timeout>180</timeout>
  </wodle>

  <localfile>
    <log_format>json</log_format>
    <location>/var/log/mongodb_atlas/atlas_events.json</location>
  </localfile>
</ossec_config>
- Create a file
/var/ossec/etc/rules/mongo_atlas_rules.xml:
# touch /var/ossec/etc/rules/mongo_atlas_rules.xml
- Add the following custom rules to the
/var/ossec/etc/rules/mongo_atlas_rules.xmlfile to generate alerts for events associated with MongoDB Atlas activity:
<group name="MongoDB_Atlas,">
  <rule id="100600" level="1">
    <if_sid>80200</if_sid>
    <field name="aws.service.name">mongodb</field>
    <description>MongoDB Atlas logs grouped.</description>
  </rule>

  <rule id="100601" level="1">
    <field name="links">cloud.mongodb.com/api/atlas</field>
    <description>MongoDB Atlas logs grouped.</description>
  </rule>
</group>

<group name="MongoDB_Atlas,authentication,">
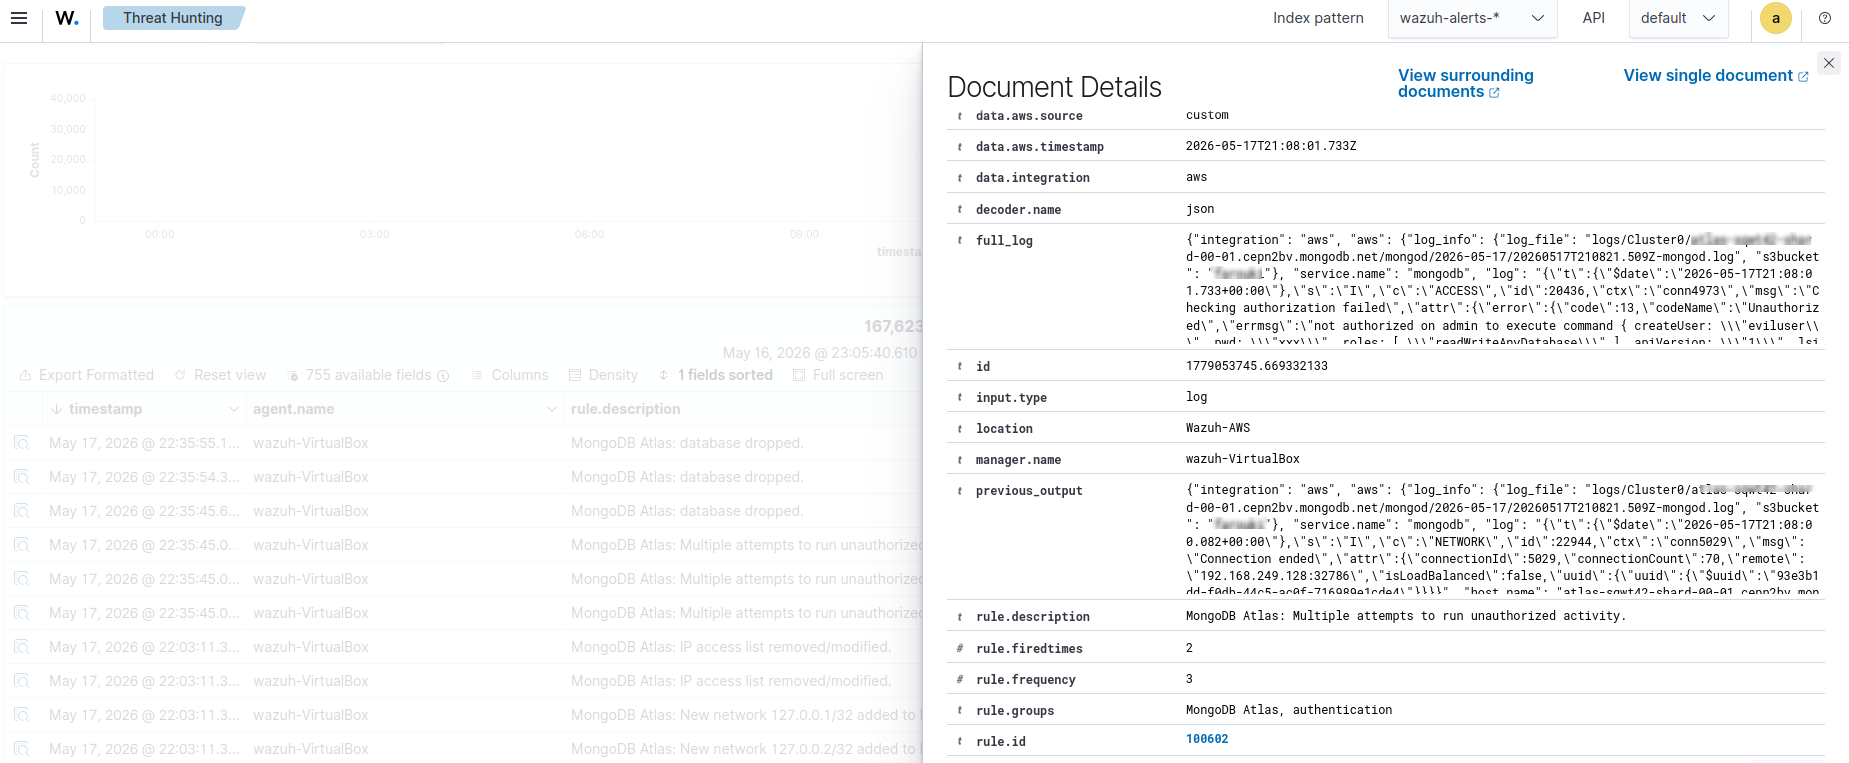
  <rule id="100602" level="10" frequency="3" timeframe="120">
    <if_matched_sid>100600</if_matched_sid>
    <field name="aws.log">"codeName":"Unauthorized"</field>
    <description>MongoDB Atlas: Multiple attempts to run unauthorized activity.</description>
  </rule>

  <rule id="100603" level="10" frequency="3" timeframe="120">
    <if_matched_sid>100600</if_matched_sid>
    <field name="aws.log">Failed to authenticate</field>
    <field name="aws.log">!mms-automation</field>
    <description>MongoDB Atlas: Multiple failed authentication attempts.</description>
    <mitre>
      <id>T1110</id>
    </mitre>
  </rule>

</group>

<group name="MongoDB_Atlas,impact,">
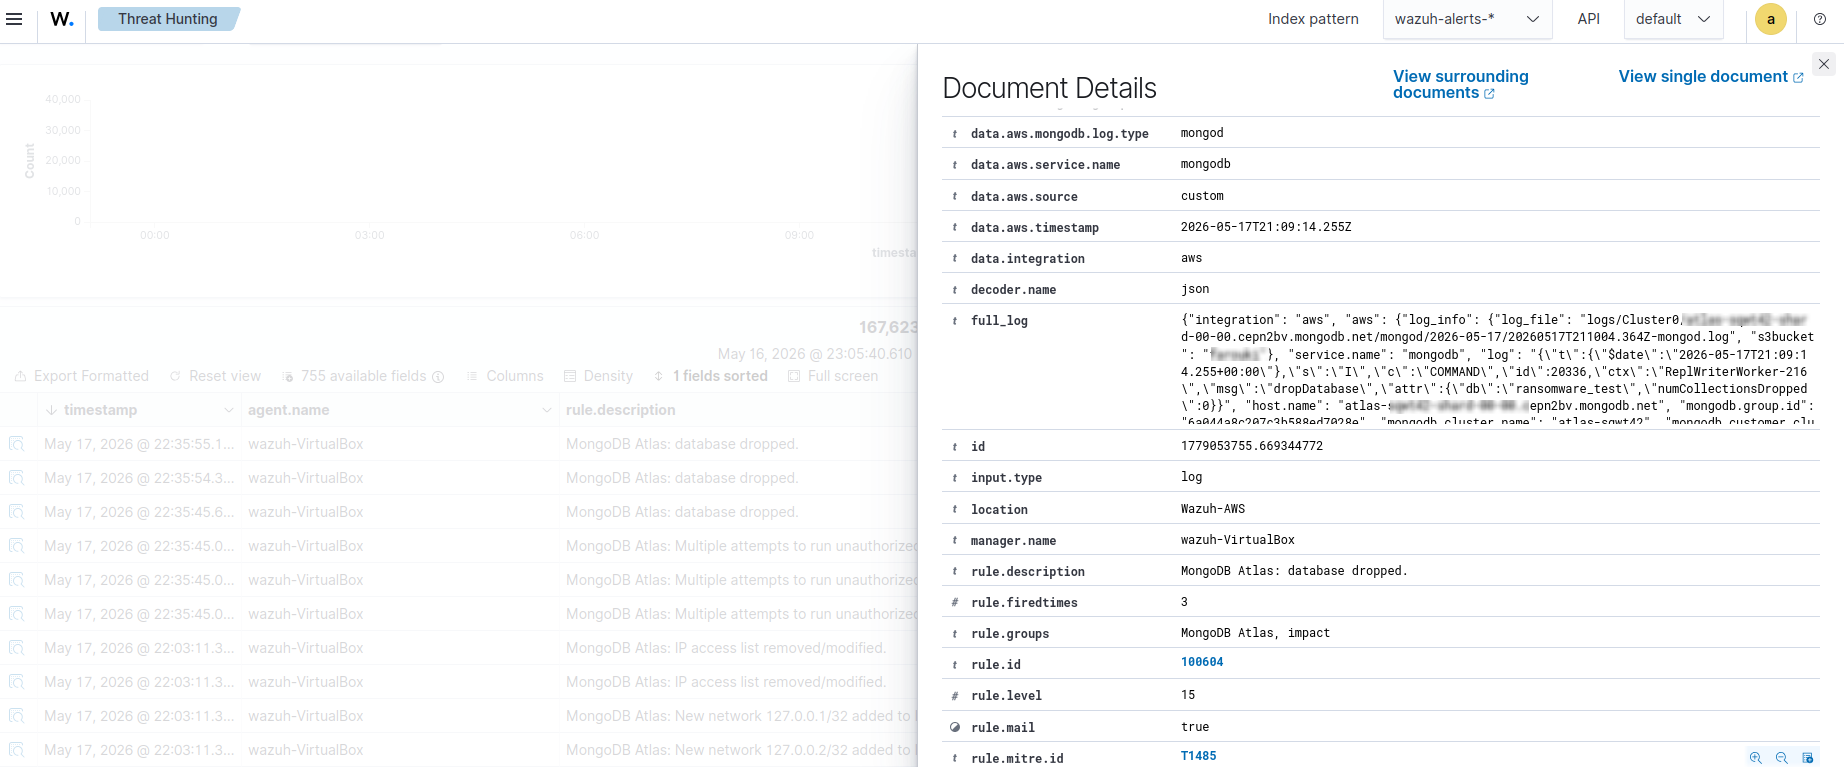
  <rule id="100604" level="15">
    <if_sid>100600</if_sid>
    <field name="aws.log">"msg":"dropDatabase"</field>
    <description>MongoDB Atlas: database dropped.</description>
    <mitre>
      <id>T1485</id>
    </mitre>
  </rule>

  <rule id="100605" level="14">
    <if_sid>100600</if_sid>
    <field name="aws.log">"dropCollection"</field>
    <description>MongoDB Atlas: Collection dropped.</description>
    <mitre>
      <id>T1485</id>
    </mitre>
  </rule>
</group>

<group name="MongoDB_Atlas,persistence,">

  <rule id="100606" level="8">
    <if_sid>100601</if_sid>
    <field name="eventTypeName">MONGODB_USER_ADDED</field>
    <description>MongoDB Atlas: New database user created.</description>
    <mitre>
      <id>T1136</id>
    </mitre>
  </rule>

  <rule id="100607" level="8">
    <if_sid>100601</if_sid>
    <field name="eventTypeName">NETWORK_PERMISSION_ENTRY_ADDED</field>
    <description>MongoDB Atlas: New network $(whitelistEntry) added to IP access list.</description>
    <mitre>
      <id>T1562</id>
    </mitre>
  </rule>

  <rule id="100608" level="8">
    <if_sid>100601</if_sid>
    <field name="eventTypeName">NETWORK_PERMISSION_ENTRY_REMOVED</field>
    <description>MongoDB Atlas: IP access list removed/modified.</description>
    <mitre>
      <id>T1562</id>
    </mitre>
  </rule>

  <rule id="100609" level="8">
    <if_sid>100601</if_sid>
    <field name="eventTypeName">SERVICE_ACCOUNT_CREATED</field>
    <description>MongoDB Atlas: Service account $(clientId) created.</description>
    <mitre>
      <id>T1562</id>
    </mitre>
  </rule>

  <rule id="100610" level="8">
    <if_sid>100601</if_sid>
    <field name="eventTypeName">SERVICE_ACCOUNT_ADDED_TO_GROUP</field>
    <description>MongoDB Atlas: Service account $(clientId) added to group $(groupId).</description>
    <mitre>
      <id>T1562</id>
    </mitre>
  </rule>

</group>
Where:
- Rule ID
100600and100601groups MongoDB Atlas logs. - Rule ID
100602detects multiple attempts to run unauthorized activity. - Rule ID
100603detects multiple failed authentication attempts to a database within the monitored project. - Rule ID
100604detects a database deletion activity. - Rule ID
100605detects a collection deletion activity. - Rule ID
100606detects the creation of a database user. - Rule ID
100607detects that a new network has been added to the IP access list. - Rule ID
100608detects that a new network is removed or modified in the IP access list. - Rule ID
100609detects the creation of a service account. - Rule ID
100610detects when a service account is added to a group.
- Restart the Wazuh manager to apply the changes:
# systemctl restart wazuh-manager
Testing the integration
Perform the following steps using mongosh to validate the integration.
- Failed authentication
Execute the following command to simulate multiple failed authentication attempts to your project:
> for (let i = 1; i <= 3; i++) {
  try {
    let conn = new Mongo("mongodb+srv://<CLUSTER_ID>.mongodb.net");
    let db = conn.getDB("admin");
    db.auth("fakeuser", "wrongpassword");
    print("Attempt " + i + " done");
  } catch (e) {
    print("Attempt " + i + " failed: " + e);
  }
}
Replace <CLUSTER_ID> with your cluster ID.
- Create and delete a database
Connect to your cluster and execute the following command to simulate a database collection creation and deletion:
> use ransomware_test
db.test.insertOne({hello:"world"})
db.test.drop()
db.dropDatabase()
- Multiple unauthorized activities
Connect to your cluster and execute the following command to simulate a user creation via mongosh:
> db.createUser({
  user: "eviluser",
  pwd: "Password123!",
  roles: ["readWriteAnyDatabase"]
})
Visualization
Perform the following steps on the Wazuh dashboard to visualize the MongoDB Atlas alerts generated.
- Navigate to Threat Hunting > Events and click the Events tab.
- Click + Add filter. Then filter by rule.groups.
- In the Operator field, select is.
- In the Value field, input MongoDB_Atlas.
- Click Save.
The image below shows the MongoDB Atlas alerts generated on the Wazuh dashboard.
Conclusion
This blog post demonstrates how to integrate and monitor MongoDB Atlas with Wazuh. This integration helps achieve visibility and control over sensitive data and cloud infrastructure.
By exporting database daemon logs and Atlas event logs to Wazuh, organizations can correlate activity across platforms. This allows teams to detect threats in real-time and respond quickly to potential security incidents.
If you have any questions about this blog post or Wazuh, we invite you to join our community, where our team will be happy to assist you.