Organizations require effective monitoring solutions that not only identify security issues and threats but also integrate with their existing infrastructure. Wazuh is an open source unified XDR and SIEM platform that offers integration approaches with other SIEM and XDR platforms such as Splunk. Integrating Wazuh and Splunk helps you combine the threat detection and security monitoring capabilities of Wazuh with Splunk data analytics. This helps you centralize and gain valuable insights from your security data.
We have recently developed new approaches for integrating Wazuh and Splunk. In these approaches, security data collected from monitored endpoints are sent from the Wazuh server or Wazuh indexer components to your Splunk environment for further analysis. This is done by deploying each solution independently and ingesting Wazuh data into Splunk using data forwarders.
In this blog post, we show the Wazuh server integration using a Splunk Universal Forwarder as the data forwarder and a few use cases.
Infrastructure
We use the following infrastructure to demonstrate how we integrate Wazuh with Splunk using a Splunk Universal Forwarder.
- A CentOS 7 endpoint with the Wazuh 4.5.2 central components deployed. For installation, refer to the Wazuh installation guide.
Note: Although we install the central components, only the Wazuh manager is utilized because we perform the Wazuh server integration.
- An Ubuntu 22.04 endpoint with Splunk Enterprise installed.
Splunk Web
The Wazuh server integration using a Splunk Universal Forwarder operates by reading the /var/ossec/logs/alerts/alerts.json file data on the Wazuh server and forwarding them to Splunk. The Splunk indexer then creates indices for the alerts and displays them on Splunk Web, the user interface for Splunk Enterprise.
Before you configure the Splunk Universal Forwarder, it is essential to configure the Splunk indexer to accept the forwarded events coming from the Wazuh server.
Perform the following tasks on Splunk Web to:
- Configure a receiving port.
- Create the
wazuh-alertsSplunk indices.
Configuring the receiving port
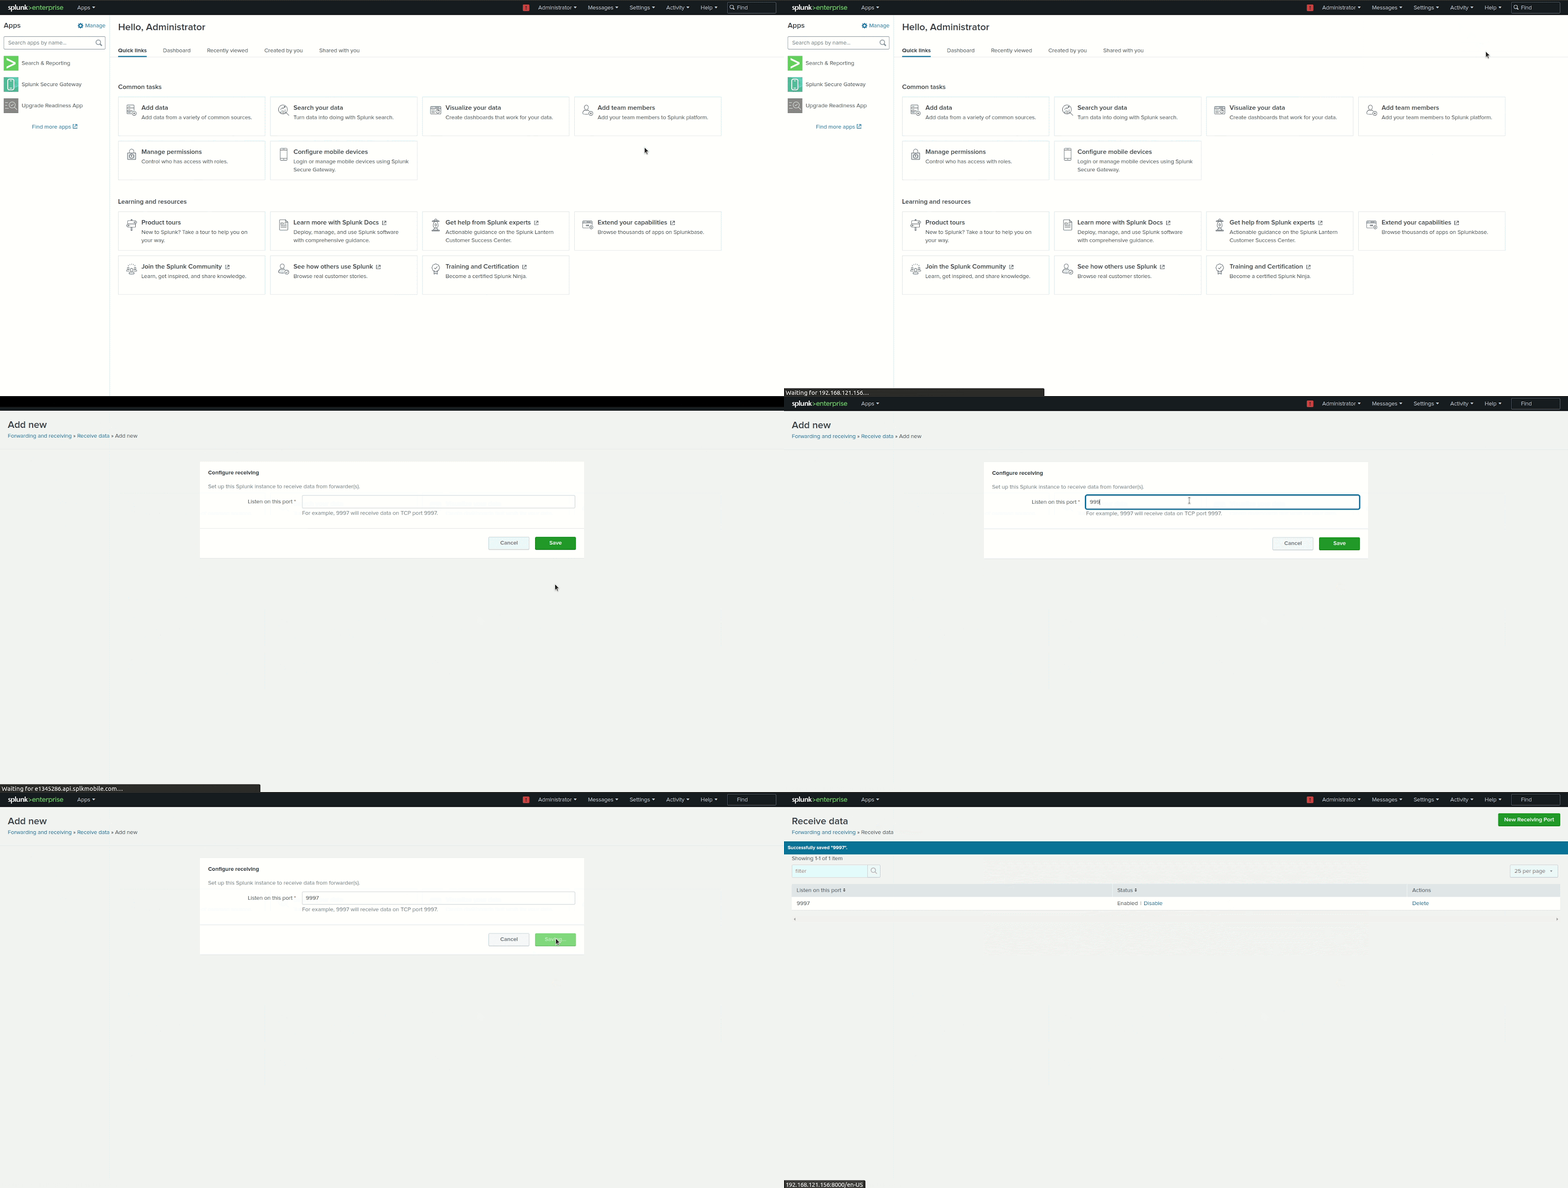
1. Go to Settings > Forwarding and receiving.
2. Under Receive data, click Add new.
3. In the Listen on this port input box, enter 9997, and click Save. This is the Splunk receiving/indexing port.
Configuring the wazuh-alerts indices
Perform the following steps to configure the wazuh-alerts indices.
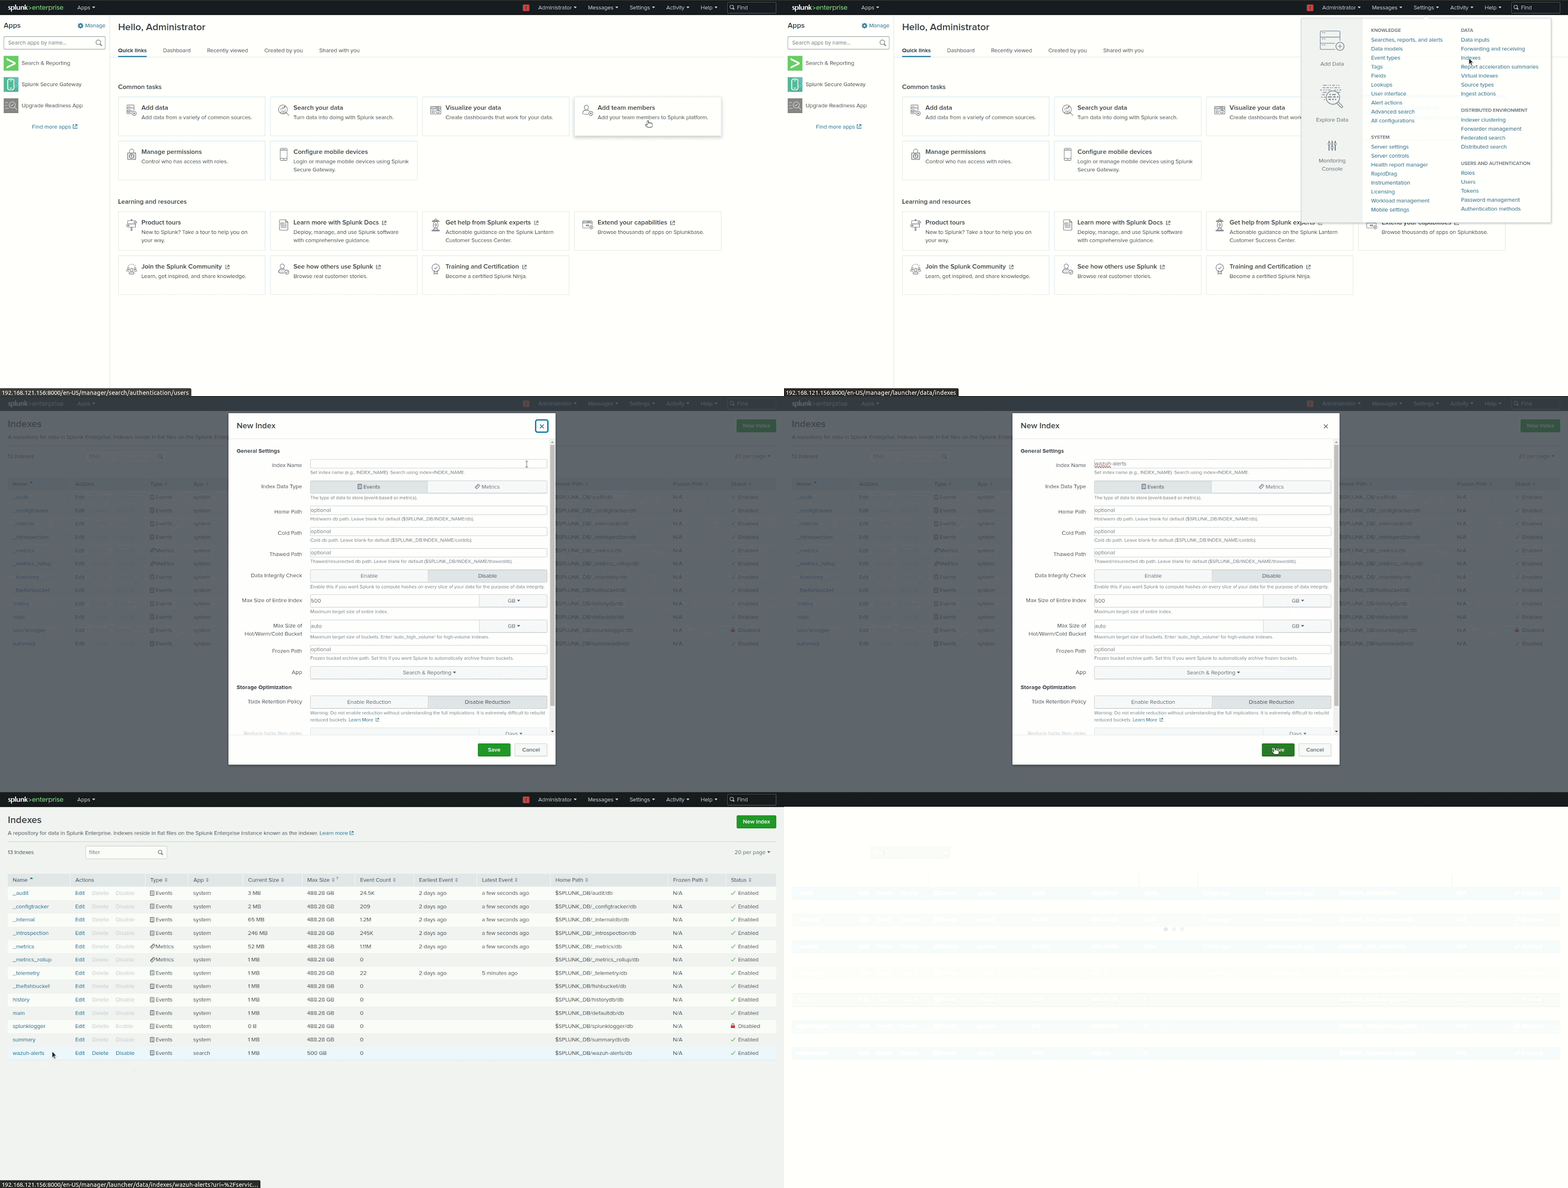
1. Go to Settings > Indexes > New Index.
2. Enter wazuh-alerts in the Index name field and click Save.
Wazuh server
This section focuses on installing and configuring the Splunk Universal Forwarder to read the /var/ossec/logs/alerts/alerts.json file data and forward them to the Splunk indexer.
Install the Splunk Universal Forwarder
On UNIX-based operating systems, the installation comes as a tar file or an installation package (.rpm, .deb, .pkg, etc.). The steps below describe how to install Splunk Universal Forwarder 9.1.1 on the Wazuh server.
Visit the Splunk Universal Forwarder documentation for the installation steps if you are using a different version or another Linux distribution.
Notes:
- Run all the commands below as the root user.
- Change the Splunk Universal Forwarder package name in the commands if you are using a version different from 9.1.1
1. Download the Splunk Universal Forwarder package:
# curl -o splunkforwarder.rpm "https://download.splunk.com/products/universalforwarder/releases/9.1.1/linux/splunkforwarder-9.1.1-64e843ea36b1.x86_64.rpm"
2. Create the Splunk user and group. Splunk recommends that you implement the splunkfwd user from Splunk 9.1.
# useradd -m splunkfwd
# groupadd splunkfwd
3. Create the $SPLUNK_HOME directory:
# export SPLUNK_HOME="/opt/splunkforwarder"
# mkdir $SPLUNK_HOME
4. Move the splunkforwarder package in $SPLUNK_HOME:
# mv splunkforwarder.rpm $SPLUNK_HOME
5. Run the following command to install the package:
# chmod 644 $SPLUNK_HOME/splunkforwarder.rpm
# rpm -i $SPLUNK_HOME/splunkforwarder.rpm
Note: Since we are using the root user for installation, you will receive the following warning: warning: user splunk does not exist - using root. Nonetheless, it won’t impact the installation process.
6. Change the ownership of the Splunk directory and everything under it to the Splunk user and group:
# chown -R splunkfwd:splunkfwd $SPLUNK_HOME
Note: If you change users, you must run the command above again.
7. Run the following command to start the Splunk Universal Forwarder and accept license utilization:
# $SPLUNK_HOME/bin/splunk start --accept-license
Note: When you start the universal forwarder for the first time, it prompts you to create credentials for the Splunk administrative user. Type in the name and password you want to use for the administrative user. This is the user that you log into the universal forwarder with, not the user that you use to log into your system.
Configure the Splunk Universal Forwarder
Perform the steps below to configure the Splunk Universal Forwarder to ingest Wazuh JSON alerts and send them to the Splunk indexer.
1. Create and set the following configuration in the /opt/splunkforwarder/etc/system/local/inputs.conf file. Replace <WAZUH_SERVER_HOST> with any name of your choice. This tags the logs with the host forwarding the logs in the Splunk indexer.
[monitor:///var/ossec/logs/alerts/alerts.json]
disabled = 0
host = <WAZUH_SERVER_HOST>
index = wazuh-alerts
sourcetype = wazuh-alerts
This configures the Splunk forwarder to monitor the Wazuh /var/ossec/logs/alerts/alerts.json alerts file.
2. Create and set the following configuration in the /opt/splunkforwarder/etc/system/local/props.conf file to parse the data forwarded to Splunk:
[wazuh-alerts]
DATETIME_CONFIG =
INDEXED_EXTRACTIONS = json
KV_MODE = none
NO_BINARY_CHECK = true
category = Application
disabled = false
pulldown_type = true
The DATETIME_CONFIG = field is left blank to use the default timestamp extraction logic of Splunk.
3. Create and set the following configuration in the /opt/splunkforwarder/etc/system/local/outputs.conf file to define how to forward the alerts to Splunk. Replace <SPLUNK_INDEXER_ADDRESS> with the IP address of the Splunk server. For cloud instances, the Splunk indexer address is the cloud instance address.
defaultGroup = default-autolb-group
[tcpout:default-autolb-group]
server = <SPLUNK_INDEXER_ADDRESS>:9997
[tcpout-server://<SPLUNK_INDEXER_ADDRESS>:9997]
4. Restart the Splunk Universal Forwarder to apply the configuration changes:
# cd $SPLUNK_HOME/bin
# ./splunk restart
5. Verify that your Splunk indexer is registered as a forward-server
# $SPLUNK_HOME/bin/splunk list forward-server
Output
Warning: Attempting to revert the SPLUNK_HOME ownership
Warning: Executing "chown -R splunkfwd:splunkfwd /opt/splunkforwarder"
Active forwards:
	<YOUR_SPLUNK_INDEXER_ADDRESS>:9997
Configured but inactive forwards:
	None
Note: If you have a distributed environment with multiple Wazuh servers, you have to repeat the steps above on each Wazuh server.
Verify the integration
To check the integration with Splunk, access the Splunk Web and search for the wazuh-alerts Splunk index as follows.
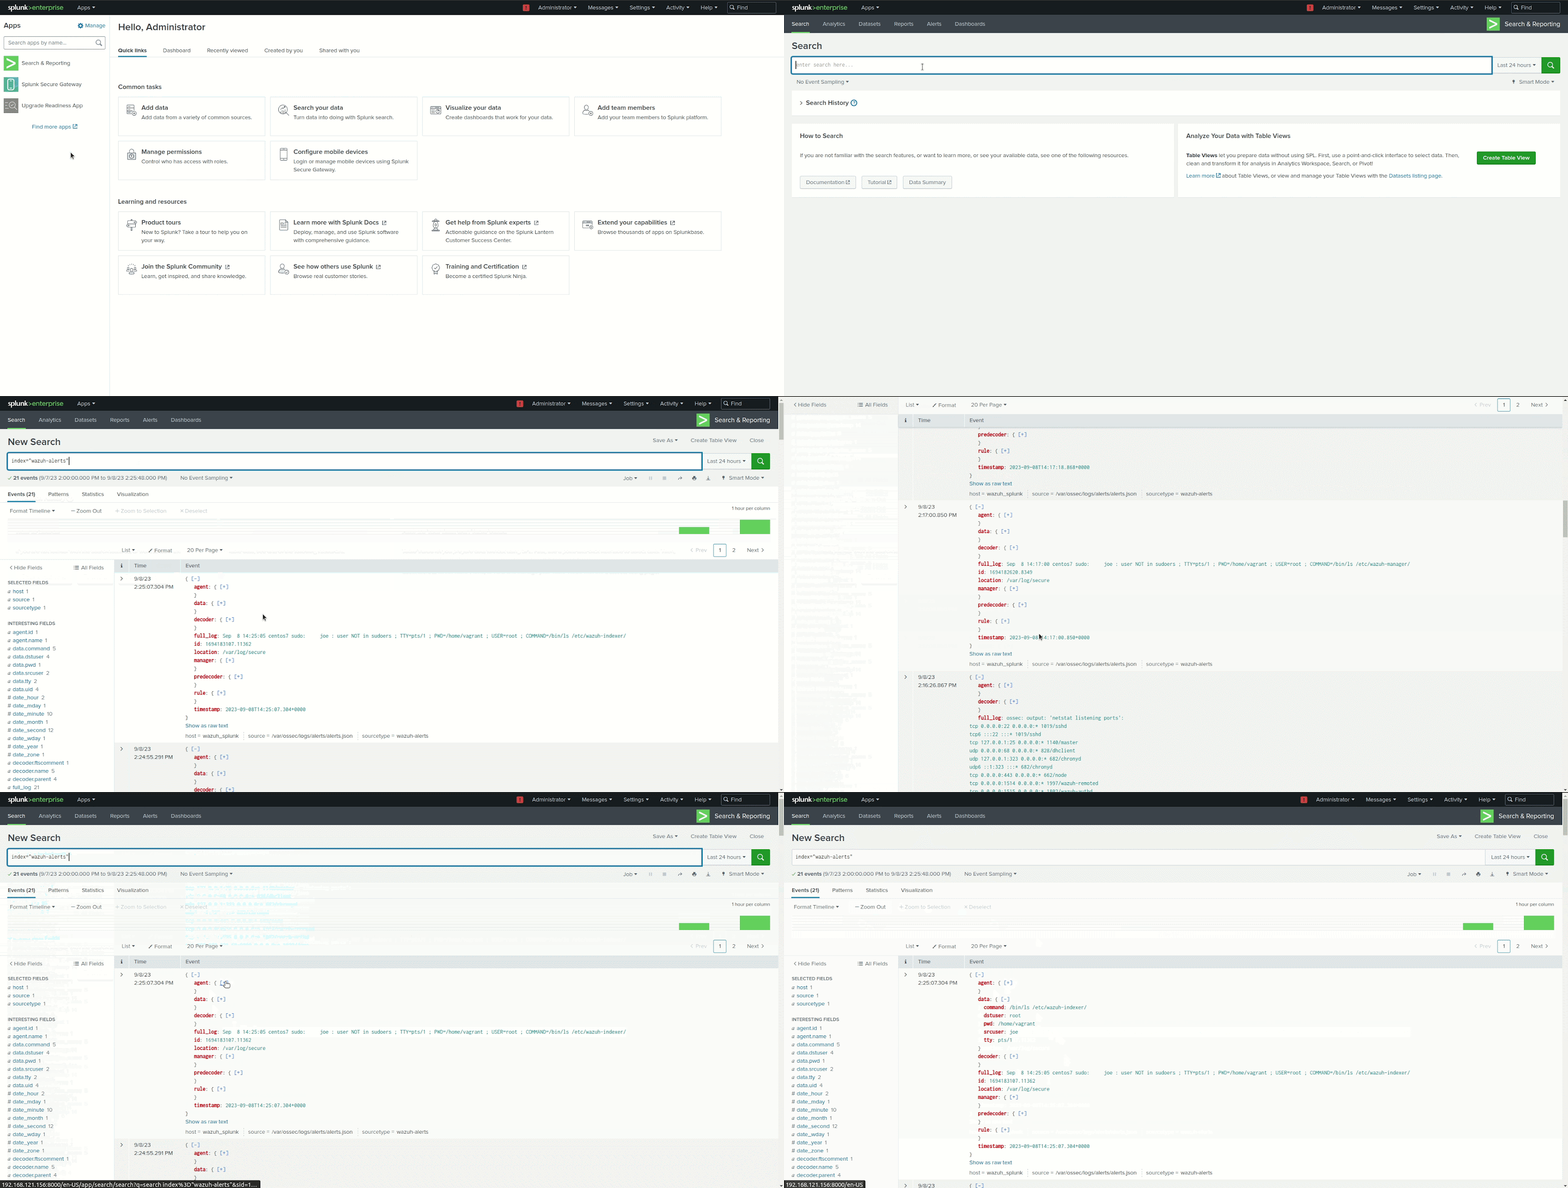
1. Go to Search & Reporting.
2. Enter index="wazuh-alerts" and run the search.
The Wazuh events indexed in the Splunk indexer will be displayed in your Splunk Web interface.
Use cases
Once Wazuh data have been ingested into Splunk and the wazuh-alerts indices created, it is possible to write Splunk queries to perform further analysis and retrieve useful information.
Create scheduled alerts for brute force attacks
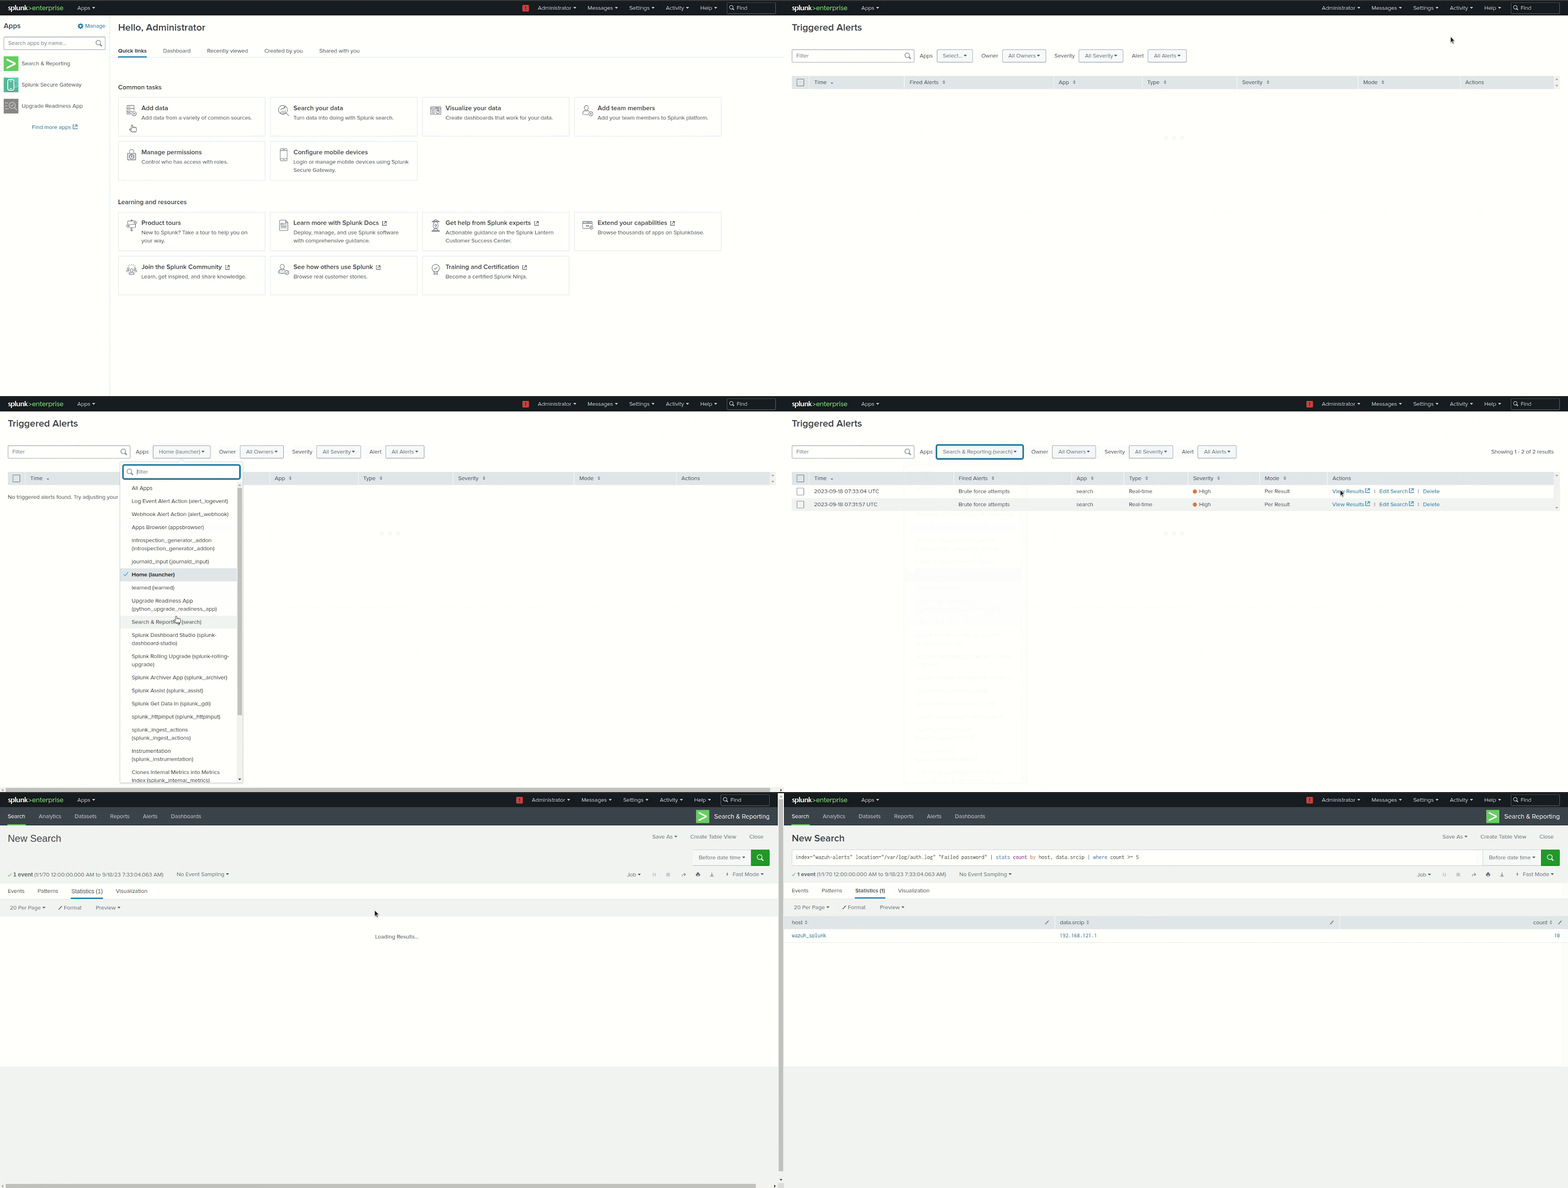
In this use case, we create a search query that detects brute force login attempts and display the results on the Triggered Alerts page in Splunk web.
A brute force attack consists of multiple login attempts using various passwords by an unauthorized user with the hope of eventually guessing the correct one.
Requirements
- An Ubuntu 22.04 endpoint with Wazuh agent 4.5.2 installed and enrolled to the Wazuh server. To install the Wazuh agent, refer to the Wazuh agent installation guide. This serves as the victim endpoint.
- A second CentOS 7 endpoint which serves as an attacker endpoint.
Follow the next steps to create the scheduled alerts.
Splunk Web
Set the alert conditions
1. Go to Search & Reporting.
2. Enter the query below and run the search:
index="wazuh-alerts" location="/var/log/auth.log" "Failed password" | stats count by host, data.srcip | where count >= 5
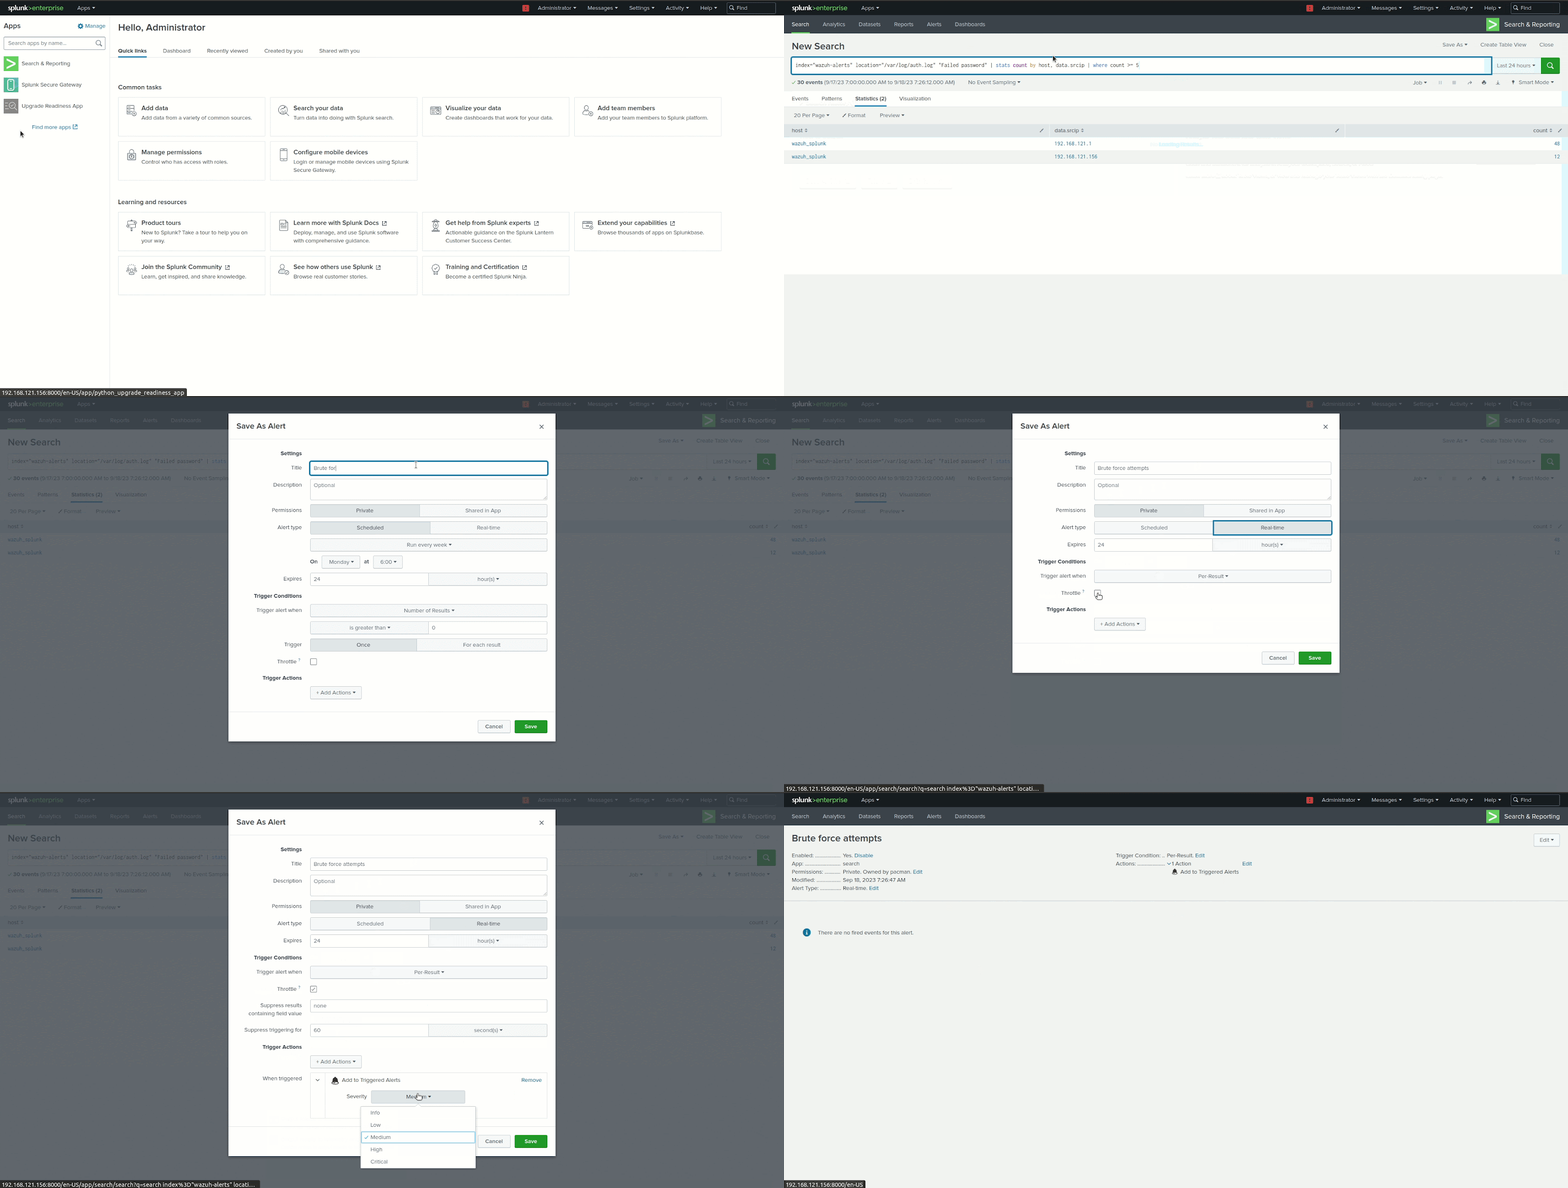
3. Click the Save As button above the search results and choose Alert.
Configure the alert settings
1. Enter a title and an optional description.
2. Specify the permissions.
3. Select the Real-time alert type. This type of alert triggers immediately when the condition is met.
4. Change the Expires setting if needed. This setting controls the lifespan of triggered alert records, which appear on the Triggered Alerts page.
5. Select the Per-Result trigger option. This option is selected by default.
6. Configure a trigger throttling period.
7. Select at least one alert action that occurs when the alert triggers. In our case, we choose the Add to Triggered Alerts option.
8. Assign an appropriate severity level to the alert. In our case, we selected High as severity.
9. Click Save.
Attacker endpoint
We install the Hydra utility and perform a brute force attack from this endpoint.
1. Install Hydra:
$ sudo yum install hydra -y
2. Create a list of passwords in the /tmp directory:
$ cat > /tmp/passlist.txt << EOF
q8H@b3NpXm
D7s#F6tLzV
P5k&G2mTnQ
M4r!JwXpYs
L1c@ZvQ9sP
Z9pP5k&frw
EOF
3. Launch the brute force attack against the SSH service of the Ubuntu endpoint:
$ sudo hydra -l root -P /tmp/passlist.txt <UBUNTU_IP> ssh
Replace <UBUNTU_IP> with the IP address of the Ubuntu endpoint.
Visualizing the triggered results
1. From the top-level navigation bar, select Activity > Triggered Alerts.
2. In the Apps field, select Search & Reporting.
3. Filter the alerts according to App, Owner, Severity, and Alert (alert name).

Analyzing vulnerability detection data
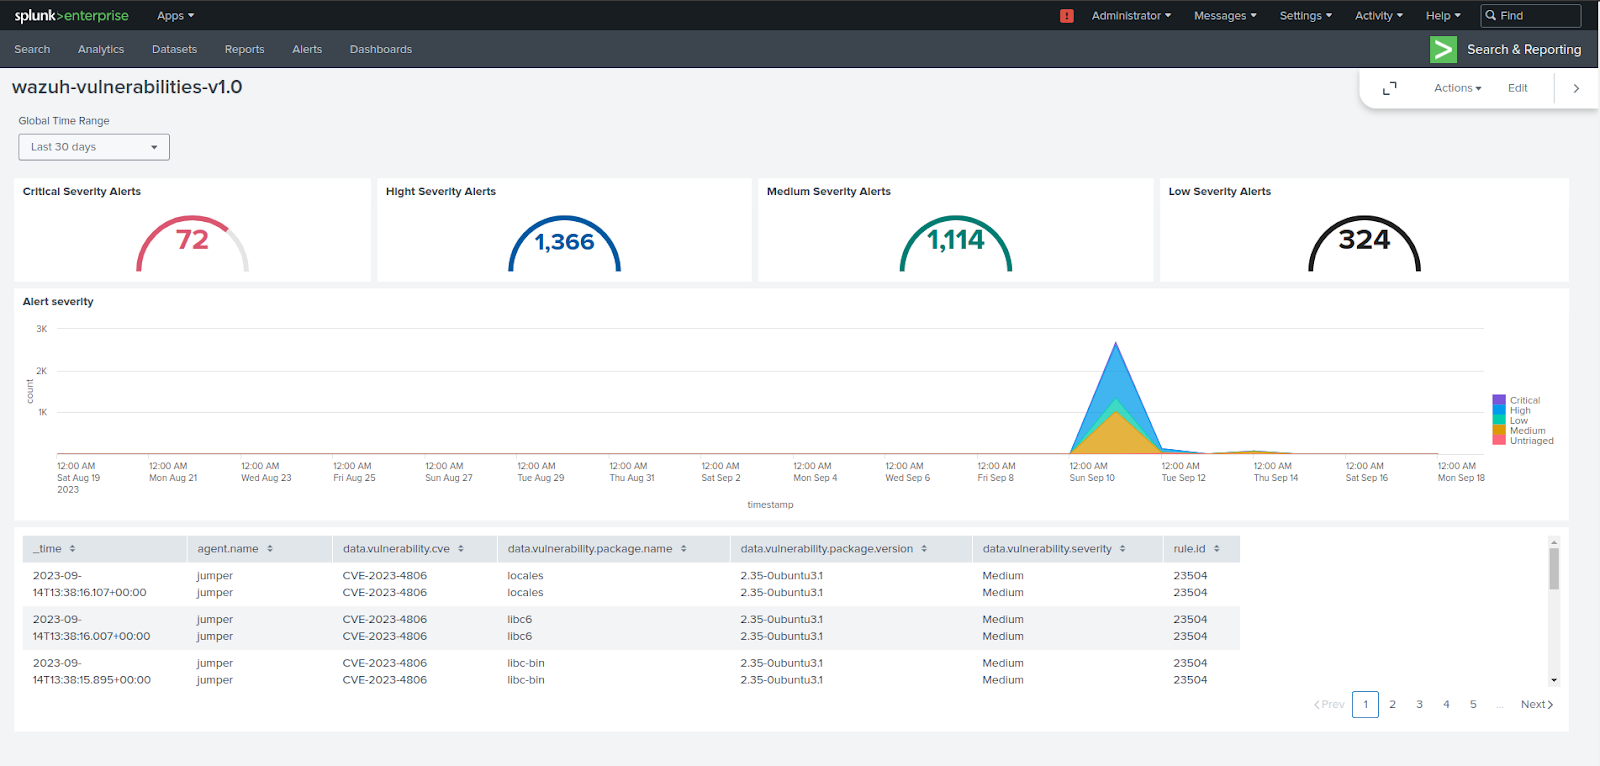
The Wazuh Vulnerability Detector module identifies known vulnerabilities in the software and services running on monitored endpoints.
In this use case, we configure this module on the Wazuh server to scan the Ubuntu endpoint. Then, use a custom dashboard built by Wazuh to visualize the scan results in Splunk.
Requirements
- An Ubuntu 22.04 endpoint with Wazuh agent 4.5.2 installed and enrolled to the Wazuh server. To install the Wazuh agent, refer to the Wazuh agent installation guide.
Configure the Vulnerability Detector module on the Wazuh server
Perform the steps below to configure the vulnerability detection scan for Ubuntu endpoints.
1. Enable the Wazuh Vulnerability Detector module in the <vulnerability-detector> block of the
/var/ossec/etc/ossec.conf configuration file on your Wazuh server. Set the value for the <enabled> tag to yes to scan for Ubuntu operating system vulnerabilities:
<vulnerability-detector>
   <enabled>yes</enabled>
   <interval>5m</interval>
   <min_full_scan_interval>6h</min_full_scan_interval>
   <run_on_start>yes</run_on_start>

   <!-- Ubuntu OS vulnerabilities -->
   <provider name="canonical">
      <enabled>yes</enabled>
      <os>trusty</os>
      <os>xenial</os>
      <os>bionic</os>
      <os>focal</os>
      <os>jammy</os>
      <update_interval>1h</update_interval>
   </provider>

   <!-- Debian OS vulnerabilities -->
   <provider name="debian">
      <enabled>yes</enabled>
      <os>buster</os>
      <os>bullseye</os>
      <update_interval>1h</update_interval>
   </provider>

   <!-- RedHat OS vulnerabilities -->
   <provider name="redhat">
      <enabled>no</enabled>
      <os>5</os>
      <os>6</os>
      <os>7</os>
      <os>8</os>
      <os>9</os>
      <update_interval>1h</update_interval>
   </provider>

   <!-- Amazon Linux OS vulnerabilities -->
   <provider name="alas">
      <enabled>no</enabled>
      <os>amazon-linux</os>
      <os>amazon-linux-2</os>
      <update_interval>1h</update_interval>
   </provider>

   <!-- Arch OS vulnerabilities -->
   <provider name="arch">
      <enabled>no</enabled>
      <update_interval>1h</update_interval>
   </provider>

   <!-- Windows OS vulnerabilities -->
   <provider name="msu">
      <enabled>no</enabled>
      <update_interval>1h</update_interval>
   </provider>

   <!-- Aggregate vulnerabilities -->
   <provider name="nvd">
      <enabled>yes</enabled>
      <update_interval>1h</update_interval>
   </provider>
</vulnerability-detector>
2. Restart the Wazuh manager service to apply the changes:
# systemctl restart wazuh-manager
Import the Wazuh vulnerabilities dashboard on Splunk web
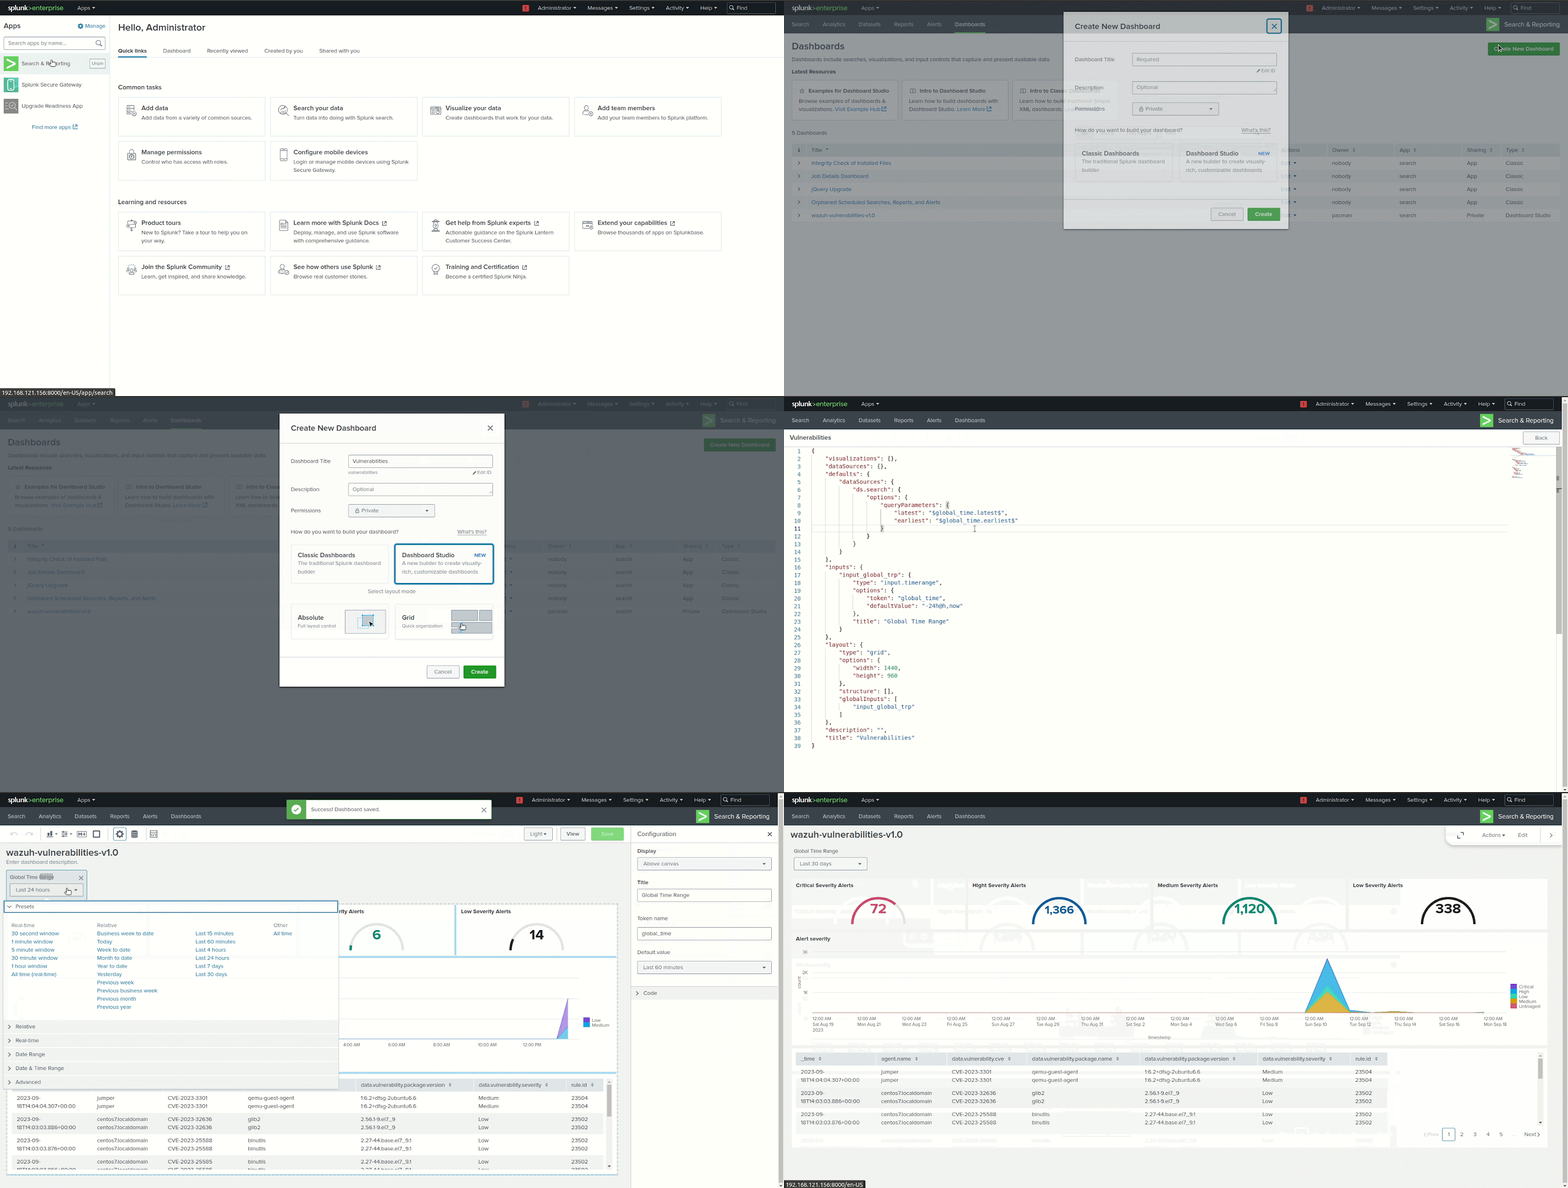
Perform the steps below to import the Wazuh vulnerabilities dashboard in Splunk web.
1. Download the wz-sp-4.x-9.x-wazuh-vulnerabilities dashboard.
2. Navigate to Search & Reporting in Splunk Web.
3. Click Dashboards and click Create New Dashboard.
4. Enter a dashboard title and select Dashboard Studio.
5. Select Grid and click on Create.
6. Click on the icon.
7. Copy the content of the downloaded dashboard file and paste it, replacing everything in the source.8. Click Back and click Save.
Conclusion
In this blog post, we explore the steps to configure the Wazuh server integration using the Splunk Universal Forwarder. We cover steps on how to set up the Splunk indexer, forward Wazuh alerts, and visualize them in Splunk.
Additionally, we also demonstrate use cases such as creating scheduled alerts in Splunk to detect brute force attacks and visualizing the Wazuh vulnerability detection data in Splunk.
We provide alternative integration methods, such as the Wazuh server integration and the Wazuh indexer integration with Splunk, using Logstash as the data forwarder. These options also provide flexibility to tailor the integration to your specific needs and infrastructure.
References
